IJSRSET184855 | Received : 05 May 2018 | Accepted : 17 May 2018 | May-June-2018 [(4) 8 : 145-155]
145
Analysis of Different Material Testing By Using Of Different
Material Testing Equipment In Matlab
Shubham Sanjay Sorate, Priya Umesh Kanase
UG Student, Department of Mechanical Engineering, Tatyasaheb Kore Institute of Engineering & Technology, WaranaNagar, Kolhapur, Maharashtra, India
ABSTRACT
Whenever a purchasing any kind of engineering or construction material/metal ,Customer wanted safety or withstand able proof of this material as per their application.So that material is to be tested by standard method to confirming the material.There is different types of material Testing used in matlab in India also in world.In this paper we analyse the different type of material testing done on different particular operation for various material In matlab tested by us by using different machines like,Polyvac 2000 Spectro Chemical Testing, Positive Material Identification(PMI)Machines,Brinnel & Rockwell hardness tester, Universal Testing Machines(UTM),Impact Tester, Micro Examination Tester, & etc.
Keywords: Material Testing-Chemical Testing & Mechanical Testing.
I.
INTRODUCTIONWhile studying about material the first question arises is that what is material testing? Why material testing is required? And How material testing carried out actually? this is all discussed below.
Material Testing is a well established technique used to determine the ‘Physical’ and ‘Mechanical’ properties of raw materials and components from a human hair to steel, composite material and ceramics. The Material Testing are required to testing material and characterization is carried out to understand the fundamental properties of material when subjected to service and environmental loading and operating conditions. Material testing helps us to understand and quantify whether a specific material is suitable to a particular application.
Example-In India, ‘India Pistons Limited’ is leading piston manufacturing company, and mainly manufactures the Cast aluminium Alloy Pistons. Company required huge amount of aluminium as a raw material. And this raw material is came from mine and specified dealers. But While mining process the natural aluminium contains the more impurities
and content element than the required for manufacturing the cast aluminium alloy piston. So that material is purified and tested by various testing method and obtained cast aluminium is allow to manufacture the piston.
If material is not properly tested and used in a automotive, aerospace or biomedical product can be very dangerous as it has the potential of putting an end users life in danger.
Different Material Testing methods performed in matalabs in india as below:
Chart 1. Method Of material Testing
testing, chemical analysis and metallurgical examination of steel, aluminum, iron and many other metal products and alloys.
Working principle-Spectrochemical analysis, methods of chemical analysis that depend upon the measurement of the wavelength and the intensity of electromagnetic radiation. Its major use is in the determination of the arrangement of atoms and electrons in molecules of chemical compounds on the basis of the amounts of energy absorbed during changes in the structure or motion of the molecules. In its restricted and more common usage two methods usually are implied:
1.Ultraviolet (non visible) and visible emission spectroscopy and
2.Ultraviolet, visible, and infrared absorption spectrophotometry.
In emission spectroscopy, atoms are excited to energy levels higher than their lowest normal levels (ground states) by means of electrical discharges (arcs, sparks) or flames. Identification of the elemental composition of an unknown substance is based on the fact that when the excited atoms return to lower energy states, they emit light of characteristic frequencies. These characteristic frequencies are separated into an ordered sequence (spectrum) by diffraction or refraction (deflection of the path of the light by a grating or a prism) for observation in a spectroscope (visual), spectrograph (photographic), or
spectrometer
(photoelectric). The process consists of four interdependent steps:1. Vaporization of the sample,
2. Electronic excitation of its atoms or ions,
3. Dispersion of the emitted or absorbed radiation into its component frequencies, and
4. Measurement of the intensity of the radiation, usually at wavelengths at which the intensity is greatest.
Ordinarily, emission spectrochemical analysis is applied to the qualitative and quantitative determination of metallic elements, but it is not restricted to them. The method is among the most sensitive of all analytical methods: a few milligrams of a solid sample usually suffice for the detection of metallic elements present to the extent of a few parts per million or less. In addition, the method is capable
of detecting several atomic species simultaneously, thus obviating chemical separations.
Quantitative analysis by emission spectroscopy depends upon the fact that the quantity of light (i.e.,the intensity) emitted at a given wavelength is proportional to the number of atoms vaporized and excited. The quantity of a given element is usually determined by a comparative method—that is, the intensity of the radiation emitted at a selected wavelength by the sample is compared with the intensity of the radiation emitted by a standard of known composition. Other spectrochemical methods useful in elemental analysis are atomic absorption spectrometry and atomic fluorescence spectrometry. Both methods resemble the flame method of emission spectroscopy (i.e., a method that uses flame as the energy source to excite atoms) in that a solution of the sample is usually vaporized into a flame of hydrogen or acetylene in air or oxygen. In addition, light of the same wavelength as that emitted by the desired element is passed through the flame. A certain fraction of the light is absorbed by atoms that are in their ground electronic state. The quantity of radiation absorbed is proportional to the concentration of atoms in the flame in their ground state and, because thermal equilibrium exists, to the total concentration of that atomic species.
Atomic fluorescence spectrometry makes use of the same basic instrumental components as atomic absorption spectrometry; however, it measures the intensity of the light emitted by atoms that have been excited from their ground state by the absorption of light of shorter wavelength than that emitted. The atomic absorption method is particularly well adapted to the determination of the alkali and alkaline earth metals.
II.
OBJECTIVETo Know the different types of testing is done in the material testing agency or material testing lab & analyzing the results for each material for different kind of testing.
The testing is classified as per sample material and customer specification
III.
TESTINGA.CHEMICAL TESTING
1) FOR MILD STEEL MATERIAL (ASTM E 415:2014/IS 8811:1998)
Scope & Application-This procedure provides for Optical Emission Spectrometer Analysis of Low Alloy Steel, Plain Carbon Steel, Carbon Steel, Cast Iron Products base samples in solid form by the point to plane excitation technique for the following elements in the concentration ranges .
Sample Description-25 X 25 mm Square Block Standard Specification:- BS 970 Gr.EN 19 CHEMICAL ANALYSIS:-
Test Method :- ASTM E 415:2014/IS 8811:1998
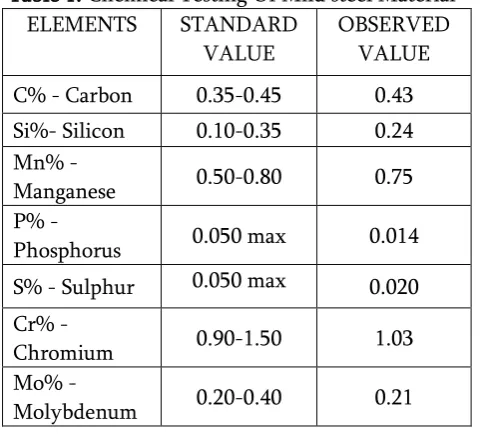
Table 1. Chemical Testing Of Mild steel Material ELEMENTS STANDARD
VALUE
OBSERVED VALUE
C% - Carbon 0.35-0.45 0.43 Si%- Silicon 0.10-0.35 0.24 Mn%
-Manganese 0.50-0.80 0.75
P% -
Phosphorus 0.050 max 0.014 S% - Sulphur 0.050 max 0.020 Cr% -
Chromium 0.90-1.50 1.03
Mo% -
Molybdenum 0.20-0.40 0.21
Remark:-Chemical Composition Conforms To BE 970 Gr.EN19 Specification as per above element analyzed.
2) FOR STAINLESS STEEL MATERIAL (ASTM E 1086 : 2014 / IS 9879 : 1998)
Scope & Application- This procedure provides for Optical Emission Spectrometer Analysis of Stainless Steel product base samples in solid form by the point to plane excitation technique for the following elements in the concentration ranges
Sample Description:- 276 mm Long x 0.20 mm Thick Standard Specification:- AISI 316L
CHEMICAL ANALYSIS:-
Test Method :- ASTM E 1086 : 2014 / IS 9879 : 1998
Table 2. Chemical Testing Of Stainless Steel Material
ELEMENTS STANDARD
VALUE
OBSERVED VALUE C% - Carbon 0.030 max. 0.024 Si%- Silicon 0.75 max. 0.70 Mn% -Manganese 2.00 max. 0.72 P% - Phosphorus 0.045 max. 0.034 S% - Sulphur 0.030 max. 0.016 Cr% - Chromium 16.00-18.00 17.75
Mo% -
Molybdenum 2.00-3.00 2.30
Ni% - Nickel 10.00-14.00 12.38
Remark:-Chemical Composition Conforms To AISI 316L Specification as per above element analyzed. 3) FOR ALUMINIUM & ITS ALLOY MATERIAL(ASTM E 1251 : 2011 / IS 11035:1984) Scope & Application- This procedure provides for Optical Emission Spectrometer Analysis of Aluminium and its alloy product base samples in solid form by the point to plane excitation technique for the following elements in the concentration ranges Sample Description- OD 32 mm ID 25.4 mm Extension Tube
Standard Specification:- IS 738 Gr.64430:1994 CHEMICAL ANALYSIS:-
Test Method :- ASTM E 1251 : 2011 / IS 11035:1984
Table 3. Chemical Testing Of Aluminium Material ELEMENTS STANDARD
VALUE
OBSERVED VALUE Cu% - Copper 0.10 max 0.084
Mg% -
Magnesium 0.40-1.20 0.67 Si%- Silicon 0.60-1.30 0.88 Fe%- Iron 0.60 max. 0.24
Mn%
-Manganese
0.40-1.00
0.44
Zn% - Zinc 0.10 max. 0.023
Ti% -
Titanium 0.20 max. 0.015
Cr% -
Chromium 0.25 max 0.032
Al% -
Remark:-Chemical Composition Conforms To IS 738 Gr.64430:1994 IS Specification as per above element analyzed.
4) FOR TOOL STEEL MATERIAL( JIS G 1253:2002 ) Scope & Application- This procedure provides for Optical Emission Spectrometer Analysis of Tool Steel & High Speed Tool Steel Products base samples in solid form by the point to plane excitation technique for the following elements in the concentration ranges
Sample Description- Φ 145 mm Cut Piece. Standard Specification:- AISI M 35
CHEMICAL ANALYSIS:- Test Method :- JIS G 1253:2002
Table 4. Chemical Testing Of Tool Steel Material ELEMENTS STANDARD
VALUE
OBSERVED VALUE C% - Carbon 0.87-0.95 0.92
Cr% -
Chromium 3.80-4.50 4.12
Mo% -
Molybdenum 4.70-5.20 5.01
V% -
Vanadium 1.70-2.10 1.87
W% -
Tungsten
5.90-6.70
6.07
Co% - Cobalt 4.50-5.00 4.78
Remark:-Chemical Composition Conforms To AISI M 35 Specification as per above element analyzed.
5) FOR COPPER & ITS ALLOY MATERIAL(BS EN 15079 : 2015)
Scope & Application- This procedure provides for Optical Emission Spectrometer Analysis of Copper and its alloy product base samples in solid form by the point to plane excitation technique for the following elements in the concentration ranges
Sample Description :- 59 mm x 0.05 mm Thk.Copper Coil
Standard Specification:- IS 3331 Grade Tin Bearing Copper : 2007 , Condition – EH
CHEMICAL ANALYSIS:-
Test Method :- BS EN 15079 : 2015
Table 5. Chemical Testing Of Copper Material ELEMENTS STANDARD
VALUE
OBSERVED VALUE Cu%- Copper 99.50 min. 99.84 Sn%- Tin 0.07-0.20 0.10
P%-
Phosphrous 0.015-0.045 0.025
Remark:-Chemical Composition Conforms To BS EN 15079 : 2015 Specification as per above element analyzed.
6) FOR NICKEL & ITS ALLOY MATERIAL(OES SPECTRO)
Scope & Application- This procedure provides for Optical Emission Spectrometer Analysis of Nickel & its Alloys product base samples in solid form by the point to plane excitation technique for the following elements in the concentration ranges
Sample Description:- Φ 2 mm Inconel 600 Welding Wire
Standard Specification:- ASTM B 564 Gr.UNS No. 6600 (Inconel 600)
CHEMICAL ANALYSIS:-
Test Method :- ASTM E 3047 : 2016
Table 6.Chemical Testing Of Nickel Material ELEMENTS STANDARD
VALUE
OBSERVED VALUE
C% - Carbon 0.15
max. 0.045
Si%- Silicon 0.50
max. 0.15
Mn%
-Manganese
1.00
max. 3.14
S% - Sulphur 0.015
max. 0.018
Cr% -
Chromium
14.00-17.00 20.60
Ni% - Nickel 72.00
min. 73.80
Cu% - Copper 0.50
max. 0.045
Fe% - Iron
6.00-10.00 0.39
Remark:-Chemical Composition does not Conforms To ASTM B 564 Gr.UNS No. 6600 (Incoonel 600) Specification as per above element analyzed
7) WET ANALYSIS (IS 228 Part I -IX (1987)) Sample Description:- Bur.
Standard Specification:- - CHEMICAL ANALYSIS:-
Table 7. Wet Analysis. ELEMENTS STANDARD
VALUE
OBSERVED VALUE
Cu% - Copper - 0.020
Mg% -
Magnesium - 0.40
Si%- Silicon - 0.45
Fe%- Iron - 0.18
Mn%
-Manganese - 0.22
Zn% - Zinc - 0.78
Ti% -
Titanium - 0.012
Cr% -
Chromium - 0.015
Al% -
Aluminium - Reminder
Remark:- ---
(*Note-If customer does not gives standard specification of material and material does not match any grade then and then ,we give remark as in -(dash),means there is no confirmation/match of any grade with respect to given material.)
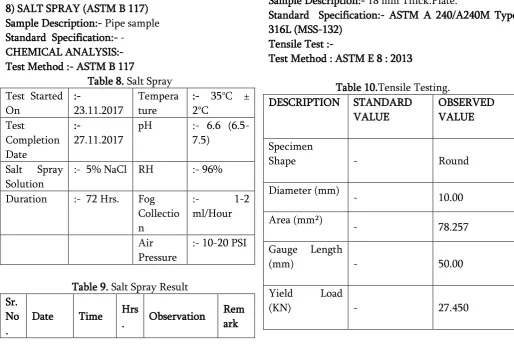
8) SALT SPRAY (ASTM B 117) Sample Description:- Pipe sample Standard Specification:- -
CHEMICAL ANALYSIS:- Test Method :- ASTM B 117
Table 8. Salt Spray Test Started
On
:-
23.11.2017
Tempera ture
:- 35°C ± 2°C
Test
Completion Date
:-
27.11.2017
pH :- 6.6 (6.5-7.5)
Salt Spray Solution
:- 5% NaCl RH :- 96%
Duration :- 72 Hrs. Fog Collectio n
:- 1-2 ml/Hour
Air Pressure
:- 10-20 PSI
Table 9. Salt Spray Result Sr.
No .
Date Time Hrs
. Observation
Rem ark
1 23.11.2 017
12.00
pm 0
No Rust Observed Ok
2 24.11.2 017
12.00
pm 24
No Rust Observed Ok
3 25.11.2 017
12.00
pm 48
No Rust Observed Ok
4 26.11.2 017
12.00
pm 72
No Rust Observed Ok
Observation:- No rust observed up to 72 Hrs.
B.PHYSICAL TESTING B.MECHANICAL TESTING 1.TENSILE TESTING PURPOSE
To define a method for tensile testing of bars/plates and to calculate Yield strength , Ultimate Tensile Strength, % Elongation, % Reduction in area of steel bars/plates.
SCOPE AND APPLICATION
The procedure details method to test sample of the required metal with Tensile testing machine, record the reading and the results as per the applicable test method.
Sample Description:- 18 mm Thick.Plate.
Standard Specification:- ASTM A 240/A240M Type 316L (MSS-132)
Tensile Test :-
Test Method : ASTM E 8 : 2013
Table 10.Tensile Testing. DESCRIPTION STANDARD
VALUE
OBSERVED VALUE
Specimen
Shape - Round
Diameter (mm)
- 10.00
Area (mm²)
- 78.257
Gauge Length
(mm) - 50.00
Yield Load
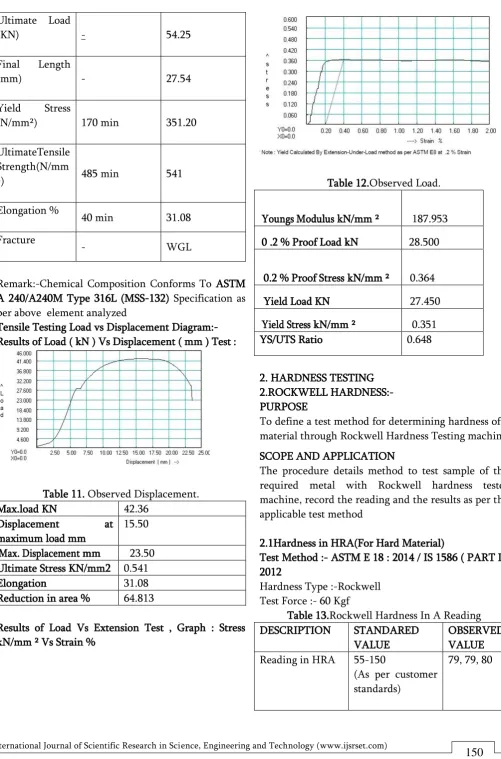
Ultimate Load
(KN) - 54.25
Final Length
(mm) - 27.54
Yield Stress
(N/mm²) 170 min 351.20
UltimateTensile Strength(N/mm
²) 485 min 541
Elongation %
40 min 31.08
Fracture
- WGL
Remark:-Chemical Composition Conforms To ASTM A 240/A240M Type 316L (MSS-132) Specification as per above element analyzed
Tensile Testing Load vs Displacement Diagram:- Results of Load ( kN ) Vs Displacement ( mm ) Test :
Table 11. Observed Displacement.
Max.load KN 42.36
Displacement at maximum load mm
15.50
Max. Displacement mm 23.50 Ultimate Stress KN/mm2 0.541
Elongation 31.08
Reduction in area % 64.813
Results of Load Vs Extension Test , Graph : Stress kN/mm ² Vs Strain %
Table 12.Observed Load.
Youngs Modulus kN/mm ² 187.953
0 .2 % Proof Load kN 28.500
0.2 % Proof Stress kN/mm ² 0.364
Yield Load KN 27.450
Yield Stress kN/mm ² 0.351
YS/UTS Ratio 0.648
2. HARDNESS TESTING 2.ROCKWELL HARDNESS:- PURPOSE
To define a test method for determining hardness of a material through Rockwell Hardness Testing machine
SCOPE AND APPLICATION
The procedure details method to test sample of the required metal with Rockwell hardness tester machine, record the reading and the results as per the applicable test method
2.1Hardness in HRA(For Hard Material)
Test Method :- ASTM E 18 : 2014 / IS 1586 ( PART I) : 2012
Hardness Type :-Rockwell Test Force :- 60 Kgf
Table 13.Rockwell Hardness In A Reading DESCRIPTION STANDARED
VALUE
OBSERVED VALUE Reading in HRA 55-150
(As per customer standards)
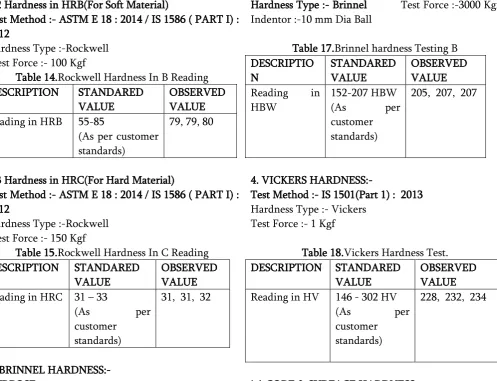
2.2 Hardness in HRB(For Soft Material)
Test Method :- ASTM E 18 : 2014 / IS 1586 ( PART I) : 2012
Hardness Type :-Rockwell Test Force :- 100 Kgf
Table 14.Rockwell Hardness In B Reading DESCRIPTION STANDARED
VALUE
OBSERVED VALUE Reading in HRB 55-85
(As per customer standards)
79, 79, 80
2.3 Hardness in HRC(For Hard Material)
Test Method :- ASTM E 18 : 2014 / IS 1586 ( PART I) : 2012
Hardness Type :-Rockwell Test Force :- 150 Kgf
Table 15.Rockwell Hardness In C Reading DESCRIPTION STANDARED
VALUE
OBSERVED VALUE Reading in HRC 31 – 33
(As per
customer standards)
31, 31, 32
3. BRINNEL HARDNESS:- PURPOSE
To define a test method for determining hardness of a material through Brinell Hardness Testing machine SCOPE AND APPLICATION
The procedure details method to test sample of the required metal with Optical brinell hardness tester machine, record the reading and the results as per the applicable test method
3.1 Test Method ASTM E 10 : 2014 / IS 1500 : 2013
Hardness Type :- Brinnel Test Force :- 750 Kgf Indentor :- 5 mm Dia Ball
Table 16.Brinnel hardness Testing.A. DESCRIPTION STANDARED
VALUE
OBSERVED VALUE Reading in
HBW
-
(As per
customer standards)
144, 146, 144.
3.2 Test Method ASTM E 10 : 2014 / IS 1500 : 2013
Hardness Type :- Brinnel Test Force :-3000 Kgf Indentor :-10 mm Dia Ball
Table 17.Brinnel hardness Testing B DESCRIPTIO
N
STANDARED VALUE
OBSERVED VALUE Reading in
HBW
152-207 HBW
(As per
customer standards)
205, 207, 207
4. VICKERS HARDNESS:-
Test Method :- IS 1501(Part 1) : 2013 Hardness Type :- Vickers
Test Force :- 1 Kgf
Table 18.Vickers Hardness Test. DESCRIPTION STANDARED
VALUE
OBSERVED VALUE Reading in HV 146 - 302 HV
(As per
customer standards)
228, 232, 234
iv) CORE & SURFACE HARDNESS:-
As per customer specification and requirement the hardness is carried out for core and surface of the material/Sample.
CORE HARDNESS IN HRB - 77, 78, 78 SURFACE HARDNESS IN HRC - 82, 83, 82
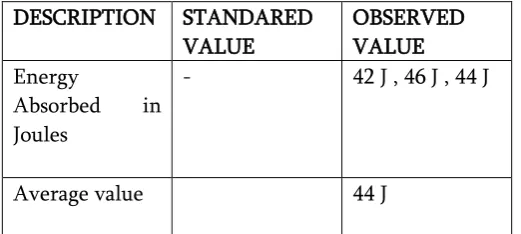
5. IMPACT TESTING PURPOSE
To define a test method for the resistance to failure of a material to a suddenly applied force
SCOPE AND APPLICATION
This procedure covers method of impact testing (Izod and Charpy), measures the impact energy, or the energy absorbed prior to fracture.
Test Method :- IS 1757 : 1988 Reaf. 2003
Type : Charpy , Notch : 'V' Notch , Temperture : 20°C
Size : 10 x 10 x 55 mm
DESCRIPTION STANDARED VALUE
OBSERVED VALUE Energy
Absorbed in Joules
- 42 J , 46 J , 44 J
Average value 44 J
6. BEND TESTING PURPOSE
To define a method of bend test and to reveal the crack defects in the sample test piece provided. SCOPE AND APPLICATION
The test is applicable for round, square, rectangular or polygonal test pieces of metallic products.
Test Method : IS 1599 : 1985 : Re 2006 Table 20.Bend Testing.
Width (mm) 25.00
Thickness (mm) 4.80
Bend Thickness
4.86
Former Dia
(1T)
Degree
5.00
Observation Satisfactory - Free From Cracks
7. PROOF LOAD TESTING Test method:-IS 1367 (Part 6):1994 PURPOSE
To define a method of proof load of nuts with specified proof load values.
SCOPE AND APPLICATION
The test is applicable to nuts & studs with nominal thread diameter’s up to and including 39 mm made of carbon steel or low alloy steel.
Size Of Nut :- ¾’’
Load Applied :- 118.40 KN
Load Specified :- 111.38 KN
Remarks :-Thread Not Damaged
8. LIQUID PENETRATION TESTING:- PURPOSE
To define a method of Liquid penetration test and to reveal the crack defects in the sample test piece provided.
SCOPE AND APPLICATION
The test is applicable for round, square, rectangular or polygonal test pieces of metallic And non-metallic products.
This procedure describes general requirement for liquid penetrant testing of welding nonporous, ferrous&non ferrous ,non-metallic materials such as glazed ceramic, some non porous plastics, Glass, etc using color contrast solvent removable dye penetrant test method. Typical surface discontinuities detectable by this method are welding cracks,seams,laps ,cold shuts ,porosity,lamination.
Table 21.LPI Test LIQUID PENETRANT TEST REPORT
Date – Report no- Clint - AMIN
PROPERTIES BANGALORE
Customer –
CHINIWALAS PRIVATE LIMITED Location- Pune Name of part –
M.S.Bracket
Stage of inspection - Final
Drawing no - NA
Acceptance standards – ASTM E-165 Cl.6 Part 6
Surface condition – cleaned
Job temperature - 35
Penetrant Batch no- 1605R1
Penetrant dwell time - 15 min
Developer Batch no - 1606D2
Developer dwell time - 10 min
Cleaner Batch no -1512C5
Job Details -
1 M.S.Bracket - 1 Nos.
Remark- All above mention material DP Done. Uniform Welding Run Observed , Weldind bead as per drawing , No Relevant indication Found . observed material Accepted.
9.POSITIVE MATERIAL IDENTIFICATION (PMI TESTING):-
PMI (Positive Material Identification) testing is the analysis of materials to determine the chemical composition of a metal or alloy at particular (usually multiple) steps of alloy manufacturing or in-process alloy installation.Knowing the exact composition and grade of an alloy enables suppliers, plant workers, and other responsible parties in the chain of custody of components to match alloy specifications that are chosen for their specific properties such as heat resistance, corrosion resistance, durability, etc. Having the right alloy in the right place is essential in places like petroleum refineries and chemical plants, because the right alloy with the right properties is often all that stands between a safe, efficient operation and lost time and revenue
SCOPE AND APPLICATION
This procedure prescribes the requirements for the positive material identification(PMI)for ferrous and non-ferrous material to verify that alloy materials are of acceptable chemical composition independent of any certificate and marking that may exist, and to assure that correct alloy materials are used at the places where intended.
Surface Preparation & Components
The surface of the component subjected to the test shall be free from grease,oil ,paint & oxides. The surface preparation shall be performed with a portable grinding machine or any other suitable equipment & the same should represent the original surface of the component.
Calibration of the testing instrument
Calibration of the instrument has been carried out by the manufacturer at their factory using various types & grades of the standard reference material (SRM) for various types of materials hence no recalibration is required to be performed
One of the example of the positive material identification is carried out in site of testing location (Eg. An Manufacturing Unit, An construction Unit, An Mine Material Testing Unit)
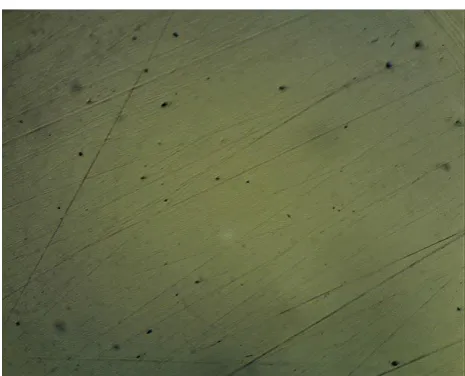
10.MICRO EXAMINATION:-
Test Method : IS 7754-1975, IS 4163:2004, IS 7739 (Part IV, V)- 2003, and ASM VOL.NO.09
Scope & Application: Evaluation of Microstructure, Phase Analysis of metallic Objects.
Sample Description : Part No.Z035936 , Part Name- Slack Adjustor , SG Iron
MICRO EXAMINATION:-
Magnification :-100 X Etchant - 3 % Nital
Magnification :-200 X Etchant - 3 % Nital
Result & Conclusion/Observations:-
Table 22. Etched condition /Unetched condition Dista nce (mm) 0. 1 0 0. 20 0. 3 0 0.4 0 0. 5 0 0 . 6 0 0. 70 0. 80 0. 90 1. 0 0 Hard ness In HV 1Kgf 3 7 5. 0 49 0. 70 4 5 3. 7 44 5.3 4 0 0. 3 3 9 8 . 3 36 9. 6 41 0. 9 33 4. 9 3 7 0. 7 Hard ness In HRC 3 8. 3 48 .4 4 5. 6 44. 9 4 0. 8 4 0 . 6 37 .7 41 .8 33 .8 3 7 . 8
Etched condition /Unetched condition :-
It shows predominantly ferrite matrix ASTM 6,8 with pearlite (dark regions) 10 % at grain
boundaries and graphite nodules.no carbides.
11.Grain Size Measurement:
Test Method : ASTM E 112 , ASTM A 247, IS 4748
Scope & Application: Measurement and Evalution of Average grain Size of metallic Materials.
Sample Description : : Φ76.2 x 88.9 x 100 mm Hone Tube.
Standard Specification :: ST 52
Magnification :- 100X
Test Method : ASTM E 112 : 2013 Observation - ASTM 5 - 7
12.CASE DEPTH TSET:
Test Method : IS 6416:1988 for Case Depth measurement,
ASTM E 384, ASTM E 92, ASTM E1077.
Scope & Application: Measurement of Case Depth by Micro Vickers / Knoop Hardness Tester.
Sample Description : :- Nut
Standard Specification ::- IS 513 Grade D : 2008 13.INCLUSION RATING:
Scope & Application :Evaluation of Inclusion Rating of different type of metallic material.
Test Method :IS 4163:2004, ASTM E 45 :2013.
Sample Description : Φ52.80 x Φ 63.50 x 100 mm Hone Tube.
Standard Specification :ST 52
Results & Conclusion:
Test Method : ASTM E 45 (Method A)
Table 23. Inclusion Rating
A B C D
2.0 / -- 1.5 / 1.0 1.0 / 0.5 2.0 / 1.5
Conclusion & result:- The results as per Scale A-D.
IV.CONCLUSION
From This we analyzed the different types of testing,Testing methods, testing technologies & Different Material Testing Machines & Different material & Different material Grades , & How actually material to be tested in laboratory is covered in this paper for various testing.
From this Paper we get information about how actually test is done for Different material testing for various material in laboratory actually.And This Is very useful for incoming future years.
IV.
REFERENCES[1].ASTM E 1476 Standard Guide for Metals Identification, Grade Verification, and Sorting [2].ASTM E 572 Standard Test Method for Analysis
of Stainless and Alloy Steels by X-ray Fluorescence Spectrometer.
[3].ASTM E 322 Standard Test Method for X-Ray Emission Spectrometric Analysis of Low- Alloy Steels and Cast Irons.
[4].IS Standard 8811 (1998) & ASTM E 415 :2017 Test method of emission spectrometric analysis of plain carbon & low alloys steels plain to plain technique.
[5].ASTM E 1086 :2014 ,IS- 9879 : 1998 & JIS 1253 : 2002 Test method of emission spectrometric analysis of Stainless Steels plain to plain technique.