Original Research Article
Assessment of nutritional status among geriatric population
in rural Mangaluru: a cross sectional study
Shrivathsa D. N.
1*, Chandana G. Manglik
1, Ranish Deelan Saldanha
2, Prajna P. Sharma
1INTRODUCTION
In January, 1999 Govt of India adopted National Policy on elder persons which defines senior citizens or elderly as a person who is of 60 years or above.1 The percentage of elderly is growing rapidly worldwide. The global number of elderly is projected to rise from an estimated 524 million in 2010 to nearly 1500 million in 2050, with most of this increase in developing countries.2 The lack of guaranteed sufficient income to support themselves,
absence of social security, loss of social status and recognition, unavailability of opportunities for creative use of time and persistent ill health are some problems faced by elderly in the country. Older adults are at a risk of malnutrition due to physiological, psychological, social, dietary and environmental factors.2 Malnutrition is defined as ‘a pathological state resulting from a relative or absolute deficiency or excess of one or more essential nutrients'. It comprises four forms: under nutrition, over nutrition, imbalance and specific deficiency.3
ABSTRACT
Background: The percentage of elderly is growing rapidly worldwide. They are at a risk of malnutrition due to physiological, psychological, social, dietary and environmental factors.The present study was conducted to find the malnourished elderly in the community. The aims and objectives of the study were to evaluate the nutritional status of elderly using Mini Nutritional Assessment (MNA) scales; to evaluate the dietary consumption in terms of total calories and protein intake; to assess the factors associated with the malnutrition; to educate regarding nutritional importance in elderly.
Methods: A community based cross-sectional study was conducted among the geriatric population (n=117) in rural Mangaluru using convenient sampling technique. After obtaining oral consent, mini nutritional assessment scale was used and socio-demography was collected. Total screening score of 14 and assessment score of 16 were summed up to get the total assessment score of 30 to determine the person’s nutritional status.
Results: Majority (60.6%) of the study population was females and 39.4% were males. 53% population were Muslims and 51% belonged to nuclear family. According to MNA scale, 54 (46.7%) were at risk of malnutrition, 17 (14.5%) were suffering from malnutrition and rest 46 (39.3%) had normal nutritional status. There was a significant correlation of MNA score with BMI.
Conclusions: The results suggest that MNA is a useful tool in the identification of elderly at risk of malnutrition. Due to the high prevalence of elderly who were malnourished or at the risk of malnutrition, a more detailed evaluation, regular follow up and dietary intervention is required.
Keywords: Geriatric, Nutritional status, MNA, Mangaluru
1
Department ofCommunity Medicine, Kanachur Institute of Medical Sciences, Natekal, Mangaluru, Karnataka, India
2
MBBS Student,Kanachur Institute of Medical Sciences, Natekal, Mangaluru, Karnataka, India
Received: 26 March 2019
Revised: 06 May 2019
Accepted: 13 May 2019
*Correspondence:
Dr. Shrivathsa D. N.,
E-mail: [email protected]
Copyright: © the author(s), publisher and licensee Medip Academy. This is an open-access article distributed under the terms of the Creative Commons Attribution Non-Commercial License, which permits unrestricted non-commercial use, distribution, and reproduction in any medium, provided the original work is properly cited.
Different studies have shown that more than 50% of elderly population of India are suffering from malnutrition and more than 90% have less than the recommended intake.1 Studies reported the following significant risk factors for malnutrition: age, general health decline including physical functions, Parkinson’s disease, constipation, poor or moderate self-reported health status, cognitive decline, dementia, eating dependencies, poor appetite, loss of interest in life, basal oral dysphagia, signs of impaired efficacy of swallowing and institutionalization.20
These risk factors for malnutrition in older adults may be considered by health care professionals when developing new integrated assessment instruments to identify older adult’s risk of malnutrition and to support the development of preventive and treatment strategies.20
Keeping all the above set facts in mind the present study was conducted to find the malnourished elderly in the community.
Aim and objectives
To evaluate the nutritional status of elderly using mini nutritional assessment (MNA) scale.
To evaluate the dietary consumption in terms of total calories and protein intake.
To assess the factors associated with the
malnutrition.
To educate regarding nutritional importance in elderly.
METHODS
A community based cross-sectional study was conducted among the geriatric population (n=117) in rural Mangaluru using convenient sampling technique. The period of study was from April 2018 to June 2018.
Inclusion criteria
Person of 60 years of age and above and permanent resident of the area was taken as study subject.
Exclusion criteria
Person who is not willing to participate in the study was excluded.
Data collection
Oral consent was taken and validated questionnaire was used to conduct the study. The variables studied cover the profile of house hold in terms of gender, house hold size, social groups, APL/BPL, house hold structure, per capita monthly income, key variable, being the nutritional status of geriatric age group.
Questionnaire mainly focused on Mini Nutritional Assessment.7
Total screening score of 14 and assessment score of 16 were summed up to get the total assessment score on 30 to determine the person’s nutritional status (whether malnourished / at risk of malnutrition / normal).
Data analysis
Data collected were entered in Microsoft Excel and data analysis was done using SPSS version 25 and presented using descriptive statistics, mean and standard deviation. Association between two attributes were seen using chi-square statistics. The results with p<0.05 was taken as statistically significant.
RESULTS
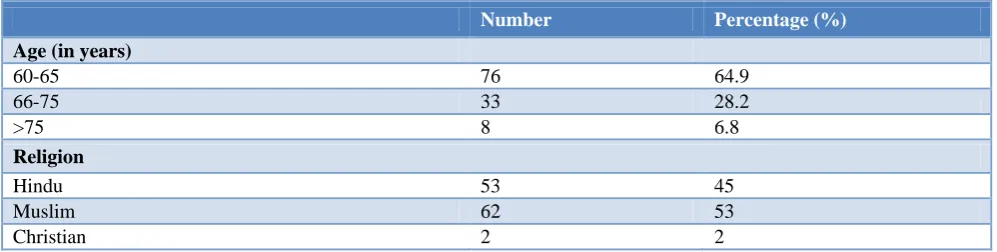
A total of 117 participants were included in the study. According to Table 1 which shows Socio-economic characteristics of the study participants, 64.9% were between 60-65 years of age, 28.2% were between 66-75 years of age and 6.8% were above 75 years of age. 53% population were Muslims and 51% belonged to nuclear family. Majority 60.7% of the study population were females and 39.3% were males 35% belonged to Class 3 SES.
According to Table 2, 68.4% people does not avail any schemes, 25.6% avail old age pension, and 4.3% people are having health insurance.
Table 1: Socio-economic characteristics of the study participants (n=117).
Number Percentage (%)
Age (in years)
60-65 76 64.9
66-75 33 28.2
>75 8 6.8
Religion
Hindu 53 45
Muslim 62 53
Number Percentage (%)
Occupation
Unemployed 32 27.3
Unskilled 5 4.3
Semiskilled 59 50.4
Skilled 15 12.8
Shop owners 3 2.6
Semi profession 1 0.9
Profession 2 1.7
Gender
Male 46 39.3
Female 71 60.7
Type of card holders
APL 39 33.3
BPL 78 66.7
Type of family
Nuclear 60 51
Three generation 1 1
Joint 56 48
Socio-economic status
Class I 9 7.6
Class II 36 30.3
Class III 41 35
Class IV 25 21.3
Class V 6 5.12
Table 2: Various social schemes availed (n=117).
Schemes Number Percentage (%)
No Schemes availed 80 68.4
Widow Pension 2 1.7
Old age pension 30 25.6
Health Insurance 5 4.3
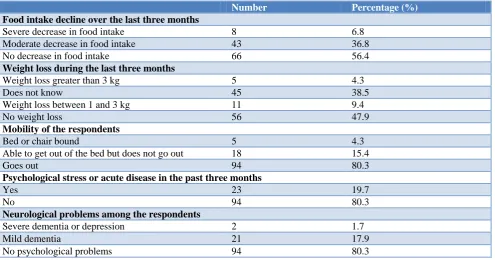
Table 3: Questions of mini nutritional assessment (n=117).
Number Percentage (%)
Food intake decline over the last three months
Severe decrease in food intake 8 6.8
Moderate decrease in food intake 43 36.8
No decrease in food intake 66 56.4
Weight loss during the last three months
Weight loss greater than 3 kg 5 4.3
Does not know 45 38.5
Weight loss between 1 and 3 kg 11 9.4
No weight loss 56 47.9
Mobility of the respondents
Bed or chair bound 5 4.3
Able to get out of the bed but does not go out 18 15.4
Goes out 94 80.3
Psychological stress or acute disease in the past three months
Yes 23 19.7
No 94 80.3
Neurological problems among the respondents
Severe dementia or depression 2 1.7
Mild dementia 21 17.9
Number Percentage (%)
Body mass index (BMI)
BMI less than 19 24 20.5
BMI 19 to less than 21 18 15.4
BMI 21 to less than 23 55 47.0
BMI 23 or greater 20 17.1
Lives independently (not in nursing home or hospital)
Yes 7 6.0
No 110 94.0
Takes more than three prescription drugs per day
Yes 44 37.6
No 73 62.4
Pressure sores or skin ulcers
Yes 14 12.0
No 103 88.0
Number of meals eaten by the respondent daily
1 meal 1 0.9
2 meals 20 17.1
3 meals 96 82.1
Consumption markers of protein intake
a) At least one serving of dairy products per day b) Two or more servings of legumes or eggs per week c) Meat, fish or poultry everyday
If the respondents consume none or any one among the
above 34 29.1
If they consume any two of the above 61 52.1
If they consume all of the above 22 18.8
Consumes two or more servings of fruits or vegetables per day
No 46 39.3
Yes 71 60.7
Fluid consumption per day
Less than three cups 6 5.1
Three to five cups 39 33.3
More than five cups 72 61.5
Mode of feeding
Unable to eat without assistance 8 6.8
Self-fed with some difficulty 7 6.0
Self-fed without any problem 102 87.2
Self-view of nutritional status
Views self as malnourished 19 16.2
Is uncertain of nutritional status 45 38.5
Views self as having no nutritional problem 53 45.3
In comparison with other people of the same age how does the respondent consider his/her own health?
Not as good 16 13.7
Does not know 38 32.5
As good 46 39.3
Better 17 14.5
Mid-arm circumference (MAC)
MAC less than 21 cm 19 16.2
MAC 21 to 22 cm 25 21.4
MAC greater than 22 cm 73 62.4
Calf circumference (CC)
CC less than 31 cm 63 53.8
Table 4: Malnutrition screening score (n=117).
Malnutrition screening score Number Percentage (%)
Normal nutritional status 46 39.3
At risk of malnutrition 54 46.2
Malnourished 17 14.5
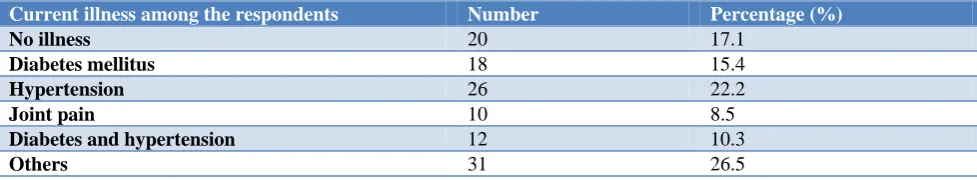
Table 5: Current illness among the respondents (n=117).
Current illness among the respondents Number Percentage (%)
No illness 20 17.1
Diabetes mellitus 18 15.4
Hypertension 26 22.2
Joint pain 10 8.5
Diabetes and hypertension 12 10.3
Others 31 26.5
According to the Table 3 and 4, MNA scale, 54 (46.7%) were at risk of malnutrition, 17 (14.5%) were suffering from malnutrition and rest 46 39.3%) had normal nutritional status.
The malnutrition screening score of elderly assessed in relation to their BMI as tabulated in Table 3 and MNA score in Table 4 depicts that with BMI less than 19 were at risk of malnutrition and is statistically significant (χ²=9.8655, p<0.00016). There was a significant correlation of MNA score with BMI.
According to this Table 5, 22.2% are hypertensive 15.4% are diabetic,10.3% are diabetic as well as hypertensive and 17.1% people does not have any illness.
DISCUSSION
In our study done according MNA classification, it was seen that out of 117 participants 54 (46.7%) were at risk of malnutrition, 17 (14.5%) were suffering from malnutrition and rest 46 (39.3%) had normal nutrition status. Our results revealed more elderly to be at risk of malnutrition than actually malnourished. This finding has been seen among the community dwelling elderly from India and other parts of world.1,2,7,12
In study done by Anantesh et al, 2017 prevalence of malnutrition was found to be 18.6%, 42.6% were well nourished and 38.7% were at risk of malnutrition.1
In the study done by Vedantam, et al out of 227 elderly subject 14% were malnourished and 49% at risk of malnourishment.12
There was significant correlation of MNA score with BMI as 47% of subjects had 23 or greater and 17.1% had BMI less than 19, 20.5% had BMI ranging between 19 to 21, 15.4% had BMI ranging between 21 to 23. In a study by Gandhi et al, in Rajasthan, 63.2% subjects were having BMI 23 or greater, 28.3% were having BMI
ranging from 21 to 23, 7.2% were having BMI ranging from 19 to 21 and 13% were having BMI less than 19 according to MNA scale.2
Our analysis showed that lower MNA score were associated with those subjects who take less than 3 meals per day. A similar study showed that the elderly who were malnourished or at the risk of malnourishment consumed only two meals per day.12
CONCLUSION
In our study, out of total study participants, 54 (46.7%) were at the risk of malnutrition and 17 (14.5%) were malnourished as per MNA score. The results suggest that MNA is a useful tool in the identification of elderly at risk of malnutrition. Due to the high prevalence of elderly who were malnourished or at the risk of malnutrition, a more detailed evaluation, regular follow up and dietary intervention to reverse the situation is required. Research efforts and nutrition education strategies should be directed towards health of the elderly to develop nutritional guidelines promoting successful aging.
Recommendations
There is a pressing need to identify early those at risk and to develop targeted nutrition intervention programmes for prevention of the effects of untreated malnutrition that can lead to morbidity and to ensure healthy ageing.
Limitations
Convenient sampling was used.
ACKNOWLEDGEMENTS
Funding: No funding sources Conflict of interest: None declared Ethical approval: Not required
REFERENCES
1. Ananthesh BG, Bathija GV, Bant DD. A community
based cross-sectional study to asses malnutrition among elderly population residing in urban and rural areas of a district in Karnataka, India. Int J Community Med Public Health. 2017;4:51-8.
2. Shreyashkumar J. Gandhi, Choudary MK, Kumar R,
Bhatnagar D. Nutritional status of the geriatric population in the field practice area of a medical college in Rajasthan. Int J Community Med Public Health. 2018;5:220-4.
3. Park K, Park’s textbook of preventive and social medicine 24th ed. Jabalpur; Banarsidas Bhanot Publishers; 2017: 680.
4. Kavya C, Santosh A. Geriatric health: assessment of nutritional status and functional ability of elderly living in rural area of Bangalore Karnataka, India. Int J Community Med Public Health. 2016;3:3460-4.
5. Volkert D, Saeglitz C, Gueldenzoph H, Sieber CC, Stehle P. Undiagnosed malnutrition and nutrition-related problems in geriatric patients. J Nutr Health Aging. 2010;14(5):387-92.
6. Margareta D. Persson, Kerstin E. Brismar, et al.
Nutritional Status Using Mini Nutritional
Assessment and Subjective Global Assessment Predict Mortality in Geriatric Patients. Am Geriatr Society. 2002;50(12):1996-200.
7. Pai MK. Comparative study of nutritional status of elderly population living in the home for aged vs those living in the community. Biomed Res. 2011;22(1):120-6.
8. Gazzotti C, Albert A, Pepinster A, Petermans J. Clinical usefulness of the mini nutritional assessment (mna) scale in geriatric medicine. J Nutr Health Aging. 2000;4(3):176-81.
9. Arlappa N, Balakrishna N, Kokku SB, Harikumar R, Rao KM, Ravindranath M. Diet and nutritional status of the older adults in rural India. J Ageing Res Healthcare. 2016;1(1):44-57.
10. Garg KG, Sharma M, Kaundal R. A review on geriatrics - common problems of old age poeple and
their management. Int Ayurvedic Med J. 2015;3(1) :165-175.
11. Tripathi KM, Singh Y, Dubey SK, Sevan T.
Geriatric Nutrition: Need for Better Ageing; South Asian J Food Technol Environ. 2016;2(3&4):432-7. 12. Vedantam A, Subramanian V, Rao NV, John KR.
Malnutrition in free-living elderly in rural south India: prevalence and risk factors. Public Health Nutr. 2009;13(9):1328–32.
13. Morley JE. Symposium on ‘Nutrition and the
elderly Protein-energy malnutrition in older subject. Proceedings Nutr Society. 1998;57:587-92.
14. Singh DR, Shrestha S. Nutritional status of senior citizens living in old age homes of Kathmandu metropolitan municipality. Int J Community Med Public Health. 2016;3:1707-15.
15. Donini LM, Savina C, Rosano A, Cannella C. Systemtic review of nutritional status evaluation and screening tools in the elderly. J Nutr Health Aging. 2007;11(5):421-32.
16. Abd Aziz NAS, Teng NIMF, Abdul Hamid MR,
Ismail NH. Assessing the nutritional status of
hospitalized elderly. Clin Interv Aging.
2017;12:1615-25.
17. Oliveira MRM. Nutritional status and functional capacity of hospitalized elderly. Nutrition. 2009;8:54.
18. Virtuoso-Júnior JS, Tribess S, Romo-Perez V, Oliveira-Guerra R. Factors associated to risk of malnutrition amongst elderly women in low-income communities; Colomb Med. 2012;43:54-62.
19. Fontes D, Generoso Sde V, Toulson Davisson
Correia MI. Subjective global assessment: A reliable nutritional assessment tool to predict outcomes in critically ill patients, Clin Nutr. 2014;33(2):291-5.
20. Fávaro-Moreira NC, Krausch-Hofmann S, Matthys C, Vereecken C, Vanhauwaert E, Declercq A, et al., Risk factors for malnutrition in older adults: A systemic review of the Literature Based on Longitudinal Data. Adv Nutr. 2016;7(3):507-22.