R E S E A R C H A R T I C L E
Open Access
Reliability and diagnostic validity of a joint
vibration analysis device
Sonia Sharma, Heidi C. Crow, Krishnan Kartha, W. D. McCall Jr.
*and Yoly M. Gonzalez
Abstract
Background:This observational study was designed to evaluate the reliability and diagnostic validity of Joint Vibration Analysis (JVA) in subjects with bilateral disc displacement with reduction and in subjects with bilateral normal disc position.
Methods:The reliability of selecting the traces was assessed by reading the same traces at an interval of 30 days. The reliability of the vibrations provided by the subjects was assessed by obtaining two tracings from each individual at an interval of 30 min. The validity compared the Joint Vibration Analysis parameters against magnetic resonance imaging as the reference standard. The data were analyzed with exploratory factor analysis.
Results:The short- term reliability of the Joint Vibration Analysis outcome variables showed excellent results. Implementing factor analysis and a receiver operating characteristic as analytical methods showed that six items of the Joint Vibration Analysis outcome variables could be scaled and normalized to a composite score which presented acceptable levels of sensitivity and specificity with a receiver operating characteristic of 0.8. Conclusion:This study demonstrated that the composite score generated from the Joint Vibration Analysis variables could discriminate between subjects with bilateral normal versus bilateral displaced discs.
Keywords:Joint vibration, Temporomandibular disorders, Reliability, Diagnostic validity, Factor analysis
Background
Temporomandibular disorders (TMD) encompass a group of musculoskeletal and neuromuscular conditions that involve the TMJ, the masticatory muscles and all associated tissues; the major symptoms are pain which is often localized in the muscles of mastication or pre-auricular area; joint noises, and limitation in jaw func-tion may be present as addifunc-tional complaints [1]. Based on the current Diagnostic Criteria, TMD can be classi-fied into three major groups: pain-related; intra-articular; and degenerative joint disease and subluxation disorders [2]. Within the intra-articular group, disc dis-placement with reduction defines a subgroup in which diagnosis has often been based on clinical finding of joint sounds [3]. Several studies have concluded that TMJ sounds are highly variable [3–5]. Thus, the use of joint sounds as a diagnostic parameter has been ques-tioned [6]. The reliability among calibrated examiners of
such sounds has been reported to have a Kappa value of 0.63 [7]. The correct identification of intra-articular conditions using joint sounds has shown a sensitivity of 0.38 and specificity of 0.88, using the Magnetic Resonance Imaging (MRI) as the reference standard [8, 9].
Joint vibration analysis is based on principles of mo-tion and fricmo-tion by surfaces, which can be captured by accelerometers. Human joints in proper biomechanical relationship, in theory, should produce little friction and little vibration [10–14]; surface changes within the joint could cause greater friction and greater vibration. It has been postulated that different disorders can produce dif-ferent vibration patterns or signatures in joint including the TMJs [15–17]. Vibration analysis of the TMJ is thus a quantitative process that measures the absolute inten-sity and frequency distribution of vibratory waves eman-ating from the joint during jaw motion.
Since there is controversy regarding the utilization of joint vibrations to characterize joint status and conse-quently diagnosis as presented in a recent systematic re-view [18], the diagnostic validity of such instrumentation * Correspondence:[email protected]
Department of Oral Diagnostic Sciences, School of Dental Medicine, University at Buffalo, Buffalo, NY 14214, USA
used to measure and characterize this phenomenon must be tested using research designs with strong foun-dations including reliability evidence, blinded examiners, an acceptable reference standard such as MRI, and ac-ceptable psychometric properties.
Furthermore the progression of joint status in partici-pants with displaced discs has been controversial. While one report postulates a progression from disc displace-ment to osteoarthritis [19] there is substantial clinical evidence that most untreated patients improve and do not progress over time [20–25]. In addition there is MRI evidence that no change occurs in disc displacement over 22–80 months [26]. More recently the authors of a pro-spective study that assessed the stability of the temporo-mandibular joint in disc displacement using MRIs, found that over 8 years of follow-up, 76% of the 789 baseline joint-specific soft-tissue diagnoses did not change [27].
A systematic review [18] reported several limitations in previous reports: (1) lack of blinndness, (2) nonvali-dated classification systems, (3) different imaging tech-niques to identify control and test groups, (4) use of joint sounds per se as evidence of pathology or as a ref-erence standard, and (5) use of joint vibration analysis (JVA) as the reference standard even though it was the device investigated.
The premise of this research was that a more technic-ally accurate instrument and more sophisticated analysis by using factor analysis to select variables might provide more accurate information, compared to auscultation, and more inexpensive, compared to MRI, to assess the phenomenon of joint sounds. Therefore the assessment of vibrations using instrumentation such as Joint Vibra-tion Analysis (JVA) could have the potential to provide data that could be used to assess the phenomenon and to indicate the status of the joint. We focused on the BioJVA produced by BioResearch Associates.
The objectives of this research were, first, to determine if the data associated with joint vibrations could be se-lected and recorded reliably, second, to analyze the mul-tiple correlated variables with factor analysis to determine if a smaller number of variables could represent the data, and third, to determine if the sensitivity and specifi-city as represented by the area under the receiver op-erating characteristic curve were sufficiently large for potential clinical use.
The overall goal of this research was to test the diag-nostic validity of the joint vibration output variables against the reference standard of the MRI evaluation by a calibrated radiologist. The underlying analytical strat-egy was to examine the data with exploratory factor ana-lysis to see (1) how many latent variables, that is, factors, were in the data, (2) whether these latent factors could be interpreted in a reasonable way, and (3) whether a composite score based on the items that survived into
the interpretation could be merged into a composite score with adequate sensitivity and specificity as de-scribed by a receiver operating characteristic [28, 29].
Methods
Subjects
Thirty-six subjects who had undergone an MRI for their TMJs within the last two years agreed to participate in the study. Characterization of bilateral disc displacement or bilateral normal disc position was provided by a cali-brated radiologist [8] based on MRI interpretation. The study was approved by the University at Buffalo’s Health Sciences Institutional Review Board and each subject gave informed consent.
Equipment
The joint vibration analysis (JVA) in the BioPAK© sys-tem [30] was leased from Bioresearch Corporation and consisted of a headset encompassing accelerometers on each side, an amplifier, and software for a computer. The signals from the accelerometers were amplified by the small amplifier, which was placed around the subjects’ neck. The amplified signals were transmitted to a PC computer where they were recorded and later analyzed with the software program. Each accelerometer consists of a metal case containing a piezoelectric crystal that has a mass resting on it. This crystal reacts to acceleration by producing a minute electric charge due to compres-sion produced by the mass, which is directly propor-tional to the acceleration. This is then put into an amplifier of high input impedance prior to being re-corded as a vibration signal.
JVA protocol
The subjects sat in an upright position. Their maximum unassisted opening and lateral deflections were recorded clinically and entered into the computer with the Bio-PAK software program. The headset device was then placed on the subject’s head with the sensors positioned over the TMJs; the subjects were instructed to watch the monitor where they observed an animation illustrating opening and closing mouth movement, synchronized to a metronome. They were then instructed to open their mouth as wide as they could and close, tapping their teeth together following and matching the animation and the metronome, which they observed on the screen. As the subject performed the opening and closing with the JVA the characteristic vibrations produced by the condyles were detected by the accelerometers and re-corded in the computer.
recorded. The interval between the two sets of trac-ings was about 30 min.
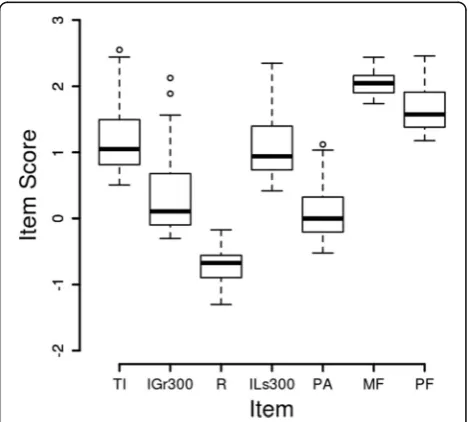
The variables [4, 30, 32] obtained were: Total Integral I (T), representing a measure of the total amount of en-ergy in the vibration; Integral <300 Hz which is the amount of energy in the vibration that is below 300 Hz; Integral >300 Hz which is the amount of energy in the vibration that is above 300 Hz; >300/<300 Ratio which is the ratio of the high-frequency to low-frequency energy; Peak Amplitude which indicates the highest intensity of the vibration; Peak Frequency which is the frequency at which the highest intensity of the vibration occurred and Median Frequency which is the frequency such that half of the energy is below it and half is above it. These data are provided in an Additional file 1.
Reliability
Reliability was assessed in three ways. First, the reliability of the examiners for range of motion data between the two clinical examiners was assessed by computing the intraclass correlation coefficient while lateral deviation was assessed with kappa. Second, the ability of two clini-cians as a consensus to select the same traces after a three-month interval was assessed by comparing the JVA variables from those two sets of traces. Third, a test-retest protocol assessed the ability of the subjects to provide consistent data by comparing data obtained at a 30-min interval. The examiners were calibrated for Re-search Diagnostic Criteria for TMD [33].
Reliability of range of motion assessment
The two clinical examiners in this study were blinded to the MRI diagnosis avoiding bias to the instrumentation under evaluation; examiners were RDC/TMD calibrated [31] and provided the clinical parameters such as range of motion and deflection, which were required by the Bio-PAK software program to analyze the joint vibrations.
Reliability of trace selection
The selection of vibration data was done as a consensus by the two clinical examiners following the manufac-turer’s protocol, which included the selection of the five largest vibration amplitudes in a trace of six to eight open-close cycles. To determine if the examiners could reliably select the JVA traces with the largest time-based signals, 15 traces were randomly selected and the traces were read at two times 3 months apart.
The recorded JVA traces were then analyed for the lar-gest vibration amplitude that consistently occurred in each joint recording from the JVA sweep. Five large vi-bration amplitudes were selected from each trace by both examiners and were used to calculate frequency spectrum computed by the Fast Fourier Transform
algorithm. These spectra were used for this estimation of reliability.
Test-retest reliability
Data from the first recordings from the subject were compared with the recordings made 30 min later.
Factor analysis
The number of latent variables underlying the data was investigated by exploratory factor analysis. The (log) data for each item was scaled by subtracting its mean and dividing by its standard deviation to form a z-score. The mean across the six items was taken as a composite score for each subject and a receiver operating curve was generated.
Factor analysis seeks to condense a larger number of correlated variables into a smaller number of underlying, interpretable variables which explain the bulk of the re-lationships among the original variables. Graphical in-spection of the raw data suggested that they were strongly non-Gaussian so the logarithm to the base 10 was taken of each data point. The box plot based on these logarithms suggested a better distribution for each variable (Fig. 1) and Shapiro-Wilks tests of each item within each group supported this. Due to doubts about the independence of data from the right and left joints [34], only the data from the right side were analyzed. Statistical Analysis
Reliability of dichotomous variables was assessed by percent agreement and Kappa values. Reliability of con-tinuous variables was assessed by intraclass correlation coefficients. Validity was assessed by calculating the Re-ceiver Operating Characteristic (ROC) using the com-posite score identified with the factor analysis.
The data were analysed using the R statistical and graphics package [35].
Results
Demographics
A total of 36 subjects (21 females, 15 males) participated in this study. The mean age was 39.03 ± 13.6 years. There were no statistically significant differences in age by gender. Twenty-one subjects (11 males and 10 females) had normal bilateral joints and 15 subjects (4 males and 11 females) had bilateral joints with disc displacement with reduction.
Reliability of range of motion assessment
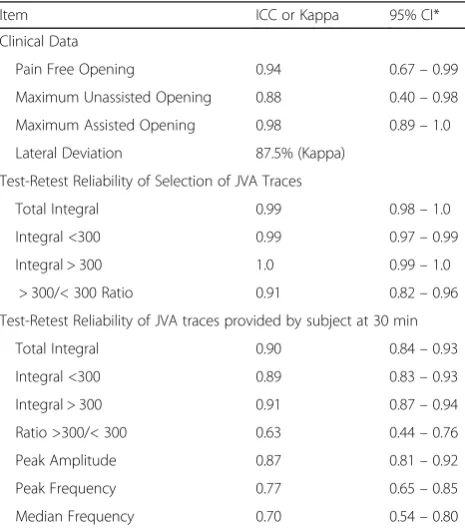
The ability of the two clinicians to obtain reliable clinical data led to excellent intraclass correlation coefficients (ICC) as shown in Table 1.
The ICCs from traces selected at the three months interval by consensus of the two clinical examiners also showed excellent values (Table 1). These data suggest that the examiners reliably identified the joint vibrations in the traces three months apart and therefore the re-sults obtained at the validity stage would not be
biased by the ability of the examiners to identify the phenomenon using the instrumentation.
Reliability of joint vibrations by test-retest
The reliability of the joint vibrations as a phenomenon was evaluated over a period of 30 min. The ICCs for the JVA variables showed excellent values except for the Ratio >300/<300 item (Table 1). Based on the excellent reliability results, the mean between trace 1 and trace 2 was taken as the outcome variable for further analysis.
Factor analysis
Graphical inspection of the raw data suggested that they were strongly non-Gaussian so the logarithm to the base 10 was taken of each data point. The box plot based on these logarithms suggested a better distribution for each variable (Fig. 1) and Shapiro-Wilks tests of each item within each group supported this. Due to doubts about the independence of data from the right and left joints, only the data from the right side were analysed.
The Cronbach's Alpha was 0.90 with 95% confidence limits from 0.82 to 0.98. The Kaiser-Meyer-Olkin meas-ure of sampling adequacy was 0.74 for the overall data set and the minimum item was 0.42 for the“Ratio”item. The next lowest measure of sampling adequacy (MSA) was 0.71 for the “Median Frequency” item. Notice (Table 2) that for the ratio the loading is low and the communality is low. For these reasons (supported by the low reliability in Table 1), the ratio was deleted from the subsequent analysis.
A scree plot (not shown) suggested that one or two factors might be allowed. Two factors led to several cross-loadings in the pattern matrix coefficients, some communalities greater than one, and no interpretation, so one factor was used.
The pattern loadings, communalities, means, and standard deviations for each item are shown in Table 2. A box plot of all seven items is shown in Fig. 1.
Each of the six items that were kept was scaled to a mean of zero and a standard deviation of one, a z-score (Fig. 2). The mean across the six scaled items was taken as a composite score for each subject. A plot (Fig. 3) of Table 1Reliability estimates
Item ICC or Kappa 95% CI*
Clinical Data
Pain Free Opening 0.94 0.67–0.99
Maximum Unassisted Opening 0.88 0.40–0.98
Maximum Assisted Opening 0.98 0.89–1.0
Lateral Deviation 87.5% (Kappa)
Test-Retest Reliability of Selection of JVA Traces
Total Integral 0.99 0.98–1.0
Integral <300 0.99 0.97–0.99
Integral > 300 1.0 0.99–1.0
> 300/< 300 Ratio 0.91 0.82–0.96
Test-Retest Reliability of JVA traces provided by subject at 30 min
Total Integral 0.90 0.84–0.93
Integral <300 0.89 0.83–0.93
Integral > 300 0.91 0.87–0.94
Ratio >300/< 300 0.63 0.44–0.76
Peak Amplitude 0.87 0.81–0.92
Peak Frequency 0.77 0.65–0.85
Median Frequency 0.70 0.54–0.80
*None of the confidence intervals include zero so all p’s are less than 0.05
Table 2Data from exploratory factor analysis
Item Pattern loadings Communality Mean Std Dev
Total Integral 0.97 0.94 1.231 0.534
Integral > 300 0.98 0.97 0.393 0.596
Ratio 0.49 0.24 −0.752 0.260
Integral <300 0.95 0.90 1.152 0.526
Peak Amplitude 0.87 0.76 0.167 0.462
Median Freq. Frequency
0.73 0.53 2.021 0.176
the composite score for each subject in the disc displace-ment and normal groups suggested the scores differed.
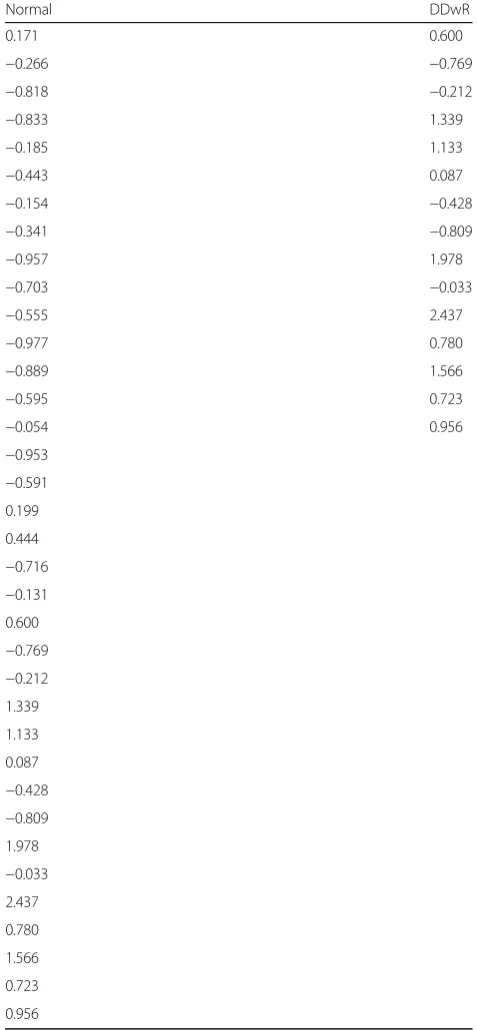
The composite scores from the subjects in the two groups (Table 3) were used to generate a receiver operat-ing curve where the scores from the subjects with bilat-eral disc displacement was used for the sensitivity and the scores from the subjects with bilateral normal discs were used for the specificity (Fig. 4). The area under the
receiver operating characteristic curve was 0.82. A com-posite score of −0.04 led to a sensitivity of 0.86 and a specificity of 0.73, this score is the closest to the ideal score of 1.0 for sensitivity and 1.0 for specificity. A com-posite score of −0.24 led to a sensitivity of 0.67 and a specificity of 0.80, this score is the closest to the sensitiv-ity of 0.70 and specificsensitiv-ity of 0.95 suggested by Dworkin and LeResche ([31], pp. 318–319).
Fig. 2Box Plot of Scaled JVA Data. In order to form a composite variable the data for each item were normalized by subtracting the mean and dividing by the standard deviation
Fig. 3Composite Scores. The filled circles are composite scores of the subjects with bilateral disc displacements and the open circles are the composite scores of the subjects with bilateral normal discs
Table 3Composite scores of all participants by group
Normal DDwR
0.171 0.600
−0.266 −0.769
−0.818 −0.212
−0.833 1.339
−0.185 1.133
−0.443 0.087
−0.154 −0.428
−0.341 −0.809
−0.957 1.978
−0.703 −0.033
−0.555 2.437
−0.977 0.780
−0.889 1.566
−0.595 0.723
−0.054 0.956
−0.953
−0.591 0.199
0.444
−0.716
−0.131 0.600
−0.769
−0.212 1.339
1.133
0.087
−0.428
−0.809 1.978
−0.033 2.437
0.780
1.566
0.723
Discussion
The main findings of this research were that clinicians can reliably identify the tracings generated by the JVA instrumentation, that the vibration generated by the TMJs are reliable within a 30 min time period, that the data have good psychometric properties, and that ex-ploratory factor analysis led to a composite score which had a good receiver operating characteristic.
The strengths of this research include clinical diagnostic criteria with trained and calibrated examiners, MRI TMJ soft tissue characterization by a calibrated radiologist who was blinded assessment of the data, and the use of explora-tory factor analysis to assess the properties of the data and to retain relevant items from the vibration instrumentation. We recognize that there are limitations associated with this investigation. First, this sample only included indi-viduals with either bilateral disc displacements with re-duction or bilateral normal position of the disc. This design made the results easier to interpret since there are reports that the vibration from the TMJ on one side might be detected on the other side [34, 36–38]. Clearly, unilateral disc displacement subjects need to be studied in the future, as well individuals with other intra-articular conditions in order to have a better representa-tion of the TMD popularepresenta-tion.
Second, the imaging data and the vibration data were not concurrent. While some reports postulate a model of progression from disc displacement to osteoarthritis there are four lines of evidence that argue against the progression model. First, a large, recent, cross-sectional
study failed to find evidence in favor of progression [26]. Second, several longitudinal clinical studies failed to find evidence of progression [20–25]. Third, a study with pre and post MRI imaging failed to find evidence of progres-sion [26]. And fourth, a prospective 8 year follow-up study found that 76% of the joint diagnoses were stable [27] Therefore, although it would be preferable to have a fully parallel data set for the imaging and vibration as-sessment, there is no evidence that the current design jeopardized the results.
Our reliability results confirmed recent results [39], extended the short-term reliability from 3 min to 30 min, and extended the study population from healthy participants to a group of individuals with bilateral disc displacement with reduction.
While we believe that our approach is innovative, we want to clearly express that in its current format the ap-proach is not ready for clinical diagnostic application. Fu-ture research could lead to the potential utility for characterization of disc position of the TMJs and to better understand the potential role of such vibrations in the intracapsular TMJ status and its impact in jaw function.
Conclusions
The excellent reliability obtained by the examiners reading the JVA data demonstrates that examiners can be properly trained and they can reliably identify and interpret the pertinent data produced by this technological device. In addition, the assessment of the joint vibration as phenom-ena can be reliably assessed within a short period of time.
Using a six-item composite score a receiver operating curve was generated (value of 0.82) suggesting that this composite score based on the vibration characterization can be used to discriminate between normal disc pos-ition and displaced disc pospos-ition.
Nevertheless, the authors would like to emphasize that the results must be interpreted with caution due to the fact that the composite score is not generated by the in-strumentation software, the independence of signals from each TMJ is not yet established, and because the study sample does not represent the entire spectrum of disc displacements and degenerative joint disease.
Additional file
Additional file 1:An additional file named“JVAdata.csv”contains the MRI-based group and the JVA-based data. (CSV 1 kb)
Abbreviations
ICC:Intraclass correlation coefficient; JVA: Joint vibration analysis; MRI: Vmagnetic resonance imaging; TMD: Temporomandibular disorders; TMJ: Temporomandibular joint
Acknowledgements Not applicable.
Funding
This Research was in part supported by NIH grant# 5R01DE016417, which had no role in any part of this project.
Availability of data and materials
A file containing the joint vibration data is attached.
Authors’contributions
SS contributed to data collection, statistics, and development and editing of the manuscript. HCC contributed to conception and design, supervision of data gathering, interpretation of results, and editing of the manuscript. KK interpreted the MRI data. WDM contributed to performing and interpreting statistics, and to editing the manuscript.YMG was responsible for the study design, development of the research infrastructure, and direct supervision of the data gathering by the first author. Also, she was directly involved in the data analysis, and contributed to the development and editing of the manuscript. All authors read and approved the final manuscript.
Competing interests
The authors declare that they have no competing interests.
Consent for publication Not applicable.
Ethics approval and consent to participate
The study was approved by the University at Buffalo’s Health Sciences Institutional Review Board (SIS0050203A) and each subject gave informed consent.
Received: 3 August 2016 Accepted: 9 February 2017
References
1. de Leeuw R, Klasser GD. Guidelines for assessment, diagnosis, and management. In: Temporomandibular disorders. Fifthth ed. Hanover Park: Quintessence Publishing Co; 2013. p. 129–204.
2. Schiffman E, Ohrbach R, Truelove E, Look J, Anderson G, Goulet JP, List T, Svensson P, Gonzalez Y, Lobbezoo F, et al. Diagnostic criteria for temporomandibular disorders (DC/TMD) for clinical and research applications: recommendations of the international RDC/TMD consortium network* and orofacial pain special interest groupdagger. J Oral Facial Pain Headache. 2014;28(1):6–27.
3. Brown DT, Cox 2nd LK, Hafez AA, Cox CF. True normal" TMD control subjects: a rare clinical finding. Cranio. 1998;16(2):84–9.
4. Christensen LV, Orloff J. Reproducibility of temporomandibular joint vibrations (electrovibratography). J Oral Rehabil. 1992;19(3):253–63. 5. Tallents RH, Hatala M, Katzberg RW, Westesson PL. Temporomandibular joint
sounds in asymptomatic volunteers. J Prosthet Dent. 1993;69(3):298–304. 6. Greene CS. Managing the care of patients with temporomandibular
disorders: a new guideline for care. JADA. 2010;141(9):1086–8.
7. Look JO, Schiffman EL, Truelove EL, Ahmad M. Reliability and validity of axis I of the research diagnostic criteria for temporomandibular disorders (RDC/ TMD) with proposed revisions. J Oral Rehabil. 2010;37(10):744–59. 8. Ahmad M, Hollender L, Anderson Q, Kartha K, Ohrbach R, Truelove EL, John
MT, Schiffman EL. Research diagnostic criteria for temporomandibular disorders (RDC/TMD): development of image analysis criteria and examiner reliability for image analysis. Oral Surg Oral Med Oral Pathol Oral Radiol Endod. 2009;107(6):844–60.
9. Truelove E, Pan W, Look JO, Mancl LA, Ohrbach RK, Velly AM, Huggins KH, Lenton P, Shiffman EL. The research diagnostic criteria for temporomandibular disorders. III: validity of axis I diagnoses. J Orofac Pain. 2010;24(1):35–47. 10. Ateshian GA. A theoretical formulation for boundary friction in articular
cartilage. J Biomech Eng. 1997;119(1):81–6.
11. Nitzan DW. The process of lubrication impairment and its involvement in temporomandibular joint disc displacement: a theoretical concept. J Oral Maxillofac Surg. 2001;59(1):36–45.
12. Tanaka E, Dalla-Bona DA, Iwabe T, Kawai N, Yamano E, van Eijden T, Tanaka M, Miyauchi M, Takata T, Tanne K. The effect of removal of the disc on the friction in the temporomandibular joint. J Oral Maxillofac Surg. 2006;64(8):1221–4. 13. Tanaka E, Iwabe T, Dalla-Bona DA, Kawai N, van Eijden T, Tanaka M,
Kitagawa S, Takata T, Tanne K. The effect of experimental cartilage damage
and impairment and restoration of synovial lubrication on friction in the temporomandibular joint. J Orofac Pain. 2005;19(4):331–6.
14. Tanaka E, Kawai N, Tanaka M, Todoh M, van Eijden T, Hanaoka K, Dalla-Bona DA, Takata T, Tanne K. The frictional coefficient of the temporomandibular joint and its dependency on the magnitude and duration of joint loading. J Dent Res. 2004;83(5):404–7.
15. Chu M, Gradisar I, Mostardi R. A noninvasive electroacoustical evaluation technique of cartilage damage in pathological knee joint. Med Biol Eng Comput. 1978;16(4):437–42.
16. Chu ML, Gradisar IA, Railey MR, Bowling GF. Detection of knee joint diseases using acoustical pattern recognition technique. J Biomech. 1976;9(3):111–4. 17. Chu ML, Gradisar IA, Railey MR, Bowling GF. An electro-acoustical technique
for the detection of knee joint noise. Med Res Eng. 1976;12(1):18–20. 18. Sharma S, Crow HC, McCall Jr WD, Gonzalez YM. Systematic review of
reliability and diagnostic validity of joint vibration analysis for diagnosis of temporomandibular disorders. J Orofac Pain. 2013;27(1):51–60.
19. Rasmussen OC. Description of population and progress of symptoms in a longitudinal study of temporomandibular arthropathy. Scand J Dent Res. 1981;89(2):196–203.
20. Kalaykova S, Lobbezoo F, Naeije M. Two-year natural course of anterior disc displacement with reduction. J Orofac Pain. 2010;24(4):373–8.
21. Kurita K, Westesson PL, Yuasa H, Toyama M, Machida J, Ogi N. Natural course of untreated symptomatic temporomandibular joint disc displacement without reduction. J Dent Res. 1998;77(2):361–5. 22. Manfredini D, Favero L, Gregorini G, Cocilovo F, Guarda-Nardini L. Natural
course of temporomandibular disorders with low pain-related impairment: a 2-to-3-year follow-up study. J Oral Rehabil. 2013;40(6):436–42.
23. Sato S, Goto S, Kawamura H, Motegi K. The natural course of nonreducing disc displacement of the TMJ: relationship of clinical findings at initial visit to outcome after 12 months without treatment. J Orofac Pain. 1997;11(4):315–20. 24. Sato S, Goto S, Nasu F, Motegi K. Natural course of disc displacement with
reduction of the temporomandibular joint: changes in clinical signs and symptoms. J Oral Maxillofac Surg. 2003;61(1):32–4.
25. Yura S. Natural course of acute closed lock of the temporomandibular joint. Br J Oral Maxillofac Surg. 2012;50(7):646–9.
26. Imirzalioglu P, Biler N, Agildere AM. Clinical and radiological follow-up results of patients with untreated TMJ closed lock. J Oral Rehabil. 2005;32(5):326–31. 27. Schiffman EL, Ahmad M, Hollender L, Kartha K, Ohrbach R, Truelove EL,
Zhang L, Hodges JS, Sommers E, Anderson GC, et al. Longitudinal Stability of Common TMJ Structural Disorders. J Dent Res. 2016. https://doi.org/10. 1177/0022034516679396.
28. Zweig MH, Campbell G. Receiver-operating characteristic (ROC) plots: a fundamental evaluation tool in clinical medicine. Clin Chem. 1993;39(4):561–77. 29. Altman DG. Problems in dichotomizing continuous variables [letter;
comment]. Am J Epidemiol. 1994;139:442–5.
30. [https://www.bioresearchinc.com/]. Accessed May 20, 2016
31. Dworkin SF, LeResche L. Research diagnostic criteria for temporomandibular disorders: review, criteria, examinations and specifications, critique. J Craniomand Disord. 1992;6:301–55.
32. Ishigaki S, Bessette RW, Maruyama T. Vibration analysis of the temporomandibular joints with degenerative joint disease. J Craniomandib Prac. 1993;11:276–83. 33. Diagnostic criteria for temporomandibular disorders (DC/TMD) clinical
examination protocol: version 02June2013 [www.rdc-tmdinternational.org]. Accessed Nov 29, 2016.
34. Radke JC, Kull RS. Distribution of temporomandibular joint vibration transfer to the opposite side. Cranio. 2012;30(3):194–200.
35. R: A language and environment for statistical computing. [http://www.R-project. org/]. Accessed 14 Feb 2017.
36. Took CC, Sanei S, Rickard S, Chambers J, Dunne S. Fractional delay estimation for blind source separation and localization of temporomandibular joint sounds. IEEE Trans Biomed Eng. 2008;55(3):949–56.
37. Widmalm SE, Williams WJ, Ang BK, McKay DC. Localization of TMJ sounds to side. J Oral Rehabil. 2002;29(10):911–7.
38. Widmalm SE, Williams WJ, Yang KP. False localization of TMJ sounds to side is an important source of error in TMD diagnosis. J Oral Rehabil. 1999;26(3):213–4. 39. Zhang J, Whittle T, Wang L, Murray GM. The reproducibility of temporomandibular