Application of Sentiment Analysis
:
Assessing
the Reliability and Validity of the Global Airlines
Rating Program
Author: Guohuibin Li
University of Twente P.O. Box 217, 7500AE Enschede
The Netherlands
ABSTRACT,
The Internet provides the vast amount of information which is free assessable.
Among different types of information, online consumer reviews (OCRs) and social
media feeds are of great importance to businesses for their substantial influences on
customers’ decision making. Within the aviation industry, Skytrax, a UK-based
consultancy, operates the world biggest airline review site and runs a unique airline
rating system named the global Airlines Rating program (1-5 stars). This program
categorises airlines into five classes and updates the result annually. An increasing
number of airlines has adopted the result for promotional purposes. However,
researchers challenge the reliability and validity of this program, and little literature
has discussed such issues. This paper is going to partially fill this gap by assessing
the reliability, discriminate validity, and external validity of this program via
sentiment analysis based on travellers’ reviews from Skytrax and associated Twitter
messages.
Results reveal that the global Airlines Rating program (1-5 stars)
possesses a
low-level reliability, poor discriminate validity, and fragile external validity according to
airlines’ knowledge on Twitter. Theoretically, this paper further enriches the text
mining model proposed by Kayser & Blind (2016). The current research framework
is of the great relevance for future study. Practically, this thesis raises cautions
regarding applications of this program for travellers and airlines.
Graduation Committee members: Dr Fons Wijnhoven
Dr Matthias de Visser
Keywords
Skytrax, airlines, online customer reviews, sentiment analysis, reliability, discriminant validity, external validity, Twitter.
Permission to make digital or hard copies of all or part of this work for personal or classroom use is granted without fee provided that copies are not made or distributed for profit or commercial advantage and that copies bear this notice and the full citation on the first page. To copy otherwise, or republish, to post on servers or to redistribute to lists, requires prior specific permission and/or a fee.
9th IBA Bachelor Thesis Conference, July 5th, 2017, Enschede, The Netherlands.
1.
INTRODUCTION
The internet provides the vast amount of information about almost everything. Individuals have perceived the internet as an important source in which a large number of opinions and experiences are readily available. People’s evaluations significantly influence others’ beliefs, perceptions, and particularly their buying decisions (Liu, 2010; Park et al., 2007). Nowadays, the information flow has gradually transformed to an online-based aggregation of experiences, insights, and views (Jansen et al., 2009). The steep increase of online data creates a significant opportunity for companies to understand better what customers are saying about a product, topic, or other entity (He et al., 2015).
Online consumer reviews (OCRs) have assisted customers in understanding strengths and weaknesses of a product or service before making the purchasing decision (Salehan & Kim, 2016). Some studies show that consumers prefer user-generated contents over information offered by vendors (Bickart & Schindler, 2001). Moreover, Nielsen (2012) reported that following recommendations from families and friends, OCRs were perceived as the second trusted source of product information. Thus, it is inevitably necessary for any kinds of businesses to analyse OCRs (Yee Liau & Pei Tan, 2014). Regarding the air transport industry, one study reveals that traveller satisfaction has a direct influence on airlines’ profits (Hesskett et al., 1994). As a consequence, it is of particular significance and urgency for airlines to consistently measure traveller satisfaction through OCRs (Saha & Theingi, 2009). Skytrax1, a consultancy firm located in London, does advisory
research mainly within the air transport industry (Izenman, 2008). Annually, this company conducts surveys and implements audit to update the star-based global Airlines Rating program (1-5) and confer related awards (Yakut et al., 2015). This program has attracted international interests and has been adopted by some airlines for promotional purposes (Pérezgonzález & Gilbey, 2011b). Also, Skytrax is probably recognised as the largest airline review site worldwide with over 670 airlines opened for reviewing and millions of airlines and airports reviews (Pérezgonzález & Gilbey, 2011a). Jacsó (2009) reported four distinct features of the global Airlines Rating program (1-5 stars): free accessible, experienced auditing, the unique ranking system, and informative and competent textual reviews. However, according to Jacsó (2009), this program also bears controversies. It includes a relatively few number of airlines. Compared with the total number of airlines were open to review, only 25% airlines were scored in 2009. Although this ratio enhanced to 30% in 2011 (Pérezgonzález & Gilbey, 2011a) and 42% in 2017 (Skytrax, 2017), it still lacks representativeness of the whole industry. Moreover, there are almost half number of airlines grouped into the 3-Star Airlines, leading to this type of airlines are unable to differentiate each other. Further, this program pools low cost carriers together with regular incumbents. This configuration is sometimes confusing since these two kinds of airlines do not share too many similarities concerning the service standard. Lastly, the interpretation of this program remains ambiguity. Even if textual explanations are available via its site2, quantitative
interpretations are difficult to be generated.
Thanks to the fast internet development, social media have increasingly played a profound role in changing our lives and the way regarding how we interact with the rest of the world
1http://www.airlinequality.com/
2http://www.airlinequality.com/ratings/skytrax-airline-ratings/
(Safko & Brake, 2012). The data on social media is of practical relevance to businesses. Evidence indicates that many companies have maintained social media accounts such as Facebook and Twitter to interact with their customers. (Salehan & Kim, 2016). As a result, the hidden knowledge about customers can be generated through this process to gain competitive advantages (He et al., 2013).
Even more, knowledge gained from social media towards a certain topic is more valuable because millions of opinions expressed by various groups of people all over the world are less likely to be biased. Therefore, various kinds of online customers’ views on social media, such as reviews, comments, and posts, are increasingly being considered and utilised as instruments in making corporate strategies that adapt customer needs.
However, difficulties in collecting and analysing textual data show up as the main drawback of using insights from customers’ reviews (Ivascenko, 2016). Text mining makes this process possible since it structures and aggregates textual data in a greatly automated manner (Kayser & Blind, 2016). Among a arrange of techniques, sentiment analysis (SA) is a commonly applied technique which aims to discover sentiments of customers by extracting subjective information (Kaur & Duhan, 2015). Because opinions are central to influence individuals’ behaviour and their decision making, a wide range of fields and social domains can make use of SA (Liu, 2012). With respect to the aviation industry, Yee Liau et al.,(2014) reported that text mining contributed to improvements in airlines’ brand awareness, loyalty and recognition. Prior research has applied various text mining techniques to Skytrax. Yakut et al., (2015) mined numerical ratings (1-5) from travellers’ reviews and reported that value of money and staff service were dominant factors of customer reviews of in-flight services. Lacic et al., (2016) mined textual reviews on Skytrax and concluded that SA bear great potential in explaining and predicting traveller satisfaction. This suggestion is in line with Clayton & Hilz (2015) for proposing SA to the airline's sector. Little literature, however, has discussed the reliability and validity of the global Airlines Rating program (1-5 stars). In order to fill this gap, this thesis intends to answer three questions focusing on different aspects regarding the global Airlines Rating program (1-5 stars) via the application of SA. The first question aims at assessing the reliability of this rating program by using travellers’ reviews from Skytrax. The second question intends to evaluate the discriminant validity of the program and to explore sentiment variations for different types of airlines. The last question emphasises measuring the external validity of the same program by introducing associated Twitter messages into the analysis. Therefore, three research questions are formulated:
RQ1: To what extent are sentiments of reviews about air experiences from Skytrax are correlated with the Star-Airline Ratings (1-5)?
RQ2: To what extent do the Star-Airline Ratings (1-5) differ for different types of airlines?
RQ3: How do sentiments about travellers' air experiences differ between Skytrax and Twitter?
describes the research methodology, in which the research scope, the research model, the strategy about data collection, and the introduction of applied tools are elaborated. Section 4 is divided into three parts. Results and analyses towards the RQ1, RQ2, and RQ3 are presented respectively. Section 5 draws the main conclusion. Discussions, research limitations, and ideas for future studies are expounded in Section 6. Lastly, acknowledgements are attached in Section 7.
2.
THEORETICAL FRAMEWORK
2.1
Literature Search Strategy
Both systematic and non-systematic approaches were adopted during the literature searching stage. In the very beginning, Dr Fons Wijnhoven, the first supervisor of this thesis, assigned some articles. Later on, documents related to text mining and SA were found via databases such as Web of Science, Google Scholar, Scopus, and Science Direct. More in-depth literature concerning the aviation sector, in particular, Skytrax, with the relation to the text mining and SA was further searched via Google Scholar as the other databases generated few results. More importantly, the most of the literature was accessed through backwards citations of found papers. As much of the previously analysed articles had drawn information from the same articles, these backwards citations appeared to be valid confirmations. Last but not least, knowledge about social research methodologies and statistics was recalled with books such as Dooley (2009), Trochim et al., (2016), Huizingh (2007), and van den Berg et al.,(2014).
2.2
Reliability
In research, the term reliability is known as "repeatability" or "consistency", meaning that a measure is reliable if it would give the same result over and over again (Trochim et al., 2016). In general, four types of reliabilities are mostly distinguished. Each of them accesses reliability through different aspects. According to Dooley (2009), the inter-rater reliability is used to test the degree to which different raters/observers give consistent estimates of the same phenomenon. The test-retest reliability is measured by asking one respondent to do the same test at multiple times and comparing associated results obtained from different turns. The parallel-forms reliability measures the results of two tests constructed in the same way from the same content domain. The internal consistency reliability of an instrument is estimated by how well the items that reflect the same construct yield similar results. In brief, no matter which types of reliability are focused, the correlation coefficient is a key index to explain the relationship between measured variables.
Regarding this thesis, the following analysis does not depend on that classification. The RQ1 concerns the general reliability of the global Airlines Rating program (1-5), which will be assessed by using travellers’ reviews posted on Skytrax. Those reviews can be assumed to be reliable since they have been verified before publishing.
2.3
Validity
Unlike reliability that measures the consistency of an instrument, validity refers the extent to which the instrument measures what it intends to measure. In another word, validity concerns the relationship between indicators of that instrument and concepts the instrument want to assess (Dooley, 2009). There are several types of validity namely content or face validity, construct validity, internal validity, and external validity.
2.3.1
Discriminate validity
Discriminant validity, a branch subordinating under construct validity (Trochim et al., 2016), is of high relevance to the RQ2. Based on Dooley (2009), discriminant validity is defined as the degree to which the operationalization of a measurement is not similar to other operationalizations that it theoretically should not be similar to. For example, to show the discriminant validity of an English reading test, one might correlate the scores on his or her test with scores obtained from an English writing test, in which low correlations would be evidence of discriminant validity.
In this case, travellers’ reviews based on different types of airlines on Skytrax will be used to determine the quality of discriminant validity of the global Airlines Rating program (1-5).
2.3.2
External Validity
External validity is often referred as the generalisation (Dooley, 2009). It concerns the approximate truth of conclusions the involve generalisations (Trochim et al., 2016). General speaking, this type of validity measures the degree to which the result from one study would also hold for other persons in other places and at other times. Because of different settings controlled by a certain study, such as people, places, and times, the associated findings might be only applicable to that environment in which the research has been build up. The external validity is crucial for Skytrax since the implication from the global Airlines Rating program (1-5) is important for airlines and travellers. It determines to what extent the star-based airline ratings can be broadly applied beyond Skytrax’ controls. The use of this program would be less limited if it features low external validity.
2.4
Text Mining
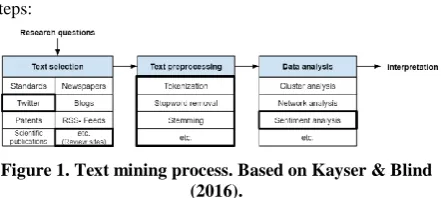
[image:3.595.320.541.598.697.2]With the entry of web 2.0, heterogeneous sources have generated the considerably larger volume of online data than ever before (Kaur & Duhan, 2015). However, such kind of data is rarely presented systematically (Cachia et al., 2007). Text mining is an emerging technology which attempts to extract meaningful information from unstructured textual data (He et al., 2013). Specifically, it aims to deduct useful models, trends, patterns, or rules from unstructured data such as text files, HTML files, chat messages, and emails (Abdous & He, 2011; Chiang et al., 2011; Hung & Zhang, 2008; Romero et al., 2008). In contrast to collecting data manually, text mining can automatically perform this process, which saves the massive amount of time and efforts. This technique, therefore, can be viewed as an efficient means to systematically discover hidden knowledge from written texts (Kayser & Blind, 2016). Kayser & Blind (2016) depicts the text mining process in three steps:
Figure 1. Text mining process. Based on Kayser & Blind (2016).
collection or preferably automatic extraction. The current study extracts data from two sources of the review site Skytrax and the social media site Twitter.
The second step is called text preprocessing. The gathered raw data needs to be converted into machine-understood formats for further processing. Several techniques can perform this task. For example, tokenization will divide a text into its individual elements as words. Stopwords will remove irrelevant terms and function words containing in the text, such as articles, conjunctions, and pronouns. Stemming will restore every individual word into its basic form (ex. three words: personal, persons, and personalization, are perceived as a single word person). The frequency of each word is documented for the further analysis. Semantria3, the selected SA tool for this study,
utilises a hybrid system applying a mix of techniques in conducting SA. (Hilborg & Nygaard, 2015).
The third step is data analysis. Depending on the research objective, several analyses, for instance, cluster analysis, SA, and network analysis are possible to be applied. Because data cannot speak itself, it demands specific domain knowledge and sufficient skills to interpret. This study ignores other types of analysis as only SA is relevant.
2.5
Sentiment Analysis (SA)
SA studies people’s opinions, appraisals, attitudes, and emotions towards a certain entity such as individual, issue, event, and their attributes by extracting sentiments and opinions from written texts (Liu, 2012). It commonly extracts and analyses data in an automated manner. SA often interchangeably appears with synonyms such as opinion mining (OM), subjectivity analysis, and appraisal extraction (Pang & Lee, 2006; Serrano-Guerrero et al., 2015). However, Serrano-Guerrero et al., (2015) indicated differences among such terms as each of them presented different connotations. Moreover, Medhat et al.,(2014) pointed out that OM was about the extraction and investigation of people’s opinions about an entity while SA concerns the discovery and analysis of the sentiment from a given text. This distinction will not be adopted for this thesis since both tasks of text extraction and sentiment analysis will be addressed.
2.5.1
Definitions of the central concept
Based on Kaur & Duhan (2015), facts and opinions are mostly two main kinds of available textual information. Objective statements consist of facts, while subjective statements contain personal sentiments and opinions concerning an event or an object. SA emphasises the later one about individuals’ personal feelings. Serrano-Guerrero et al., (2015) described “opinion as a positive or negative sentiment, view, attitude, emotion, or appraisal about an entity (product, person, event, organisation or topic) or an aspect of that object from a user or group of users”. The following quintuple illustrates this statement (Kaur & Duhan, 2015):
<OJ, fjk, soijkl, hi,tl >.
The first three notations OJ, fjk, and soijkl denote the target
object, the feature or attribute fk of the object OJ, and the
sentiment value of holder hi about object OJ regarding its
feature fk at time tl (Kaur & Duhan, 2015). Serrano-Guerrero et
al., (2015) used different denotations in naming the target object and its attribute with ej and ajk respectively, however, the
main idea keeped as same as presented here. Taking one airlines’ review from Skytrax as an example, the meaning of soijkl can be interpreted as: the sentiment expressed by a
traveller (hi) about a particular airline (OJ) concerning a certain
3https://online.semantria.com/
attribute of this carrier, for instance, the quality of in-flight service (fk ) at a given time (tl).
Moreover, SA conducts at three different levels (Ivascenko, 2016; Kaur & Duhan, 2015; Serrano-Guerrero et al., 2015). Document level pays attention to the overall sentiment of the whole document (Jagtap & Pawar, 2013). Sentence level classifies the individual sentences bearing sentiments in the text (Jagtap & Pawar, 2013). Feature (or entity/aspect) level analyses attributes or features of products in a document or sentence (Kaur & Duhan, 2015). The current research is conducted at the document level since the identification of the overall sentiment of reviews or Twitter messages is necessary.
2.5.2
Related research
As opinions are of the vital importance to all social activities and particularly critical in influencing individual behaviours and decision making (Liu, 2012), SA has been applied to a various range of fields and social domains. Among researchers, commonly studied areas of SA are: public relations in particular brand management (He et al., 2015; Yee Liau & Pei Tan, 2014), movie reviews (Bai, 2011; Pang, Lee, & Vaithyanathan, 2002; Rui et al., 2013), stock market prediction (Baker & Wurgler, 2007; Tetlock, 2007), product reviews (Brun, 2011; Ding et al., 2008; Fang & Zhan, 2015; Hu & Liu, 2004), political sentiments towards prediction of election (Bakliwal et al., 2013; Choy et al., 2011; Wanner et al., 2009), and the aviation sector (Adeborna & Siau, 2014; Jacsó, 2009; Misopoulos et al., 2014; Wan & Gao, 2016; Yee Liau & Pei Tan, 2014). Additionally, much literature, namely Khan et al., (2011), Lacic et al., (2016), Vohra & Teraiya (2013), and Yakut et al., (2015), has discussed the application of SA with relation to airline review sites. Nevertheless, for Skytrax, previous studies have either used its database as the criterion to validate new testing models or merely analysed numerical ratings from airlines’ reviews (the number of stars). However, asscoated textual reviews remain largely unexplored. Therefore, it is of the particular interest for this study to take that textual information into the analysis.
2.5.3
Constraints about SA
Nonetheless, SA cannot be perceived as a perfect method; it confronts several challenges. Kaur & Duhan (2015) and Serrano-Guerrero et al.,(2015) raised six problems for SA: negation handling, domain generalisation, pronoun resolution, language generalisation, the world (related) knowledge, and mapping slangs.
what the “apple” is in order to confirm the sentiment. Sixth, in some informal speeches, for example, online texts, the presence of unstructured words, such as “gr8” (stands for great) and emoji, demands new techniques to identify the associated sentiment. In short, these factors can potentially reduce the accuracy of SA and consequently affect the research result. Addition to that, since OCRs have the potential to influence individuals, online fake reviews or so-called online review spams are getting more and more attentions (Salehan & Kim, 2016). Kaur et al., (2016) defined the spam as any received messages which were not of users’ interests. Spams can pollute real time searching environment in several ways, for instance by generating unnecessary online traffic, dispersing pornography, spreading malware, and diffusing malicious and viruses (Kaur et al., 2016). Therefore, the use of a dataset with no verifications of spams will potentially affect the reliability of that SA.
For this thesis, above issues have been addressed or controlled to some acceptable degrees. Semantria, the selected SA tool, displays the high rate of accuracy (Hilborg & Nygaard, 2015; Serrano-Guerrero et al., 2015). Besides, regarding the spam problem, Skytrax classifies reviews into two types with either “verified” or “unverified”. Based on Skytrax (2016a), “verified” reviews indicate that users have experienced trips. Editorial staffs make this judgement after screening travel evidence uploaded by the user such as the booking itinerary, the e-ticket or the boarding pass. The current study only employs “verified” reviews for the SA. Twitter has a similar mechanism. It allows users to report spams by clicking “They are posting spams” under the “Report” menu, leading to the assumption that extracted Twitter messages are reliable without spams.
3.
METHODOLOGY
3.1
The Research Scope
[image:5.595.319.537.85.271.2]As discussed previously, the review site under observation was called Skytrax. One example of an airline review on Skytrax was given:
Figure 2. An example: airline review text4.
Besides, the entity under assessment was named the global Airlines Rating Program (1-5 stars). It was unique for providing rankings to airlines by applying the global quality standard (Skytrax, 2016b). The brief of this program was summarised in the table below:
[image:5.595.56.271.479.658.2]
4http://www.airlinequality.com/ratings/skytrax-airline-ratings/
Table 1. The global Airlines Rating Program (1-5 stars)4.
Airlines star
ratings #
* of
airlines Explanations
5-Star Airlines 9
The highest overall quality performance across the airport and cabin service. 4-Star Airlines 39 A performance. good overall quality
3-Star Airlines 108
A fair quality performance, acceptable product and service standards. 2-Star Airlines 20 A lower total quality
performance.
1-Star Airlines 1 A delivered. poor quality of product
Total 177
* # denotes the number of.
Moreover, this study considered Twitter as an appropriate data source for four reasons. First, the information on Twitter was constantly updated. Thelwall et al.,(2011) reported that more than 80% of Twitter account holders updated their statuses every single day. Based on this fact, it could be assumed that collected messages could well present airlines’ services on the timely basis without significant lags. Second, compared with posts on Facebook, tweets on Twitter were publicly accessible and historically trackable (Wan & Gao, 2016), which made it possible to track all related airlines’ messages. Thirdly, Twitter users featured various social backgrounds, which was beneficial to collect data from different interest groups (Yee Liau & Pei Tan, 2014). Fourthly, previous works had been done by using tweets for SA such as Pak & Paroubek (2010), Read (2005), and Wilson et al.,(2005). These studies have demonstrated strong evidence that Twitter could be taken as a valuable data source for SA.
Furthermore, this study gathered data from Skytrax and Twitter within a period of six months. Specifically, from the beginning of October 2016 to the end of March 2017. Given that the seasonality highly influenced the airline's industry, this period consequently covered both the low and peak seasons (e.x. Christmas and New Year holidays), leading to a representative time frame.
Additionally, as Skytrax only supported English reviews, non-English tweets and comments were therefore neglected.
3.2
The Research Model
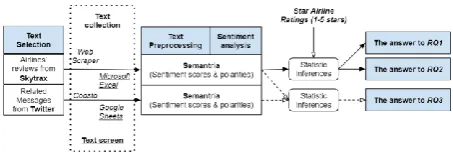
Adopted from the text mining process proposed by Kayser & Blind (2016), the following research model was established:
Figure 3. The research model.
[image:5.595.314.541.615.697.2]associated comments about the same array of airlines were collected from Twitter. Airlines reviews were extracted from Skytrax using one online web extractor named as Web Scraper5; Coosto6 gleaned tweets and related comments from
Twitter. Once this process had been done, the saved CSV files were opened through Microsoft Excel (Skytrax data) or Google Sheets (Twitter data) to screen qualified texts based on criteria such as publication dates and textual languages.
Next, Semantria transformed these texts into standard formats (step 2), conducted SA, and communicated SA results including sentiment scores and polarities (step 3).
Eventually, SPSS performed various statistical analyses by applying the SA results. Answers towards the three research questions were then provided at the end.
3.3
Data Collection
Based on the consideration of data representation, this thesis extracted reviews and tweets (also comments) regarding all 177 certified airlines from Skytrax and Twitter respectively.
3.3.1
Text collection from Skytrax
Textual reviews from Skytrax were extracted by means of Web Scraper as introduced previously. With this tool, data could be collected automatically, resulting in the massive saving of time. Moreover, this tool was able to operate as an extension of the Google Chrome, which was relatively easy to use, and this version of extension on the Google Chrome was free of charge. Once the web page from which data should be extracted was inserted, the system presented several elements on the selected web page. In this case, review contents, publication dates, and “verified”/“unverified” icons were extracted. Review handlines were excluded as sentiments of handlines were logically consistent with those from review texts. Other elements such as numerical star-ratings and demographic information about publishers were ignored because they were out of this research’s interests. After running the query, Web Scraper saved the data into a CSV file which severed as an executable format for Microsoft Excel to further filter qualified texts. Eventually, 4195 reviews remained for the analysis.
3.3.2
Text collection from Twitter
The student version of Coosto was employed to extract associated tweets and comments from Twitter. Coosto was a powerful tool in analysing social media feeds. It provided businesses with valuable insights through social monitoring. Coosto supported up to eight different social media sites, as well as news sites, blogs, and forums (Plant, 2016). More importantly, Coosto could automatically collect textual data towards a specific search word from supported platforms and save the associated result as either Microsoft Excel files or CSV files (Beelen, 2016). This function saved the massive amount of efforts in creating complex APIs queries to extract Twitter data.
Tweets and related comments regarding 177 airlines were gathered by repeatedly typing each air carrier’s name, setting the searching source, specifying the time spam, and selecting the detected language. In total, 29075 texts were saved into the CSV file. Even if the searching language was set in English with turning the option “strict language flier” on, search results still contained a lot of non-English messages. The CSV file was then opened through Google Sheets and by inserting the formula:“=DETECTLANGUAGE(the text column)” to detect text languages. Consequently, 18553 non-English messages were removed from the dataset (10522 English texts remained).
5http://webscraper.io/
3.4
SA by Semantria
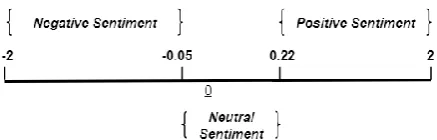
This study selected Semantria to conduct SA for two major reasons. First, this tool could exhibit the sentiment of a given text in a more precise representation through a sentiment score. According to Semantria (2013), SA in the document level had a sentiment score ranged from -2 to 2, in which -2 was really negative, -1 was negative, 1 was positive, and 2 was extremely positive. In contrast to a linear scale that had values with the linear step, for example, the next value would always be higher than the previous at the same constant value (e.x. 1, 2, and 3), Semantria applied a logarithmic scale. This scale is displayed in the chart below:
Figure 4. Sentiment scale (document level).
Within this range, scores fall from -2 to -0.05, from -0.05 to 0.22, and from 0.22 to 2 indicated negative, neutral, and positive sentiments respectively (Semantria, 2014). This study would agree with this scale and adopt it for the following analysis.
[image:6.595.320.539.217.287.2]Second, Serranos-Guerrero et al., (2015) reported that compared with other 16 different SA tools which could be freely accessed, Semantria exhibited higher accuracy in identifying sentiments. Besides, Hilborg & Nygaard (2015) indicated that this tool possessed several advantages. It featured unique functions such as supports of multiple languages, large capacity of processing (up to 100 documents at the same time), and the flexible applicability of analyses at the various SA levels (e.x. the document, sentence, and entity/feature level). Because all data were processed with the trial license of Semantria, the limited document size applied to each analysed text. Regarding the data from Skytrax, Semantria failed to handle 162 texts due to the exceeded document size. Whereas, for Twitter data, none of tweets nor comments exceeded the limit. Although the sample sizes had been reduced, the remains could still be assumed large enough for the statistical analysis. The following two tables gave the summary regarding the data collection:
Table 2. Data collection summary
(a). Skytrax data
Star ratings #
*
extracted reviews
#*
exceeded size reviews
#*
analysed reviews
5-Star 555 19 536 4-Star 1452 52 1400 3-Star 1960 91 1869 2-Star 225
0
225
1-Star 3 3
Total 4195 162 4033
* # denotes the number of.
(b). Twitter data
Star ratings #
*
extracted messages
#*
non-English messages
#*
analysed reviews
5-Star 1974 1197 777 4-Star 12895 8549 4346 3-Star 13795 8614 5181 2-Star 326 178 148 1-Star 85 15 70
Total 29075 18553 10522
* # denotes the number of.
Once Semantria had performed SA, a new spreadsheet could report the corresponding result. This result contained various indexes, only sentiment scores and sentiment polarities were imported into SPSS for the current study.
4.
RESULTS AND ANALYSIS
Available data is checked for some statistical assumptions at first place. Both texts extracted from Skytrax and Twitter can be assumed to be independent since they have been posted by various writers with different demographic backgrounds and from disparate geographical locations. Moreover, both the Shapiro-Wilk test and visual inspections (histograms and Normal Q-Q plots) reveal that the variable “SentimentScores” is not normally distributed. Therefore, nonparametric tests are mainly selected for this thesis as the normality is not assumed. Specifically, the RQ1 uses Kendall’s tau and the Spearman’s rank-order correlation to assess the reliability of the global Airlines Rating program (1-5 stars). The RQ2 selects the discriminant analysis to measure sentiment differences for different types of airlines. For the RQ3, the relation between data from Skytrax and Twitter is investigated via the two same tests chosen for the RQ1. Besides, the sentiment difference between Skytrax and Twitter is further explored through the Mann-Whitney test (only two groups remained here).
4.1
Correlations between Reviews’
Sentiments and the Star-Airlines Ratings
(1-5)
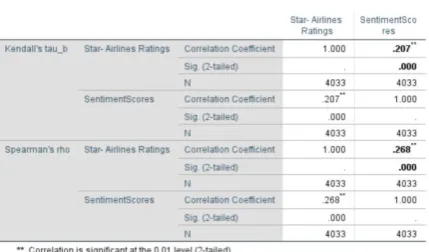
[image:7.595.52.282.85.201.2]The following table displays results of Kendall’s tau test and the Spearman’s rho test:
Table 3. Correlation tests.
As seen above, correlation coefficients reported by Kendall’s tau and the Spearman’s rho test are 0.207 and 0.268 respectively, indicating an uphill but feeble linear relation between the two variables. Associated P-values for both tests are less than 0.001. Given the significant level (α=5%), it can
be stated that this relationship is statistically significant. In another word, two tests show that there is a weak positive relation between sentiments of reviews from Skytrax and the Star-Airlines ratings (1-5).
According to the evidence, the global Airlines Rating program (1-5 stars) can be sated to possess a low-level reliability based on travellers’ reviews from Skytrax.
4.2
Sentiments Differences for Different
Types of Airlines
Because of the insufficient sample size for the 1 Star-Airlines (only three qualified texts), it cannot be tested for any measures. This group, therefore, is removed from the dataset. It has to highlight that although the discriminant analysis assumes the normality for variables, as long as the sample size is large enough, violation of this assumption is not fatal (Luptak et al., 2016). Besides, discriminant analysis is highly sensitive to outliers as extreme observations have a significant influence on the mean, standard deviation, and the statistical significance (OriginLab, 2013). Through Mahalanobis Distance, five values are identified as outliers and thus are omitted from the dataset. Eventually, SPSS processes 4025 cases without missings. The associated SPSS outputs are enormous. Therefore only some of the relevant information is displayed below.
Table 4. Test of Equality of Group Means.
As seen the test result (univariate ANOVA’s) above, the small P-value (<.001) leads to the rejection of the equal mean hypothesis (α=5%). This test statistic indicates that reviews’ sentiments from travellers are statistically unequal for different classes of airlines (2-5 stars).
Table 5. Box's Test of Equality of Covariance Matrices.
[image:7.595.327.529.465.541.2]Besides, the Box’s M test above reports a small P-value (<.001) which is less than the significant level 0.001, statistically indicating that four kinds of airlines possess unequal sentiment variances. It is noticeable that because the Box’s M test is highly sensitive, the unusual significant level (α=0.1%) is mostly applied (Zaiontz, 2014).
[image:7.595.63.278.559.685.2]The canonical relation is a correlation between the discriminate scores and the levels of the decent variable. The low canonical correlation of 0.270 indicates that the function does not discriminate well. The square of this value can explain the magnitude of the actual effect size between the predictor (reviews’ sentiments) and the outcome (Star Ratings 2-4). Here, the actual effect size between these two variables is only about 7.29%. Besides, although a large lambda of 0.927 indicates that group means do not appear to differ, The associated P-value states this difference is significant. Therefore, we can say that the prediction between reviews’ sentiments and the Star-Airlines Rating (2-4) is statistically accurate. That is to say, theses four categories of airlines can be distinguished.
[image:8.595.318.539.242.511.2]Moreover, Figure 5 depicts mean sentiment scores for different categories of airlines (2 to 4 stars).
Figure 5. The sentiment overview (means).
[image:8.595.65.273.245.415.2]According to the graph above, on average, sentiment scores improve when the certified star groups climb from one class to the next. It is interesting that sentiment means for the 3 Star-Airlines and the 4 Star-Star-Airlines fall together into the “Neutral” sentiment zone (between two red lines). Although the average sentiment for the 5 Star-Airlines appears to be positive, this value (y=0.23) is minimal and just breaks through the up limit (y=0.22) of the neutral sentiment. Whereas, the 2 Star-Airlines exhibits the negative sentiment in general.
Figure 6. Sentiment variances.
Additionally, the boxplot (Figure 6) presents sentiment variances for different types of airlines. First, sentiment medians for these four classes of airlines show an increasing trend. Second, the 3 Star-Airlines possesses the largest sentiment range compared with the other types of airlines. This point implies that reviews from the 3 Star-Airlines tend to be more extreme than those from others. Thirdly, the 5 Star-Airlines owns the greatest number of outliers (values are away from the rest of observations) among this dataset. One is above the maximum and six are below the minimum, indicating that uncommonly negative reviews are likely to be found among the nine top airlines.
Furthermore, to explore sentiment differences for different types of airlines (2-5 stars) by each sentiment polarity, detailed statistics are provided in the table below:
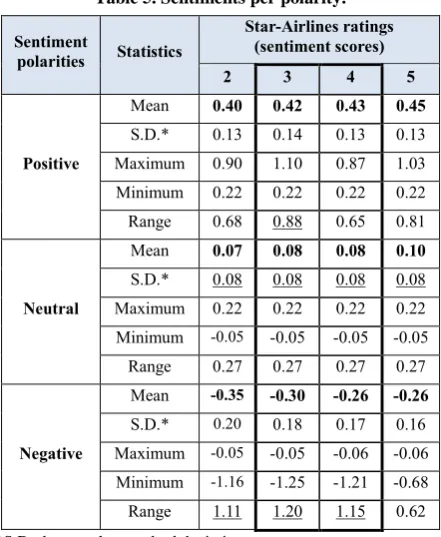
Table 5. Sentiments per polarity.
Sentiment
polarities Statistics
Star-Airlines ratings (sentiment scores)
2 3 4 5
Positive
Mean 0.40 0.42 0.43 0.45
S.D.* 0.13 0.14 0.13 0.13 Maximum 0.90 1.10 0.87 1.03 Minimum 0.22 0.22 0.22 0.22 Range 0.68 0.88 0.65 0.81
Neutral
Mean 0.07 0.08 0.08 0.10
S.D.* 0.08 0.08 0.08 0.08 Maximum 0.22 0.22 0.22 0.22 Minimum -0.05 -0.05 -0.05 -0.05
Range 0.27 0.27 0.27 0.27
Negative
Mean -0.35 -0.30 -0.26 -0.26
S.D.* 0.20 0.18 0.17 0.16 Maximum -0.05 -0.05 -0.06 -0.06 Minimum -1.16 -1.25 -1.21 -0.68 Range 1.11 1.20 1.15 0.62 *S.D. denotes the standard deviation.
Regarding the positive sentiment, on average, sentiment scores increase by around 0.02 with the Star-Airlines ratings going up from one class to the next. Moreover, four types of airlines yield an almost equal standard deviation, indicating that regardless different Star-Airlines categories, sentiments are equally bunched around their averages. Addition to that, the 3 Star-Airlines reports the greatest sentiment range among this dataset, showing the biggest sentiment difference between the maximum and the minimum.
[image:8.595.59.276.545.722.2]The negative sentiment exhibits the upward pattern on average as well. Nevertheless, the 5 Star-Airlines seems not to agree with this trend since the average sentiment for this kind of airlines keeps as same as that for the 4 Star-Airlines. Besides, the negative sentiment displays the greatest variances based on two statistics. The largest standard deviations (sentiments are far dispersed from the means) and the greatest ranges (the biggest sentiment distance between the lowest and the highest). Again, the 3 Star-Airlines and the 4 Star-Airlines report similar statistical figures.
In short, evidence obtained so far implies that the quality of discriminant validity for the global Airlines Rating program (2-5) is poor. Even if different types of airlines are distinguishable (2-5 stars), the actual effect size between reviews’ sentiments and Star Ratings (2-4) is limited. Besides, although several statistics demonstrate a positive relation between sentiments and the Star-Airlines ratings (2-4), it is not easy to differentiate the 3 Star-Airlines and 4 Star-Airlines. Moreover, the largest sentiment range found from the 3 Star-Airlines indicates that travellers conceive more extreme attitudes towards this type of airlines. One reason may be that individuals hold divergent or mixed perceptions regarding the 3 Star-Airlines. It is also possible to question Skytrax’s assessments because services provided by this type of airlines might not adjust to the same standard.
4.3
Sentiment Differences between Skytrax
and Twitter
[image:9.595.318.540.431.613.2]Kendall’s tau and the Spearman’s rho test assess the sentiment consistency between Skytrax data and Twitter data. As such two tests assume the equal sample size for testing variables, data, in this case, are further transformed into pairs (due to the different sample sizes for Skytrax data and Twitter data). This process has been done in SPSS through the “random sampling” command under the “Select Cases” meum. As a result, 4033 randomly selected cases are generated from the Twitter dataset. These cases are then merged with Skytrax data in a new SPSS file.
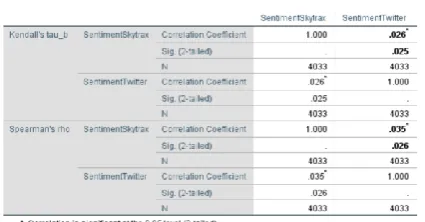
Table 6. Sentiment correlation between Skytrax and Twitter.
As the table reported above, sentiments between two sources display a positive, however, significantly weak correlation. Kendall’s tau yields the coefficient with 0.026, and the Spearman correlation reports that value with 0.035. Nevertheless, taking into account P-values of both tests (0.025 and 0.026), this relationship is not statistically significant, given the critical value (α=5%). It, therefore, appears that although sentiments between reviews (Skytrax) and messages (Twitter) are positively correlated, this relation is too small to claim that sentiments are consistent between Skytrax and Twitter.
Moreover, correlations between Skytrax data and Twitter data for different classes of airlines are examined (Table 7). The 1
Star-Airlines from Skytrax (n=3) is removed due to its insuffcient sample size.
Table 7. Sentiment correlation between Skytrax and Twitter for different types of airlines.
Star- Airlines Ratings
Kendall’s tau Spearman’s rho
C.C.* Sig
(2- tailed) C.C.*
Sig (2- tailed) 2 Star-
Airlines -0.007 0.902 -0.011 0.896 3 Star-
Airlines 0 0.986 0 1 4 Star-
Airlines 0.024 0.216 0.033 0.211 5 Star-
Airlines -0.040 0.216 -0.054 0.210
* C.C. denotes correlation coefficient.
The table shows that four types of airlines delivery distinctive correlation results. Only the 4 Star-Airline reports a positive coefficient. The 3 Star-Airlines generates the coefficient of 0, suggesting no relationship between Skytrax data and Twitter data. Whereas, the rest two types of airlines give the negative values, indicating contrary relations compared with previous two classes of airlines. In a word, as all generated P-values are bigger than the critical value (α=5%), it can be stated that no relations exist between reviews from Skytrax and messages from Twitter.
In addition, sentiment differences between Skytrax and Twitter regarding air experiences are further investigated. Associated test descriptives are displayed below:
Table 8. The descriptive statistic.
[image:9.595.57.270.493.604.2]
Next, the Mann-Whitney test (Table 9) assesses the degree to which the sentiment difference between two sources is statistically significant.
Table 9. Outputs of the Mann-Whitney test.
According to the test above, mean ranks for Skytrax data and Twitter data are different. The very small P-value (<.001) suggests that this difference is statistically significant (critical value α=5%).
In brief, airlines’ reviews from Skytrax show no consistency with Twitter messages, and the latter tends to hold more extreme sentiments. Therefore, it can be claimed that airlines’ knowledge from the global Airlines Rating program (2-5 stars) cannot be generalised to the examed source Twitter (either in the general level nor for different types of airlines).
5.
CONCLUSION
This paper discusses the reliability, discriminant validity, and external validity regarding the global Airlines Rating program (1-5 stars) from Skytrax via the application of SA.
Extracted reviews from Skytrax indicate that this star-based airline rating program possesses a low-level reliability as the correlation between reviews’ sentiments and the Star-Airlines ratings (1-5) is merely 20.7% (26.8% for the Spearman’s rho test).
Moreover, test results reveal a poor discriminate validity for the global Airlines Rating program (2-5 stars). Although the prediction between reviews’ sentiments and the Star-Airlines ratings is statistically accurate, the strength of this relationship is pretty low (given the canonical correlation=0.270). Besides, even if reviews’ sentiments display a positive trend on average with the Star-Airlines ratings changing from one to the next, sentiment differences between the 3 Star-Airlines and the 4 Airlines are minor. Also, this study found that the 3 Star-Airlines held more extreme reviews than other types of airlines. At last, the global Airlines Rating program (1-5 stars) demonstrates a fragile external validity. Although texts’ sentiments from Skytrax and Twitter are positively correlated, this relationship is not statistically significant. Thus, airlines’ knowledge from this rating program cannot be generalised to Twitter. The investigation also finds that Twitter messages are more negative than reviews on the review site Skytrax.
6.
DISCUSSIONS AND LIMITATIONS
6.1
Discussions
6.1.1
Academic relevance
This study further enriches the text mining process presented by Kayser & Blind (2016). In particular, regarding the application of SA via OCRs and Twitter messages, the
proposed research model possesses high potentials for associated studies. Besides, this thesis partially fills a research gap in which so far litter literature has discussed the global Airlines Rating program (1-5) in detail. Concrete statistics offer an intuitive approach to assessing the reliability, validity, and variations for different types of airlines for this program. Moreover, following the research direction provided by Kaur & Duhan (2015), the current study involves social media feeds for SA. Messages from Twitter play as a useful indicator when determining the generalisation ability of the global Airlines Rating program (1-5 stars).
Additionally, the finding of the difficulty in distinguishing the 3 Star-Airlines and the 4 Star-Airlines is in line with Pérezgonzález & Gilbey (2011).
6.1.2
Practical relevance
Insights generated from this study are of significant relevance to air travellers, airlines, and Skytrax. Due to the fact that the global Airlines Rating program (1-5 stars) exhibits an unsatisfied reliability, travellers are encouraged to refer multiple sources for more comprehensive understandings and assessments about different types of airlines.
Air incumbents should be aware that travellers’ reviews on Skytrax might not represent traveller satisfaction as a whole. Significant differences of passengers’ opinions are likely to exist between Skytrax and other platforms. Therefore, air companies need to establish a broad range of communication channels to hear customers’ voices. Additionally, as more extreme reviews have been detected from the 3 Star-Airlines, airlines among this category demand strategically benchmark their performances by not merely relying on rankings assigned by Skytrax, but also referring multiple key performance indicators (KPIs) from other sources.
As for Skytrax, the company can benefit from the research findings to further adjust and improve the global Airlines Rating program (1-5 stars). In particular about the reliability and validity of this program.
6.2
Limitations and further research
Furthermore, Wijnhoven & Bloemen (2014) had questioned the external validity for SA. Therefore, cautions should be taken when generalising findings from this study, especially about measuring the external validity for the global Airlines Rating program (1-5 stars). Because different social media applications feature different characteristics, conclusions from this research based on Twitter messages may not count on other social media sites.
Besides issues mentioned above, there are two directions for the future research. Regarding the evaluation of the external validity for the global Airlines Rating program (1-5 stars), other social media sites are also valuable to be explored. In particular, with more and more individuals are approaching to the steaming era, it would be interesting to include the new emerging type of information such as figures, pictures, and videos into the analysis from media sites like Instagram, Tumblr, and YouTube. Also, based on the information asymmetry (inconsistency) regarding travellers’ air experiences between Skytrax and the Twitter, further studies need to develop associated solutions.
7.
ACKNOWLEDGEMENTS
I would like to express my gratitude to Dr Fons Wijnhoven for his excellent supervision and recommendations. I would also like to thanks for Dr Matthias de Visser for his participation and grading. Lastly, I would like to thank Esther Smit and Yunzhen Kuang for the great cooperation within our bachelor circle and their valuable feedbacks.
8.
REFERENCES
Abdous, M., & He, W. (2011). Using text mining to uncover students’ technology-related problems in live video streaming. British Journal of Educational Technology, 42(1), 40–49.
https://doi.org/10.1111/j.1467-8535.2009.00980.x
Adeborna, E., & Siau, K. (2014). an Approach To Sentiment Analysis – the Case of Airline Quality Rating. In Proceedings - Pacific Asia Conference on Information Systems, PACIS 2014.
Bai, X. (2011). Predicting consumer sentiments from online text. Decision Support Systems, 50(4), 732–742. https://doi.org/10.1016/j.dss.2010.08.024
Baker, M., & Wurgler, J. (2007). Investor Sentiment in the Stock Market. Journal of Economic Perspectives, 21(2), 129–151. https://doi.org/10.1257/jep.21.2.129 Bakliwal, A., Foster, J., van der Puil, J., O’Brien, R., Tounsi,
L., & Hughes, M. (2013). Sentiment Analysis of Political Tweets: Towards an Accurate Classifier. Proceedings of the Workshop on Language Analysis in Social Media, (Lasm), 49–58. Retrieved from http://www.aclweb.org/anthology/W13-1106 Bickart, B., & Schindler, R. M. (2001). Internet forums as
influential sources of consumer information. Journal of Interactive Marketing, 15(3), 31–40.
https://doi.org/10.1002/dir.1014
Brun, C. (2011). Detecting opinions using deep syntactic analysis. International Conference Recent Advances in Natural Language Processing, RANLP, (September), 392–398. Retrieved from
http://www.scopus.com/inward/record.url?eid=2-s2.0-84866847605&partnerID=tZOtx3y1
Cachia, R., Compañó, R., & Da Costa, O. (2007). Grasping the potential of online social networks for foresight. Technological Forecasting and Social Change, 74(8),
1179–1203.
https://doi.org/10.1016/j.techfore.2007.05.006 Chiang, D. M.-H., Lin, C.-P., & Chen, M.-C. (2011). The
adaptive approach for storage assignment by mining data of warehouse management system for distribution centres. Enterprise Information Systems, 5(2), 219– 234. https://doi.org/10.1080/17517575.2010.537784 Choy, M., Cheong, M. L. F., Laik, M. N., & Shung, K. P.
(2011). A sentiment analysis of Singapore Presidential Election 2011 using Twitter data with census
correction. arXiv.org, stat.AP. Retrieved from http://arxiv.org/abs/1108.5520v1%5Cnpapers2://public
ation/uuid/4E015286-2ACF-498F-8E46-CFD40FD9A244
Clayton, E., & Hilz, A. (2015). 2015 Aviation Trends. Retrieved May 2, 2017, from
https://www.strategyand.pwc.com/trends/2015-aviation-trends
Ding, X., Ding, X., Liu, B., Liu, B., Yu, P. S., & Yu, P. S. (2008). A holistic lexicon-based approach to opinion mining. Proceedings of the International Conference on Web Search and Web Data Mining - WSDM ’08, 231. https://doi.org/10.1145/1341531.1341561 Dooley, D. (2009). Social Research Methods. (H. J.Vos, Ed.)
(4th ed.). Harlow: Pearson Enducation Limited. Fang, X., & Zhan, J. (2015). Sentiment analysis using product
review data. Journal of Big Data, 2(1), 5. https://doi.org/10.1186/s40537-015-0015-2
He, W., Shen, J., Tian, X., Li, Y., Akula, V., Yan, G., & Tao, R. (2015). Gaining competitive intelligence from social media data. Industrial Management & Data Systems, 115(9), 1622–1636. https://doi.org/10.1108/IMDS-03-2015-0098
He, W., Zha, S., & Li, L. (2013). Social media competitive analysis and text mining: A case study in the pizza industry. International Journal of Information Management, 33, 464–472.
https://doi.org/10.1016/j.ijinfomgt.2013.01.001 Heskett, J. L., Jones, T. O., Loveman, G. W., Sasser, W. E., &
Schlesinger, L. A. (1994). Putting the Service Profit-Chain to Work. Harvard Business Review.
https://doi.org/10.1145/781031.781034 Hilborg, P. H., & Nygaard, E. B. (2015). Viability of
sentiment analysis in business. The Copenhagen Business School. Retrieved from
http://studenttheses.cbs.dk/handle/10417/5710 Hu, M., & Liu, B. (2004). Mining and summarizing customer
reviews. Proceedings of the 2004 ACM SIGKDD International Conference on Knowledge Discovery and Data Mining KDD 04, 4, 168.
https://doi.org/10.1145/1014052.1014073
Huizingh, E. (2007). Applied Statistics with SPSS (First edit). London: SAGE Publications Ltd.
Hung, J.-L., & Zhang, K. (2008). Revealing online learning behaviors and activity patterns and making predictions with data mining techniques in online teaching. MERLOT Journal of Online Learning and Teaching, 4(4), 426–437.
Izenman, A. J. (2008). Modern Multivariate Statistical Techniques: regression, classification, and Manifold Learning. Learning. https://doi.org/10.1007/978-0-387-78189-1
Jacsó, P. (2009). Skytrax, Kayak, OAG. ONLINE, 33(2), 50– 53. Retrieved from http://www.jacso.info/PDFs/jacso-skytrax-kayak-oag.pdf
Jagtap, V. S., & Pawar, K. (2013). Analysis of different approaches to Sentence-Level Sentiment Classification. International Journal of Scientific Engineering and Technology, 2(3), 164–170. Retrieved from http://ijset.com/ijset/publication/v2s3/paper11.pdf Jansen, B. J., Zhang, M., Sobel, K., & Chowdury, A. (2009).
Twitter power: Tweets as electronic word of mouth. Journal of the American Society for Information Science and Technology, 60(11), 2169–2188. https://doi.org/10.1002/asi.21149
Kaur, A., & Duhan, N. (2015). A Survey on Sentiment Analysis and Opinion Mining. International Journal of Innovations& Advancement in Computer Science IJIACS, 5(4), 107–116. Retrieved from
http://ojs.academypublisher.com/index.php/jetwi/article /view/11660
Kaur, P., Singhal, A., & Kaur, J. (2016). Spam Detection on Twitter:A Survey. In Proceedings of the 10th INDIACOM - 2016 3rd International Conference on Computing for Sustainable Global Development (pp. 2570–2573). New Delhi: IEEE.
Kayser, V., & Blind, K. (2016). Extending the knowledge base of foresight: The contribution of text mining. Technological Forecasting and Social Change. https://doi.org/10.1016/j.techfore.2016.10.017 Khan, A., Baharudin, B., & Khan, K. (2011). Sentiment
Classification from Online Customer Reviews. In ICSECS (pp. 317–331).
Lacic, E., Kowald, D., & Lex, E. (2016). High Enough ? Explaining and Predicting Traveler Satisfaction Using Airline Reviews. Proceedings of the 27th ACM Conference on Hypertext and Social Media, 249–254. https://doi.org/10.1145/2914586.2914629
Liu, B. (2010). Sentiment Analysis and Subjectivity. Handbook of Natural Language Processing, (1), 1–38. https://doi.org/10.1145/1772690.1772756
Liu, B. (2012). Sentiment Analysis and Opinion Mining, (May), 1–108.
https://doi.org/10.2200/S00416ED1V01Y201204HLT0 16
Luptak, M., Boda, D., & Szucs, G. (2016). Profitability and Capital Structure: An Empirical Study of French and Hungarian Wine Producers in 2004-2013. Business Systems Research Journal, 7(1), 89–103.
https://doi.org/10.1515/bsrj-2016-0007
Medhat, W., Hassan, A., & Korashy, H. (2014). Sentiment analysis algorithms and applications: A survey. Ain Shams Engineering Journal, 5(4), 1093–1113. https://doi.org/10.1016/j.asej.2014.04.011
Misopoulos, F., Mitic, M., Kapoulas, A., & Karapiperis, C. (2014). Uncovering customer service experiences with Twitter: The case of airline industry. Management Decision, 52(4), 705–723. https://doi.org/10.1108/MD-03-2012-0235
Nielsen. (2012). Newswire | Consumer Trust in Online, Social and Mobile Advertising Grows | Nielsen. Retrieved May 4, 2017, from
http://www.nielsen.com/us/en/insights/news/2012/cons umer-trust-in-online-social-and-mobile-advertising-grows.html
OriginLab. (2013). Help Online - Origin Help - Discriminant Analysis. Retrieved May 31, 2017, from
http://www.originlab.com/doc/Origin-Help/Discriminant-Analysis
Pang, B., & Lee, L. (2006). Opinion Mining and Sentiment Analysis. Foundations and Trends® in
InformatioPang, B., & Lee, L. (2006). Opinion Mining and Sentiment Analysis. Foundations and Trends® in Information Retrieval, 1(2), 91–231.
doi:10.1561/1500000001n Retrieval, 1(2), 91–231. https://doi.org/10.1561/1500000001
Pang, B., Lee, L., & Vaithyanathan, S. (2002). Thumbs up?: sentiment classification using machine learning techniques. Proceedings of the Conference on Empirical Methods in Natural Language Processing, 79–86. https://doi.org/10.3115/1118693.1118704 Park, D.-H., Lee, J., & Han, I. (2007). The Effect of On-Line
Consumer Reviews on Consumer Purchasing Intention: The Moderating Role of Involvement. International Journal of Electronic Commerce, 11(4), 125–148. https://doi.org/10.2753/JEC1086-4415110405 Pérezgonzález, J. D., & Gilbey, A. (2011a). Predicting
Skytrax’s Official World Airline Star ratings from customer reviews. Aviation Education and Research Proceedings, 2011, 48–50. Retrieved from
http://yourlastwill.net/
Pérezgonzález, J. D., & Gilbey, A. (2011b). Predicting Skytrax airport rankings from customer reviews. Journal of Airport Management, 5(4), 335–339.
Romero, C., Ventura, S., & García, E. (2008). Data mining in course management systems: Moodle case study and tutorial. Computers and Education, 51(1), 368–384. https://doi.org/10.1016/j.compedu.2007.05.016 Rui, H., Liu, Y., & Whinston, A. (2013). Whose and what
chatter matters? the effect of tweets on movie sales. Decision Support Systems, 55(4), 863–870. https://doi.org/10.1016/j.dss.2012.12.022
Safko, L., & Brake, D. K. (2012). The Social Media Bible: Tactics, Tools, and Strategies for Business Success. Popular Science.
https://doi.org/10.1097/01.ASW.0000399652.66748.d4 Saha, G. C., & Theingi. (2009). Service quality, satisfaction,
and behavioural intentions. Managing Service Quality: An International Journal, 19(3), 350–372.
https://doi.org/10.1108/09604520910955348
Salehan, M., & Kim, D. J. (2016). Predicting the performance of online consumer reviews: A sentiment mining approach to big data analytics. Decision Support Systems, 81, 30–40.
https://doi.org/10.1016/j.dss.2015.10.006
Semantria. (2013). Semantria | About Semantria’s Sentiment Analysi... Retrieved May 22, 2017, from
http://support.semantria.com/customer/portal/articles/8 34168-about-semantria-s-sentiment-analysis
http://support.semantria.com/customer/portal/articles/9 95931-sentiment-score-color-shading-breakdown Serrano-Guerrero, J., Olivas, J. A., Romero, F. P., &
Herrera-Viedma, E. (2015). Sentiment analysis: A review and comparative analysis of web services. Information Sciences, 311, 18–38.
https://doi.org/10.1016/j.ins.2015.03.040 Skytrax. (2016a). Verified Airline and Airport Reviews |
SKYTRAX. Retrieved May 29, 2017, from http://www.airlinequality.com/verified-reviews/ Skytrax. (2016b). World Airline Rating | SKYTRAX.
Retrieved May 21, 2017, from
http://www.airlinequality.com/ratings/skytrax-airline-ratings/
Skytrax. (2017). Airlines Rewview Scores. Retrieved from http://www.airlinequality.com/
Tetlock, P. C. (2007). Giving content to investor sentiment: The role of media in the stock market. Journal of Finance, 62(3), 1139–1168.
https://doi.org/10.1111/j.1540-6261.2007.01232.x Trochim, W. M. K., Donnelly, J. P., & Arora, K. (2016). Research methods : the essential knowledge base. Cengage Learning.
van den Berg, S., & van der Kolk, H. (2014). Data Collection and Scale Development. London: SAGE Publications Ltd.
Vohra, M., & Teraiya, J. (2013). A Comparative Study of Sentiment Analysis Techniques. Ejournal.Aessangli.in, 313–317. Retrieved from
http://www.ejournal.aessangli.in/ASEEJournals/CE63. pdf
Wan, Y., & Gao, Q. (2016). An Ensemble Sentiment Classification System of Twitter Data for Airline Services Analysis. Proceedings - 15th IEEE International Conference on Data Mining Workshop, ICDMW 2015, 1318–1325.
https://doi.org/10.1109/ICDMW.2015.7
Wanner, F., Rohrdantz, C., Mansmann, F., Oelke, D., & Keim, D. A. (2009). Visual sentiment analysis of RSS news feeds featuring the US presidential election in 2008. In CEUR Workshop Proceedings (Vol. 443). Wijnhoven, F., & Bloemen, O. (2014). External validity of
sentiment mining reports: Can current methods identify demographic biases, event biases, and manipulation of reviews? Decision Support Systems, 59(1), 262–273. https://doi.org/10.1016/j.dss.2013.12.005
Yakut, I., Turkoglu, T., & Yakut, F. (2015). Understanding Customer’s Evaluations Through Mining Airline Reviews. International Journal of Data Mining & Knowledge Management Process, 5(6), 1143–1148. https://doi.org/10.5121/ijdkp.2015.5601
Yee Liau, B., & Pei Tan, P. (2014). Gaining customer knowledge in low cost airlines through text mining. Industrial Management & Data Systems, 114(9), 1344– 1359. https://doi.org/10.1108/IMDS-07-2014-0225 Zaiontz, C. (2014). Box’s M Test Basic Concepts | Real
Statistics Using Excel. Retrieved June 20, 2017, from