S O F T W A R E
Open Access
Validation of T1 and T2 algorithms for
quantitative MRI: performance by a
vendor-independent software
Sebastian Bidhult
1,2, George Kantasis
1,3, Anthony H. Aletras
1,3, Håkan Arheden
1, Einar Heiberg
1,2and Erik Hedström
1,4*Abstract
Background:Determination of the relaxation time constants T1 and T2 with quantitative magnetic resonance imaging is increasingly used for both research and clinical practice. Recently, groups have been formed within the Society of Cardiovascular Magnetic Resonance to address issues with relaxometry. However, so far they have avoided specific recommendations on methodology due to lack of consensus and current evolving research. Standardised widely available software may simplify this process.
The purpose of the current study was to develop and validate vendor-independent T1 and T2 mapping modules and implement those in the versatile and widespread software Segment, freely available for research and FDA approved for clinical applications.
Results:The T1 and T2 mapping modules were developed and validated in phantoms at 1.5 T and 3 T with reference standard values calculated from reference pulse sequences using the Nelder-Mead Simplex optimisation method. The proposed modules support current commonly available MRI pulse sequences and both 2- and 3-parameter curve fitting. Images acquired in patients using three major vendors showed vendor-independence. Bias and variability showed high agreement with T1 and T2 reference standards for T1 (range 214–1752 ms) and T2 (range 45–338 ms), respectively.
Conclusions:The developed and validated T1 and T2 mapping and quantification modules generated relaxation maps from current commonly used MRI sequences and multiple signal models. Patient applications showed usability for three major vendors.
Keywords:T1, T2, Mapping, Quantitative magnetic resonance imaging
Background
Quantitative magnetic resonance imaging (MRI) is increas-ingly used for several different applications in both research and clinical practice. For cardiac MRI, T1 quantification enables measurement of myocardial extracellular volume [1–3], whereas T2 mapping detects oedema in acute myo-cardial infarction [4]. The Society of Cardiovascular Mag-netic Resonance (SCMR) has also recently formed groups and provides general recommendations on use of mapping
for research and clinical applications [5, 6]. However, spe-cific recommendations have been avoided so far due to lack of consensus and current evolving research [6]. The Society is thus awaiting this field to develop so that guidelines can be properly formulated. Standardised software may simplify and speed up this process.
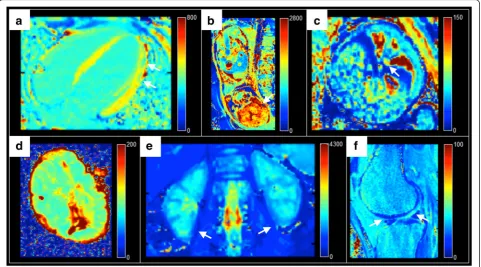
Further, cancer imaging has benefited from T1 to T2 mapping for determining early tumour progression in brain [7], and provides improved discrimination between benign and malign findings in suspected prostate cancer [8]. Also, oxygen saturation in blood has been accurately measured noninvasively by T2 mapping in children with complex congenital heart disease, yielding an opportunity * Correspondence:[email protected]
1
Department of Clinical Sciences Lund, Clinical Physiology, Lund University, Skane University Hospital, Lund, Sweden
4Department of Clinical Sciences Lund, Diagnostic Radiology, Lund
University, Skane University Hospital, Lund, Sweden
Full list of author information is available at the end of the article
to potentially avoid cardiac catheterisation for follow-up studies in children [9].
Different numerical algorithms can be used to com-pute T1 and T2 relaxation maps and therefore inline map generation may vary between MRI vendors. Also, most inline systems do not present the curve fit, which, if visualised, can be used as a marker of accuracy. More-over, the algorithms used are not openly documented. A previous open-source software overcame these limita-tions, but is only to be used for research [10]. Last but not least, current available software is generally limited in signal models and fitting options.
The purpose of this study was to develop, validate and openly document T1 and T2 relaxation map modules
with multiple signal models, test those in images ac-quired using three major vendors, and implement the validated modules in freely available software for research [11].
Implementation
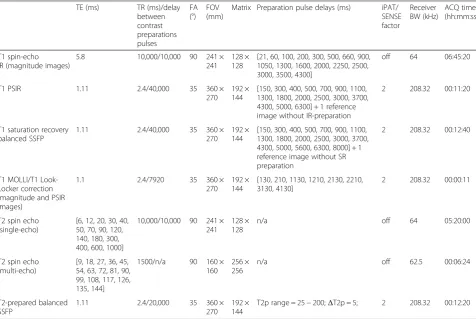
The T1 and T2 mapping modules were developed and validated in phantoms with reference standard T1 and T2 values calculated from reference spin echo (SE) pulse sequences using the Nelder-Mead Simplex optimisation method available in Matlab (Math Works, Natick, MA; 2014a). The proposed modules support current com-monly available MRI pulse sequences and both 2- and 3-parameter curve fitting (Table 1).
Table 1Supported sequences and signal fitting models
Supported signal models
Supported sequences 3-parameter fit model 2-parameter fit model
T1 spin-echo IR (magnitude images) S(t) = |A (1−B exp(−t/T1))| S(t) = |A (1−2 exp(−t/T1))|
T1 PSIR S(t) = A (1−B exp(−t/T1)) S(t) = A (1−2 exp(−t/T1))
T1 saturation recovery balanced SSFP S(t) = A (1−B exp(−t/T1)) S(t) = A (1−exp(−t/T1))
T1 MOLLI/T1 Look-Locker correction (magnitude images) S(t) = |A (1−B exp(−t/T1*))|; T1 = T1* (B−1) n/a
T1 MOLLI/T1 Look-Locker correction (PSIR images) S(t) = A (1−B exp(−t/T1*)); T1 = T1* (B−1) n/a
T2 spin echo (multi-echo and single-echo) S(t) = A exp(−t/T2) + B; B > 0 S(t) = A exp(−t/T2)
T2-prepared balanced SSFP S(t) = A exp(−t/T2) + B; B > 0 S(t) = A exp(−t/T2)
IRinversion recovery,PSIRphase sensitive inversion recovery,MOLLImodified Look-Locker inversion recovery,SSFPsteady-state free precession
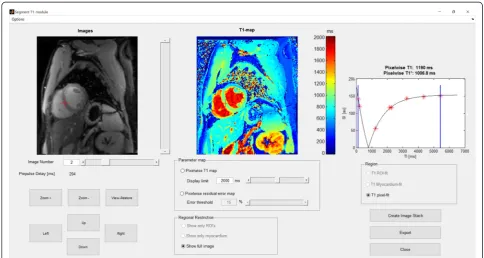
The T1 mapping module graphical user interface is shown in Fig. 1 (the T2 mapping module shares the design). Both ROI-based global mean mapping and pixel-wise mapping for the whole image and ROI-based are available. Further, the residuals of the curve fit for both T1 and T2 mapping can be visualised, indicating areas within the image that have a higher deviation from the curve and thus less accurate T1 and T2 values.
The validated modules were finally implemented in the software Segment, freely available for research (http://www.medviso.com) [11].
Since Segment already includes a validated module for T2* mapping and quantification [12], this topic was not covered in the current study.
Phantom setup and imaging
A Eurospin (Diagnostic Sonar, Livingston, UK) phantom encompassing 12 gadolinium/agarose gel phantoms was used for validation of the proposed modules. The phan-toms were scanned at both 1.5 T and 3 T (Siemens Aera and Prisma, Erlangen, Germany). Single-echo spin-echo sequences were used for acquiring the reference T1 and T2 values. Pulse sequence parameters are presented in
Table 2. The magnetization was allowed to fully recover between spin radiofrequency excitations.
Commonly available T1 and T2 mapping sequences were used to acquire images of the phantom, and the proposed modules were applied to generate T1 and T2 relaxation constant maps. The sequences were based on a free-breathing single-shot balanced steady-state free precession (bSSFP) sequence.
T1 mapping
Pixelwise T1 estimates were initialized using a lookup-table search performed in two steps in a T1 interval of 0–4000 ms. First, a step of 50 ms between lookup-table entries was applied for high perform-ance. Thereafter, to find the optimal value, a second search was performed using a 5 ms difference be-tween lookup-table entries within 100 ms of the entry found in the first step. In these two steps, depending on the pulse sequence, ideal inversion/saturation effi-ciency was assumed and each pixel was normalized with the maximum absolute value within its time-series. The T1 lookup-table entry resulting in the minimum sum of absolute error was chosen as the initial T1 value.
Table 2Typical MRI sequence parameters
TE (ms) TR (ms)/delay between contrast preparations pulses FA (°) FOV (mm)
Matrix Preparation pulse delays (ms) iPAT/ SENSE factor Receiver BW (kHz) ACQ time (hh:mm:ss) T1 spin-echo IR (magnitude images)
5.8 10,000/10,000 90 241 × 241
128 × 128
[21, 60, 100, 200, 300, 500, 660, 900, 1050, 1300, 1600, 2000, 2250, 2500, 3000, 3500, 4300]
off 64 06:45:20
T1 PSIR 1.11 2.4/40,000 35 360 ×
270 192 × 144
[150, 300, 400, 500, 700, 900, 1100, 1300, 1800, 2000, 2500, 3000, 3700, 4300, 5000, 6300] + 1 reference image without IR-preparation
2 208.32 00:11:20
T1 saturation recovery balanced SSFP
1.11 2.4/40,000 35 360 × 270
192 × 144
[150, 300, 400, 500, 700, 900, 1100, 1300, 1800, 2000, 2500, 3000, 3700, 4300, 5000, 5600, 6300, 8000] + 1 reference image without SR preparation
2 208.32 00:12:40
T1 MOLLI/T1 Look-Locker correction (magnitude and PSIR images)
1.1 2.4/7920 35 360 ×
270 192 × 144
[130, 210, 1130, 1210, 2130, 2210, 3130, 4130]
2 208.32 00:00:11
T2 spin echo (single-echo)
[6, 12, 20, 30, 40, 50, 70, 90, 120, 140, 180, 300, 400, 600, 1000]
10,000/10,000 90 241 × 241
128 × 128
n/a off 64 05:20:00
T2 spin echo (multi-echo)
[9, 18, 27, 36, 45, 54, 63, 72, 81, 90, 99, 108, 117, 126, 135, 144]
1500/n/a 90 160 × 160
256 × 256
n/a off 62.5 00:06:24
T2-prepared balanced SSFP
1.11 2.4/20,000 35 360 × 270
192 × 144
T2p range = 25−200;ΔT2p = 5; 2 208.32 00:12:20
Following T1 initialization, pixel T1 values were refined using a C implementation of the Nelder-Mead Simplex nonlinear optimisation algorithm [13]. Convergence was assumed when the maximum T1 absolute difference be-tween two simplexes was less than 0.10 ms. The C imple-mentation was performed to reduce computation times and was thus not used for calculating the ROI-based glo-bal mean where instead the pre-implemented Matlab fminsearch method [14] was sufficient.
For T1 reference values, an inversion recovery (IR) single-echo spin echo sequence was used with a short echo time and long repetition time (Table 2). Two varia-tions of the free-breathing bSSFP sequence were used for T1 mapping; one based on SR and one based on IR preparation pulses respectively applied before imaging readout. At 1.5 T, T1 was also estimated using a breath-hold MOLLI sequence with pre- and post-contrast car-diac configurations (5(3b)3 and 4(1b)3(1b)2) for analysis of phantoms with T1 > 600 ms and T1 < 600 ms, respect-ively. Since the MOLLI acquisition alters the recovery curve in itself, inducing T1* measurements, the Look-Locker correction from T1* to T1 was performed (Table 1), as previously proposed [15]. Magnitude images were used to estimate T1 from spin echo, SR-bSSFP and MOLLI sequences. For IR-bSSFP, the phase and magni-tude images were extracted in order to reconstruct phase-sensitive inversion recovery (PSIR) images, as pre-viously proposed [16].
T2 mapping
The initial T2 estimate was initialized by a weighted 2-parameter linear regression of the signal logarithm [17]. The estimation was repeated for stepwise truncation of the maximum echo time until three data points remained. The T2 estimate resulting in the minimum sum of absolute error over all data points was chosen as the initial T2 estimate.
Following the T2 initialisation, all pixels with T2 values outside the interval 0 < T2 < 400 ms were excluded from further analysis and the final T2 estimate was refined using the above-mentioned nonlinear optimisation algo-rithm. Convergence was assumed when the maximum T2 absolute difference between two simplexes was less than 0.10 ms. Pixels that were not refined with nonlinear optimization were set to 0 in the resulting T2 map.
For T2 reference values, a single-echo spin echo sequence was used. The free-breathing bSSFP se-quence used T2 preparation pulses for T2 mapping. An SR-prepared image with a short saturation time was used for the T2 calculation in order to improve the 3-parameter curve fit [18]. Magnitude images were used to estimate T2 from both spin echo and bSSFP sequences.
Residual calculation for T1 and T2 mapping
Curve-fit residuals for T1 and T2 mapping were calcu-lated as the average absolute difference between the fit-ted curve and corresponding pixel values. Residuals were normalised relative to the maximum absolute pixel value within its time-series and reported as a percentage.
Application on human MR images
The developed and validated T1 and T2 mapping mod-ules were applied on images acquired from three major vendors. Standard available sequences were used on Sie-mens (1.5 T Aera and 3 T Prisma, Erlangen, Germany) with 60-channel phased array coils and a 20-channel head coil; Philips (1.5 T Achieva, Best, the Netherlands) with 32-channel phased array coils; and on GE (3 T Dis-covery 750w, General Electrics, USA) with a GEM flex medium array coil. The local ethics committee approved the research protocol and all subjects provided written consent.
Table 3Computational times for pixel-wise mapping in the complete image and in a selected ROI, respectively
Pixel-wise (complete image) Pixel-wise (ROI only)
T1 spin-echo IR (magnitude images) 2.5 s (3 parameters, 17 images, 128 × 128 images, 13 435 refined pixels)
0.03 s (3 parameters, 17 images, 200 pixels, 152 refined pixels)
T1 PSIR 11.7 s (3 parameters, 17 images, 192 × 144 matrix, 26 597 refined pixels)
0.15 s (3 parameters, 17 images, 200 pixels, 200 refined pixels)
T1 saturation recovery balanced SSFP 11.2 s (3 parameters, 15 images, 192 × 144 matrix, 26 594 refined pixels)
0.09 s (3 parameters, 15 images, 202 pixels, 202 refined pixels)
T1 MOLLI/T1 Look-Locker correction (magnitude and PSIR images)
6.4 s (3 parameters, 9 images, 192 × 144 matrix, 25 128 refined pixels)
0.05 s (3 parameters, 9 images, 202 pixels, 198 refined pixels)
T2 spin echo (single-echo and multi-echo) 1.12 s (2 parameters, 15 images, 128 × 128 matrix, 9 175 refined pixels)
0.04 s (2 parameters, 15 images, 207 pixels, 160 refined pixels)
T2-prepared balanced SSFP 11.7 s (3 parameters, 37 images, 192 × 144 matrix, 16 322 refined pixels)
0.14 s (3 parameters, 37 images, 207 pixels, 184 refined pixels)
The ROI-based global mean fitting takes less than 2 s for all sequences and is not listed. Performance was tested at a 2.4 GHz, 8 GB RAM, SSD HDD standard lap-top running the MS Windows 7 64-bit operating system
Statistics
Bias and variability were determined using the modified Bland-Altman analysis. The bias and variability percent-ages were computed as the difference between the pro-posed method and the reference standard divided with the reference standard values. Values were expressed as mean ± SD and 95 % limits of agreement.
Results
Computational times were generally fast independent of amount of information, i.e. for both full image and ROI-based calculations (Table 3).
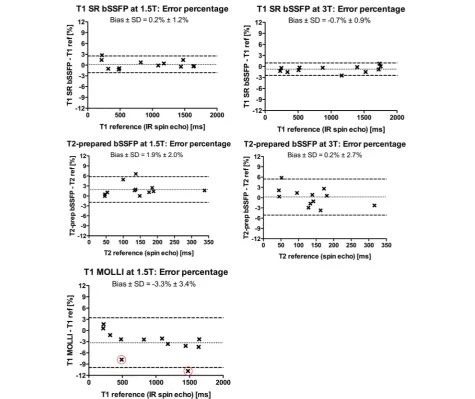
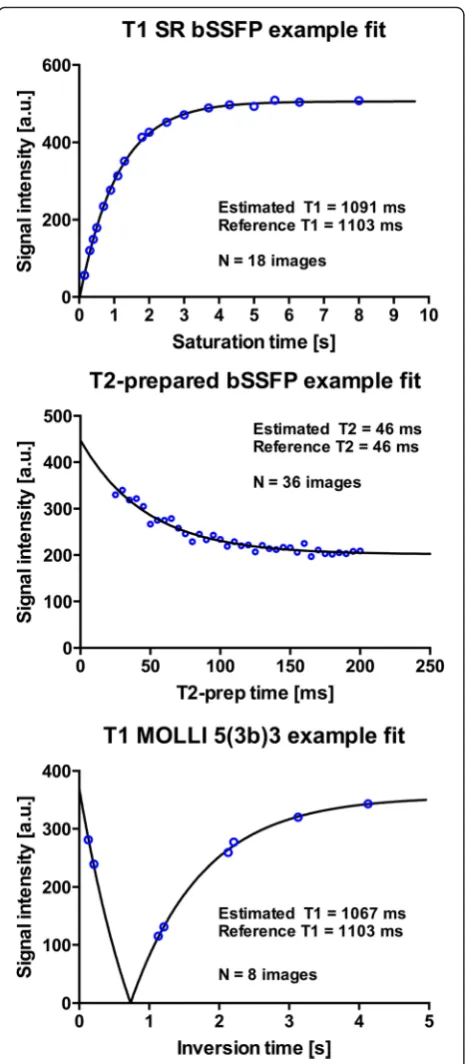
The T1 and T2 reference values ranged from 214 to 1643 ms and 46–338 ms for 1.5 T, and 229–1752 ms and 45–316 ms for 3 T, respectively. Phantom validation
results are shown for 1.5 T and 3 T (Fig. 2) and corre-sponding curve fit examples at 1.5 T (Fig. 3). The T1 bias and variability at 1.5 T were 0.8 ± 8 ms (0.2 ± 1.2 %) for SR-bSSFP using the 3-parameter fit, and 24 ± 9 ms (3.5 ± 2.3 %) using the 2-parameter fit. Corresponding bias and variability for PSIR-bSSFP at 1.5 T were 3.2 ± 3.8 ms (0.6 ± 1.0 %) and −31 ± 26 ms (−3.5 ± 2.1 %). For cardiac MOLLI at 1.5 T the bias and variability was−39 ± 45 ms (−3.3 ± 3.4 %). The higher variability for MOLLI was related to low T2, with errors above 5 % originating from phantoms with reference T2 values < 60 ms.
The T1 bias and variability at 3 T were for SR-bSSFP− 6 ± 11 ms (−0.7 ± 0.9 %) when applying a 3-parameter fit, whereas a 2-parameter fit yielded 22 ± 13 ms (2.8 ± 1.6 %). Corresponding bias and variability for
bSSFP at 3 T were −9 ± 13 ms (−1.1 ± 1.0 %) and −36 ± 33 ms (−3.3 ± 2.1 %).
The T2 bias and variability were 2.8 ± 2.7 ms (1.9 ± 2.0 %) at 1.5 T and −0.7 ± 3.6 ms (0.2 ± 2.7 %) at 3 T using the 3-parameter fit.
Figure 4 shows T1 and T2 maps from human applica-tions for three major vendors.
Discussion
The developed and validated T1 and T2 mapping mod-ules generated maps from commonly used MRI se-quences and multiple signal models. Generally low bias and variability were found compared with reference standard measurements in phantoms. Patient applica-tions showed usability for three major vendors. The main software is freely available for research and well documented.
The proposed algorithms showed particularly good agreement with the reference standard for saturation re-covery sequences. However, T1 was underestimated by MOLLI when also phantoms with low T2 values (<60 ms) were included. This is similar to previously published data showing T2 sensitivity for MOLLI T1 mapping, with approximately 5 % error in T1 values for T2 below 30 ms [19]. This underestimation may be cor-rected for by using recently proposed lookup-table methods [20]. Another explanation for the increased variability using MOLLI compared to saturation recov-ery may be the reduced number of sampling points used for MOLLI in this study.
The slightly higher, albeit not large, variability shown for the T2 prepared sequence may be explained by lim-ited signal-to-noise ratio. The T2 prepared mapping may be improved by acquiring several data points (echoes), especially late TE images since an offset is known to occur. Another solution is to acquire fewer echoes and instead add a saturation recovery acquisition, as per-formed in the current study [18]. This solution only adds a single heartbeat to the acquisition time (approximately 1 s) and is therefore applicable in most patients. Prefera-bly, more than 1 saturation recovery acquisition should be added for averaging. This number may on the other hand need to be optimised in the individual case, espe-cially in cardiac disease where the patient may have diffi-culties extending the duration of the breath hold.
The proposed software modules include both 2- and 3-parameter T1 and T2 fitting. In theory, a reduced number of parameters should result in reduced random errors (i.e. reduced variability) while however also lead-ing to a risk of introduclead-ing a bias due to increased sensi-tivity to measurement imperfections. In cardiac MRI, 3-parameter T1 curve fitting is commonly applied to re-duce bias associated with imperfect preparation-pulse ef-ficiency and/or effects from applied readout pulses [21, 22]. The 3-parameter curve fit has also been suggested for cardiac T2 mapping when using the T2-prepared bSSFP sequence [18]. Unbiased 2-parameter fitting for cardiac T1 mapping has recently been proposed [23], which may lead to an increased need for software Fig. 3Example curve fits for T1 and T2 at 1.5 T in two phantoms.
supporting 2-parameter T1 mapping in the near future. Clinical validation was not performed as part of the current study, as it is important to first validate algo-rithms that are to be applied in future in vivo studies. Fi-nally, albeit data from three major vendors were tested, other vendors may use other sequences or reporting of data for fitting, and future studies may benefit from in-cluding additional vendors.
Limitations
In the current modules neither rigid nor non-rigid regis-tration has been implemented. These methods may in some cases improve the diagnostic quality and are sub-ject to future improvements and investigations and will be included in future updates of the modules. Further, some MRI vendors use private dicom headers for data needed for T1 and T2 mapping. These headers may change between MRI vendor software updates. Current known private dicom headers have been implemented in the proposed modules and future updates aim to cover these changes.
Conclusions
The developed and validated T1 and T2 mapping mod-ules generated relaxation maps from current commonly
used MRI sequences and multiple signal models. Patient applications showed usability for three major vendors. The main software is freely available for research and well documented.
Abbreviations
bSSFP, balanced steady-state free precession; IR, inversion recovery; MOLLI, modified Look-Locker inversion recovery; MRI, magnetic resonance imaging; PSIR, phase-sensitive inversion recovery; SCMR, society of cardiovascular mag-netic resonance; SE, spin echo; SR, saturation recovery.
Acknowledgements
We gratefully acknowledge Medical MR physicist Christian Gustafsson, Department of Radiation Physics, Lund University, for assistance acquiring mapping data on the GE scanner.
Funding
Funding was received from: Swedish Research Council (621-2012-4944), Swedish Heart and Lung Foundation, Region of Skåne, Skåne University Hospital in Lund, and as an Excellence Grant from the Greek General Secretariat for Research and Technology.
Availability of data and materials
AB, Lund, Sweden. Individuals or organisations are not allowed to compile software products derived from Segment that are to be sold commercially or shipped together with other commercial products without the express written permission of Medviso AB.
Phantom data sets and anonymous subject data sets can be made available on request.
Authors’contributions
SB performed most of the programming, made substantial contributions to conception and design, acquired, analysed and interpreted data and drafted the manuscript. GK made substantial contributions to conception and design, acquired data, and revised the manuscript for important intellectual content. AHA made substantial contributions to conception and design, provided MR physics expertise for validation experiments, and revised the manuscript for important intellectual content. HA and EiH made substantial contributions to conception and design, and revised the manuscript for important intellectual content. ErH made substantial contributions to conception and design, acquired, analysed and interpreted data, and drafted the manuscript. All authors read and approved the final manuscript.
Competing interests
The authors declare that they have no competing interests, with the following exception. Dr. Einar Heiberg founded the company Medviso AB, Lund, Sweden, and is the major shareholder of said company, selling the FDA-approved software version of Segment for commercial use.
Consent for publication
Consent to publish individual images was signed as part of ethical written consent.
Ethics approval and consent to participate
The Lund Regional ethics committee approved the study and all subjects provided written consent.
Author details 1
Department of Clinical Sciences Lund, Clinical Physiology, Lund University, Skane University Hospital, Lund, Sweden.2Department of Biomedical
Engineering, Faculty of Engineering, Lund University, Lund, Sweden.
3Laboratory of Medical Informatics, School of Medicine, Aristotle University of
Thessaloniki, Thessaloniki, Greece.4Department of Clinical Sciences Lund, Diagnostic Radiology, Lund University, Skane University Hospital, Lund, Sweden.
Received: 16 December 2015 Accepted: 28 July 2016
References
1. Arheden H, Saeed M, Higgins CB, Gao DW, Bremerich J, Wyttenbach R, et al. Measurement of the distribution volume of gadopentetate dimeglumine at echo-planar MR imaging to quantify myocardial infarction: comparison with 99mTc-DTPA autoradiography in rats. Radiology. 1999;211:698–708. 2. Ugander M, Oki AJ, Hsu LY, Kellman P, Greiser A, Aletras AH, et al.
Extracellular volume imaging by magnetic resonance imaging provides insights into overt and sub-clinical myocardial pathology. Eur Heart J. 2012; 33:1268–78.
3. Kellman P, Hansen MS. T1-mapping in the heart: accuracy and precision. J Cardiovasc Magn Reson. 2014;16:1–20.
4. Ugander M, Bagi PS, Oki AJ, Chen B, Hsu LY, Aletras AH, et al. Myocardial Edema as Detected by Pre-Contrast T1 and T2 CMR Delineates Area at Risk Associated With Acute Myocardial Infarction. JCMG Elsevier Inc.
2012;5:596–603.
5. Moon JC, Messroghli DR, Kellman P, Piechnik SK, Robson MD, Ugander M, et al. Myocardial T1 mapping and extracellular volume quantification: a Society for Cardiovascular Magnetic Resonance (SCMR) and CMR Working Group of the European Society of Cardiology consensus statement. J Cardiovasc Magn Reson. 2013;15:1.
6. Schulz-Menger J, Bluemke DA, Bremerich J, Flamm SD, Fogel MA, Friedrich MG, et al. Standardized image interpretation and post processing in cardiovascular magnetic resonance: Society for Cardiovascular Magnetic Resonance (SCMR) Board of Trustees Task Force on Standardized Post Processing. J Cardiovasc Magn Reson. 2013;15:1.
7. Lescher S, Jurcoane A, Veit A, Bähr O, Deichmann R, Hattingen E. Quantitative T1 and T2 mapping in recurrent glioblastomas under bevacizumab: earlier detection of tumor progression compared to conventional MRI. Neuroradiology. 2014;57:11–20.
8. Yamauchi FI, Penzkofer T, Fedorov A, Fennessy FM, Chu R, Maier SE, et al. Prostate cancer discrimination in the peripheral zone with a reduced field-of-view T2-mapping MRI sequence. Magn Reson Imaging Elsevier Inc. 2015; 33:525–30.
9. Nield LE, Qi X-LL, Valsangiacomo ER, Macgowan CK, Wright GA, Hornberger LK, et al. In vivo MRI measurement of blood oxygen saturation in children with congenital heart disease. Pediatr Radiol. 2005;35:179–85.
10. Messroghli DR, Rudolph A, Abdel-Aty H, Wassmuth R, Kühne T, Dietz R, et al. An open-source software tool for the generation of relaxation time maps in magnetic resonance imaging. BMC Med Imaging BioMed Central Ltd. 2010;10:16–8.
11. Heiberg E, Sjögren J, Ugander M, Carlsson M, Engblom H, Arheden H. Design and validation of Segment—freely available software for cardiovascular image analysis. BMC Med Imaging BioMed Central Ltd. 2010;10:1.
12. Bidhult SL, Xanthis CG, Liljekvist LL, Greil GF, Nagel E, Aletras AH, et al. A new validated T2* analysis method with certainty estimates for cardiac and liver iron load determination. J Cardiovasc Magn Reson BioMed Central Ltd. 2015;17:P52.
13. Nelder JA, Mead R. A Simplex Method for Function Minimization. Comput J Oxford University Press. 1965;7:308–13.
14. Lagarias JC, Reeds JA, Wright MH, Wright PE. Convergence properties of the Nelder–Mead simplex method in low dimensions. SIAM J Optim. 1998;9: 112–47.
15. Deichmann R, Haase A. Quantification of T 1 values by SNAPSHOT-FLASH NMR imaging. J Magn Reson (1969). 1992;96:608–12.
16. Xue H, Greiser A, Zuehlsdorff S, Jolly M-P, Guehring J, Arai AE, et al. Phase-sensitive inversion recovery for myocardial T1 mapping with motion correction and parametric fitting. Magn Reson Med Wiley Subscription Services, Inc, A Wiley Company. 2013;69:1408–20.
17. Bonny JM, Zanca M, Boire JY, Veyre A. T2 maximum likelihood estimation from multiple spin-echo magnitude images. Magn Reson Med. 1996;36:287–93.
18. Akçakaya M, Basha TA, Weingärtner S, Roujol S, Berg S, Nezafat R. Improved quantitative myocardial T 2mapping: Impact of the fitting model. Magn Reson Med. 2014;74:93–105.
19. Gai ND, Stehning C, Nacif M, Bluemke DA. Modified Look-Locker T1 evaluation using Bloch simulations: human and phantom validation. Magn Reson Med Wiley Subscription Services, Inc, A Wiley Company. 2013;69:329–36. 20. Xanthis CG, Bidhult S, Kantasis G, Heiberg E, Arheden H, Aletras AH. Parallel
simulations for QUAntifying RElaxation magnetic resonance constants (SQUAREMR): an example towards accurate MOLLI T1 measurements. J Cardiovasc Magn Reson. 2015;17:104.
21. Messroghli DR, Radjenovic A, Kozerke S, Higgins DM, Sivananthan MU, Ridgway JP. Modified Look-Locker inversion recovery (MOLLI) for high-resolutionT1 mapping of the heart. Magn Reson Med. 2004;52:141–6. 22. Chow K, Flewitt JA, Green JD, Pagano JJ, Friedrich MG, Thompson RB.
Saturation recovery single-shot acquisition (SASHA) for myocardial T1mapping. Magn Reson Med. 2013;71:2082–95.