R E S E A R C H A R T I C L E
Open Access
Trajectories of the relationships of physical
activity with body composition changes in
older men: the MrOS study
Deepika R. Laddu
1*, Peggy M. Cawthon
2,3, Neeta Parimi
2, Andrew R. Hoffman
4, Eric Orwoll
5, Iva Miljkovic
6,
Marcia L. Stefanick
7and for the Osteoporotic Fractures in Men Study Research Group
Abstract
Background:Excess adiposity gains and significant lean mass loss may be risk factors for chronic disease in old age. Long-term patterns of change in physical activity (PA) and their influence on body composition decline during aging has not been characterized. We evaluated the interrelationships of PA and body composition at the outset and over longitudinal follow-up to changes in older men.
Methods:Self-reported PA by the Physical Activity Scale for the Elderly (PASE), clinic body weight, and whole-body lean mass (LM) and fat mass, by dual-energy x-ray absorptiometry (DXA), were assessed in 5964 community-dwelling men aged≥65 years at baseline (2000–2002) and at two subsequent clinic visits up until March 2009 (an average 4.6 and 6.9 years later). Group-based trajectory modeling (GBTM) identified patterns of change in PA and body composition variables. Relationships of PA and body composition changes were then assessed.
Results:GBTM identified three discrete trajectory patterns, all with declining PA, associated primarily with initial PA levelshigh-activity (7.2% of men), moderate-activity (50.0%), and low-activity (42.8%). In separate models, GBTM identified eight discrete total weight change groups, five fat mass change groups, and six LM change groups. Joint trajectory modeling by PA and body composition group illustrated significant declines in total weight and LM, whereas fat mass levels were relatively unchanged among high-activity and low-activity-declining groups, and significantly increased in the moderate-activity-declining group.
Conclusion:Although patterns of change in PA and body composition were identified, groups were primarily differentiated by initial PA or body composition rather than by distinct trajectories of change in these variables.
Keywords:Physical activity, Lean mass, Fat mass, Older men, Trajectories
Background
Significant weight loss, particularly substantial lean mass loss [1], and fat mass gain have been identified as risk factors for chronic diseases in aging men [1–4]. Muscle mass has been reported to decline 1–3% per decade in men starting by age 30 and 2–3.3% per decade after age 60 [3, 5]. Progressive skeletal muscle loss accompanied by reduced muscle strength and declining functional performance [4, 6, 7], referred to as sarcopenia [6], leads
to frailty and physical and mobility disabilities. Concomi-tant gains in fat mass also contribute to the reduced phys-ical function and quality of life. [8].
Participation in regular physical activity (PA) has been shown to promote favorable changes in body composition, including prevention of lean mass loss and reduced fat mass gain [9–12]. Yet, PA generally decreases with age and only 37.8% of men aged 65–74 years report participat-ing in the recommended minimum of 30 minutesmin of moderate-intensity physical activity on 5 or more days per week [13, 14]. The relationship of declining PA to lean mass loss or inability to retain lean mass may play an * Correspondence:[email protected]
1Department of Physical Therapy, University of Illinois at Chicago, Chicago,
Illinois 60612, USA
Full list of author information is available at the end of the article
important role in the functional limitations that arise with aging.
Epidemiological evidence supports the hypothesis that higher regular PA and/or increasing PA levels at-tenuate total and fat weight gain through middle age [15, 16]. Substantial literature also suggests that age-related changes in body composition precede the gradual decline in PA as men age [1, 11, 17]. We are unaware of an assessment of both PA and body-composition changes or trajectories of these changes over an extended period in older men.
The long-term follow-up of the Osteoporotic Fractures in Men Study (MrOS) cohort provided the opportunity to apply innovative, methodological advances in the study of developmental trajectories [18, 19] to assess patterns of change in PA behavior during aging, taking into consideration baseline (routine) PA. Using a finite mixture modeling strategy to classify distinctive groups of older men based on similarities between their baseline and changes in PA, we estimated the proportion of men who demonstrated distinct patterns of PA change over an average 6.9 year follow-up. By relating the probability of group membership to individual’s PA, we can evaluate how PA changes may relate to changes in body compos-ition (i.e., fat and lean masses) patterns as older men age. Finally, we applied joint (dual) trajectory models to analyze the correlation between the PA and body compos-ition trajectories that were evolving contemporaneously as men aged, and to describe the development of the PA-body composition relationship over time. Additionally, multi-trajectory models, which were used to illustrate dis-tinct patterns in the joint trajectories of PA and body composition, provides a compact approach for summariz-ing the within-individual correspondence of longitudinal data of PA and body composition measurements which other methods are unable to capture.
Methods
Participants
From March 2000 through April 2002, 5994 men, aged 65 years and older, enrolled in and completed baseline assessments in the multicenter MrOS study [20]. Recruit-ment was primarily through community-based mailing lists to six-geographic regions in the United States: Birmingham, AL; Minneapolis, MN; Palo Alto, CA; Pitts-burgh, PA; Portland, OR; and San Diego, CA [20, 21]. Exclusions included bilateral hip replacement or inability to walk without the assistance of another person. A sec-ond and third clinic visit (V2 and V3) were csec-onducted an average of 4.6 years and 6.9 years after baseline, respect-ively. Men who died or terminated were included in the trajectory building as long as they contributed at least one visit with PASE data before death or termination. For ex-ample, if they contributed PASE data at V1 and V2 and
died after V 2, then their V1 and V2 values contributed to the trajectory model. Thus, this report of trajectory models was restricted to 5964 men who provided self-report data for physical activity (PA) by the Physical Activ-ity Scale for the Elderly (PASE) and had a DXA measure-ment at one or both follow-up visits (Additional file 1: Figure S1). However, in models reporting absolute change in body composition trajectories relative to PA trajector-ies, men with loss to follow up due to deaths, termination or missing values were excluded from analyses. Thus, in absolute change models, only men who retuned for visit 3 and had non missing values for the body composition and PASE score were included change analyses.The total sam-ple of men with visit 1 and visit 3 non missing measures of body weight: n = 3894, lean mass: n = 3641, and fat mass: n = 3641. The institutional review board at each center approved the study protocol and written informed consent was obtained from all participants.
Physical activity measurements
PASE [22], developed specifically for community-dwelling older adults, was self-administered at baseline (V1), V2, and V3. PASE measures total, occupational, household, and leisure physical activities over the previous 7 days and asks about the intensity, frequency, and duration of a var-iety of activities, including walking; strenuous, moderate and light sports; muscle strength and endurance training; occupational activities, including standing or walking; lawn work and gardening; caring for another person; home repairs; and heavy and light housework. The fre-quency and duration of each activity is multiplied by an empirically derived item weight and summed to compute the total PASE score activity [22]. PASE scores, which have no units, provide a relative rather than absolute measure of PA levels. PASE has been previously validated with objective measures of physical activity [22–24], and has high test–retest reliability [22, 23].
Assessment of weight, and body composition
Questionnaire data
At baseline, participants reported their age, race/ethnicity, education, smoking status, alcohol use, and health status. Self-reported medical history data included history of physician diagnosis of diabetes mellitus, hypertension, cor-onary heart disease, congestive heart failure, chronic ob-structive lung disease, and non-skin cancer.
Statistical analysis
Group-based trajectory modeling (GBTM) was applied using TRAJ software in STATA (v. 9.2) which identifies clusters of individuals following similar progressions of a specified phenotype over some measure of time (e.g.; age, follow up time). [19] GBTM are descriptive ana-lyses that identify latent groups of individuals based on patterns (i.e., decline, incline, cyclic), while simultan-eously accounting for unobserved heterogeneity in the data [18]. Data analysis proceeded through three steps. The maximum number of groups (trajectories) for each phenotype was decided a priori. A quadratic shape of the pattern of change per trajectory was specified for all models, as recommended by Jones et al. 2001 [18, 19]. The number of trajectories were then fit sequentially until the most parsimonious model was determined by either the maximum number of groups decided by the Bayesian Information Criterion (BIC) or a priori. Briefly, the best fit model and number of trajectory groups were determined using the 2ΔBIC > 10; such that subsequent complex models with an increased number of trajectories groups would not identify unique clusters of individuals. If the number of tories was greater than the maximum number of trajec-tories decided a priori then the models were fit with the number of trajectories decided prior to the analysis. After the final model was defined, mean posterior prob-abilities were calculated to ensure internal reliability of the model. In all models, an individual was assigned to a group based on his highest posterior group probabil-ity over the follow up. For generalizabilprobabil-ity, we only in-cluded specific groups comprised of at least 1% of the analytic cohort. The same model-fit criteria were re-peated to determine trajectories of PA, total body weight and fat mass, and LM, over the maximum follow up, in separate models.
Joint trajectory modeling was employed to examine combinations of PA groups with each of the body com-position variables (i.e., PA-weight, PA-fat mass, PA-LM) using similar model fit criteria. Baseline characteristics of participants were reported by PA trajectory groups as means, medians and proportions as appropriate, and dif-ferences between PA trajectory groups were tested using ANOVA and χ2 for continuous and categorical charac-teristics, respectively. Formal statistical tests, restricted to those who returned to visit 3 and had non missing
measures at baseline and at visit 3, were performed to determine:
1. whether changes from baseline (V1) to visit 3 in body composition measures were statistically significant from zero within each trajectory, without consideration of the PA trajectories. This test will determine if GBTM correctly (and significantly)
described the trajectory’s pattern (i.e., decline,
incline, cyclic).
2. whether mean change in each body composition measure (computed [V3-V1] for each body composition trajectory) was significantly different with-in and across PA trajectories. Kruskal-Wallis
P-values were reported due to slightly skewed body
composition data. Tests of statistical significance
were 2-tailed, withα= 0.05.
Results
Subject characteristics
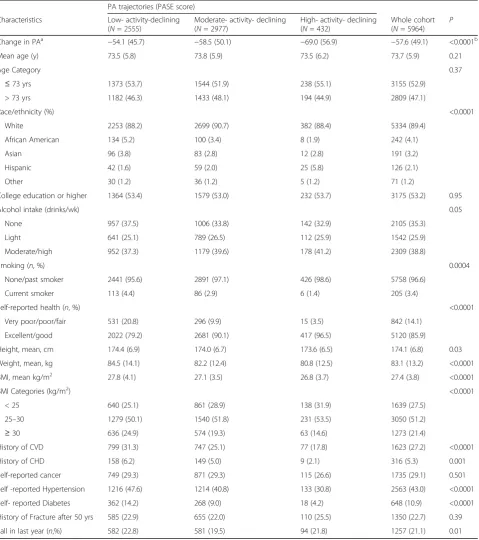
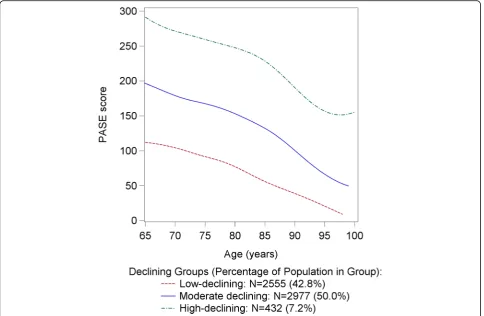
PA trajectory patterns, all ofdecliningPA, were identified by GBTM methods: high (baseline) activity, moderate activity, and low activity, representing 7.2%, 50.0%, and 42.8%, of the total analytic cohort, respectively. Descrip-tive statistics of the 5964 men in the cohort are presented in Table 1 by these PA (PASE score) trajectory groups. The average baseline age (SD) was 73.7 (5.9) years. The majority were Caucasian (89.4%). A greater proportion of men in the low-activity-declining group reported having hypertension, diabetes, CVD and CHD and past-year fall history compared to men in the moderate or high activity baseline groups (allP< .05).
Patterns of change in PA
As noted above, the final models showed adeclinein PA for all three trajectory groups (P for change not zero <0.05); however, the decline in activity differed signifi-cantly among the three PA groups (P < .0001) over the 6.9 year follow-up (Table 1, Fig. 1), with the greatest de-clines observed in men in the high-activity-declining group (P for pairwise difference between high-activity-declining and low-activity-high-activity-declining <.001; P for pairwise difference between high-activity-declining and moderate-activity-declining <.001).
Individual patterns of change in body weight, LM, and fat mass
Table 1Baseline Characteristics by Physical Activity Groups in 5964 MrOS Men
PA trajectories (PASE score)
Characteristics Low- activity-declining (N= 2555)
Moderate- activity- declining (N= 2977)
High- activity- declining (N= 432)
Whole cohort (N= 5964) P
Change in PAa −54.1 (45.7) −58.5 (50.1) −69.0 (56.9) −57.6 (49.1) <0.0001b
Mean age (y) 73.5 (5.8) 73.8 (5.9) 73.5 (6.2) 73.7 (5.9) 0.21
Age Category 0.37
≤73 yrs 1373 (53.7) 1544 (51.9) 238 (55.1) 3155 (52.9)
> 73 yrs 1182 (46.3) 1433 (48.1) 194 (44.9) 2809 (47.1)
Race/ethnicity (%) <0.0001
White 2253 (88.2) 2699 (90.7) 382 (88.4) 5334 (89.4)
African American 134 (5.2) 100 (3.4) 8 (1.9) 242 (4.1)
Asian 96 (3.8) 83 (2.8) 12 (2.8) 191 (3.2)
Hispanic 42 (1.6) 59 (2.0) 25 (5.8) 126 (2.1)
Other 30 (1.2) 36 (1.2) 5 (1.2) 71 (1.2)
College education or higher 1364 (53.4) 1579 (53.0) 232 (53.7) 3175 (53.2) 0.95
Alcohol intake (drinks/wk) 0.05
None 957 (37.5) 1006 (33.8) 142 (32.9) 2105 (35.3)
Light 641 (25.1) 789 (26.5) 112 (25.9) 1542 (25.9)
Moderate/high 952 (37.3) 1179 (39.6) 178 (41.2) 2309 (38.8)
Smoking (n, %) 0.0004
None/past smoker 2441 (95.6) 2891 (97.1) 426 (98.6) 5758 (96.6)
Current smoker 113 (4.4) 86 (2.9) 6 (1.4) 205 (3.4)
Self-reported health (n, %) <0.0001
Very poor/poor/fair 531 (20.8) 296 (9.9) 15 (3.5) 842 (14.1)
Excellent/good 2022 (79.2) 2681 (90.1) 417 (96.5) 5120 (85.9)
Height, mean, cm 174.4 (6.9) 174.0 (6.7) 173.6 (6.5) 174.1 (6.8) 0.03
Weight, mean, kg 84.5 (14.1) 82.2 (12.4) 80.8 (12.5) 83.1 (13.2) <0.0001
BMI, mean kg/m2 27.8 (4.1) 27.1 (3.5) 26.8 (3.7) 27.4 (3.8) <0.0001
BMI Categories (kg/m2) <0.0001
< 25 640 (25.1) 861 (28.9) 138 (31.9) 1639 (27.5)
25–30 1279 (50.1) 1540 (51.8) 231 (53.5) 3050 (51.2)
≥30 636 (24.9) 574 (19.3) 63 (14.6) 1273 (21.4)
History of CVD 799 (31.3) 747 (25.1) 77 (17.8) 1623 (27.2) <0.0001
History of CHD 158 (6.2) 149 (5.0) 9 (2.1) 316 (5.3) 0.001
Self-reported cancer 749 (29.3) 871 (29.3) 115 (26.6) 1735 (29.1) 0.501
Self -reported Hypertension 1216 (47.6) 1214 (40.8) 133 (30.8) 2563 (43.0) <0.0001
Self- reported Diabetes 362 (14.2) 268 (9.0) 18 (4.2) 648 (10.9) <0.0001
History of Fracture after 50 yrs 585 (22.9) 655 (22.0) 110 (25.5) 1350 (22.7) 0.39
Fall in last year (n,%) 582 (22.8) 581 (19.5) 94 (21.8) 1257 (21.1) 0.01
Mean (SD) or proportion as shown
BMIbody mass index,CHDcoronary heart disease,CVDcardiovascular disease,PAphysical activity
P-values indicates the overall difference among PA trajectories
a
Change measured as change in PASE score from visit 1 to visit 3.
b
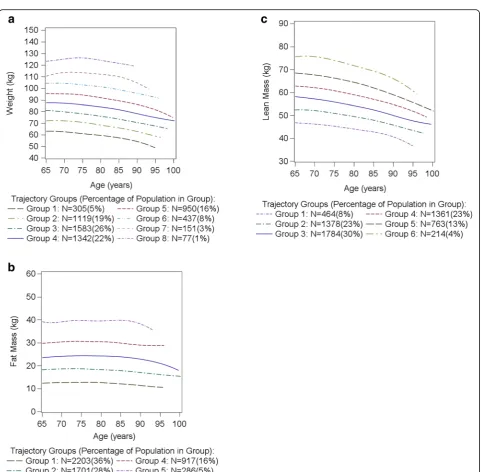
among men with lower (trajectory 1) versus higher base-line weight or LM, respectively. Increases in fat mass were observed in two fat mass groups, and small, statis-tically significant declines were observed in one fat mass group from visit 1 to visit 3 (Additional file 1: Table S1, Fig. 2).
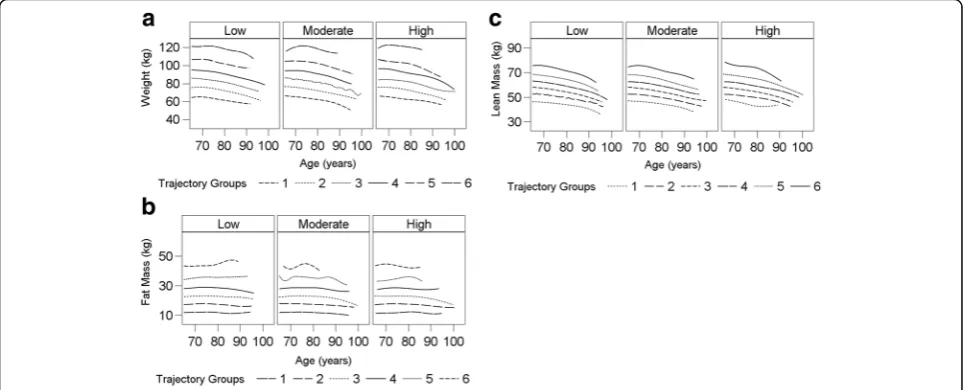
Joint trajectory patterns of physical activity and body composition
Figure 3a–c graphically illustrates the joint trajectory models for changes in patterns of each body compos-ition measure condcompos-itional on PA. For each joint trajec-tory model the most parsimonious models identified six trajectories for the body composition measure and three PA trajectories.
To determine whether body composition patterns dif-fered significantly by PA trajectory, we computed the mean change (V3-V1) in the six groups of body weight, fat mass, LM groups, respectively, relative to the three declining PA trajectories (Table 2). We addressed whether: 1) changes in body composition measures from baseline to visit 3 were statistically significant from zero within each trajectory; 2) changes in body composition measures differed significantly within each PA trajectory; and, 3) changes in body composition measures from
baseline to visit 3 were globally different across all three PA trajectories. Overall, body weight declined in most bodyweight/PA trajectory groups (PV3-V1< .05 for most). Moreover, changes in body weight differed among the eighteen combinations of PA and body weight trajector-ies (overall ANOVA P< .0001). Within the low-activity-declining and moderate-activity-low-activity-declining groups, mean body weight changes by the six body weight trajectories were significantly different from one another (P for ANOVA within activity declining groups <.0001). Conversely, there were no statistically significant differ-ences in body weight change within the body weight tra-jectories for the high-activity-declining group (ANOVA within high activity group,P= .24).
Fat mass changes remained relatively unchanged (stable) across most fat mass/PA groups over time (PV3-V1> .05 for most); though significant increases in fat mass were observed in three fat mass trajectories in the moderate-activity-declining group (PV3-V1 < .05). Changes in fat mass differed by the eighteen combinations of fat mass and PA patterns (overall ANOVAP < .0001). Within the low-activity-declining and moderate-activity-declining groups, significant differences in mean fat mass changes by the six fat mass trajectories were observed (P for ANOVA within activity-declining groups <.0001).
However, the overall differences in fat mass change within the fat mass trajectories for the high-activity-declining group were not significant (ANOVA within high activity group,P= .51).
LM declined in most of the LM/activity pattern groups (PV3-V1 < .05 for most). Changes in LM differed by the eighteen combinations of LM and activity patterns (overall ANOVA P < .0001). Similar to the other body compos-ition measures, there were differences in the mean changes in LM by LM trajectories within the low-activity-declining and moderate-activity-low-activity-declining groups, (P for
ANOVA within activity declining groups <.05). Addition-ally, there were no significant differences in mean LM changes within the LM trajectories for the high-activity-declining group (ANOVA within high activity group,
P= .81).
Discussion
In this descriptive study, we modeled trajectories of changes in PA and body composition over a nearly 7-year follow-up period with group based trajectory methods (GBTM). Three key findings emerged from these analyses.
First, three discrete trajectories of PA change were identi-fied among these older men, based primarily on baseline (regular) self-reported PA. All declined over the 7 year follow-up, however, the greatest declines were observed among men in the high-activity-declining group, com-pared to the moderate-activity- and low-activity-declining trajectories (both P < .001). Although the magnitude of the difference in change was modest it is important to recognize that men who report the highest PA levels at the outset of a longitudinal study may decrease PA much more than less active men over the course of the study. Nonetheless, these men still reported higher activity levels than the other two groups at subsequent visits. Second, greater declines in body weight and LM were observed among men with lower versus higher baseline body weight and LM, respectively. Joint-trajectory modeling showed that total body weight and LM declined, whereas fat mass levels were relatively unchanged among high ac-tivity- and low-acac-tivity-declining groups. In contrast, fat mass was significantly increased in three of the six moderate-activity-declining trajectories. Third, with-in group changes in body weight, fat mass and LM were associated with patterns of PA among low activity, and moderate activity declining men, but were not statisti-cally different among high-activity-declining men.
Data on long-term PA changes in older men are scarce [11, 25, 26]. Previous studies of PA behavior in older adults have generally been cross-sectional [14, 27, 28] or based on self-reported baseline PA levels only and have not captured an individual’s change in activity over time. In the MrOS cohort, all trajectory modeling groups showed declines in PA levels, consistent with a previous MrOS report of decreased PA levels over a 5-year follow up, with the greatest PA declines attributed primarily to decreases in occupational, leisure, and household PA
and poor health [24]. In contrast, de Souto et al. (2014) reported that total volume and duration of PA remained relatively stable in another cohort of older men; how-ever, this was based on only 12- and 38 month follow ups [29].
To our knowledge, this is the first study to use latent class growth modeling analysis to describe, simultan-eously, the relationship of changes in PA and changes in body-composition in older men. Examining the dynamic changes in PA as it relates to changes in body compos-ition is particularly important in older adults, for whom the relation between PA and body composition may be the consequence of underlying poor health or chronic disease. Notably, a greater proportion of men in the low-activity-declining reported having debilitating health is-sues versus those in the moderate- and high-activity-declining groups (Table 1). Previous prospective studies showed a tendency toward lean mass loss and fat mass gain over time in healthy, weight-stable persons [26, 30]. In the Women’s Health Initiative (WHI) cohort of women aged 50–79, lean mass decreased across all age (decade) groups and all PA levels over about 6 years, whereas, fat mass change depended on both age and PA level, with higher PA levels attenuating fat gains in youn-ger women (age 50–59), while fat loss was observed at older ages, regardless of PA level [9]. In contrast, in the MrOS cohort of men aged 65 and older, significant body weight and lean mass loss was observed in nearly all body weight and LM groups and across all PA change trajectories, whereas fat mass levels increased signifi-cantly among moderate-activity-declining groups, but remained relatively stable in high-activity- and low-activity-declining trajectory groups (P > .05) over nearly 7 years. Significant differences in the mean change of each body composition measure were
Table 2 Mean Body Composition Changes from Baseline to Visit 3 b y P A Trajectory in Older Men a,b Change in body weight by activity and weight pattern Traj. Low-activity -declining Moderate-activit y-declining High-activity-declin ing Poverall d N Mean (SD)
P(Δ
V3-V1)
N
Mean
(SD)
P(Δ
V3-V1)
N
Mean
(SD)
P(Δ
V3-V1) Body weight Traj 1 207 − 2.61 ± 4.76 <.0001 306 − 2.30 ± 4.20 <.0001 55 − 3.12 ± 4.84 0.0002 <.0001 2 552 − 2.38 ± 4.49 <.0001 982 − 2.17 ± 6.15 <.0001 70 − 1.23 ± 5.25 .09 3 613 − 2.47 ± 5.83 <.0001 962 − 2.32 ± 4.79 <.0001 138 − 2.67 ± 4.57 <.0001 4 678 − 2.80 ± 4.64 <.0001 593 − 2.43 ± 4.35 <.0001 167 − 2.05 ± 4.07 <.0001 5 275 − 0.65 ± 6.76 .21 201 − 2.00 ± 8.42 005 16 − 2.44 ± 6.46 .24 6 111 1.00 ± 9.11 .37 23 33.35 ± 9.00 .19 15 − 0.04 ± 5.50 .98 Pwithin body weight-PA traj group c <.0001 <.0001 .24 Change in fat mass by activity and fat mass pattern Traj. Low-activity -declining Moderate-activit y-declining High-activity-declin ing Poverall d N Mean (SD)
P(Δ
V3-V1)
N
Mean
(SD)
P(Δ
V3-V1)
N
Mean
(SD)
P(Δ
V3-V1) Fat mass Traj. 1 1181 − 0.19 ± 2.93 .07 619 − 0.10 ± 3.23 .56 178 − 0.01 ± 3.14 .96 <.0001 2 900 0.05 ± 3.47 .72 757 0.33 ± 3.36 .05 127 0.08 ± 3.36 .83 3 394 − 0.19 ± 2.64 .26 205 − 0.38 ± 3.18 .20 100 − 0.34 ± 2.36 .21 4 509 0.36 ± 4.33 .13 490 0.45 ± 4.13 .08 33 0.84 ± 2.98 .18 5 109 1.07 ± 5.22 .07 237 1.54 ± 4.72 .0004 16 1.66 ± 2.62 .08 68 − 1.92 ± 8.30 .67 93 2.32 ± 4.98 .004 8 − 0.35 ± 3.65 .84 Pwithin fat mass-PA traj group c <.0001 <.0001 .51 Change in LM by activity and LM pattern Traj. Low-activity -declining Moderate-activit y-declining High-activity-declin ing Poverall d N Mean (SD)
P(Δ
V3-V1)
N
Mean
(SD)
P(Δ
V3-V1)
N
Mean
(SD)
P(Δ
observed among men with in low-activity-and moderate-activity-declining PA groups, only (Table 2; Fig. 3), suggesting that changes in body weight, fat mass and LM were associated with patterns of PA among low-activity-, and moderate-activity declining men, but not among high-activity-declining men. Nonetheless, our findings of symmetry in the declin-ing patterns of weight loss and LM further support the hypothesis that there is a failure to conserve lean mass with weight loss in old age [4, 11, 25], whereas main-taining higher PA levels earlier in life and during aging may have a modest role in attenuating weight and lean mass declines in older men (Table 2, ANOVA within high activity group, bothP> 0.05), consistent with the results reported by previous investigators [11, 25].
Strengths & limitations
These analyses included repeated PA measures in a large cohort of elderly men, allowing the capture of distinct, in-dividual changes in PA engagement in older adults, and employed DXA to assess longitudinal body composition changes, using validated methods that correlate highly with other criterion methods [26]. As MrOS participants were predominantly healthy Caucasians, further investiga-tion of patterns in PA-body composiinvestiga-tion changes in racial and ethnic minorities and men with specific health condi-tions, is warranted. Also, trajectory modeling is inherently limited in capturing individual variability and may lead to over-grouping with significant variation within PA trajec-tories. Additionally, PASE scores do not measure actual activity levels or the metabolic equivalent of a task or mi-nutes of exercise; therefore, these results cannot be readily interpreted in relationship to national recommendations for PA in older adults. Corroborating the reported de-clines in PA with objective measures, to further under-stand PA in the context of dose (intensity, frequency and duration), may be warranted. Adjusting for intensity and mode of exercise to demarcate resistance training was not feasible in this study. Lastly, given the observational na-ture of the study, we cannot infer causality as to whether declines in loss of weight and lean mass were the result of declines in PA or confounded by other demographic, life-style or genetic factors affecting PA and body composition changes. Some of the groups identified, especially in the joint PA/body composition models, are very small and there is limited statistical power to draw conclusions about such groups.
Conclusion
The analyses from this longitudinal study of older men suggest that initial PA and body composition may differ-entiate PA and body composition changes over 6.9 years of follow-up.
Additional file
Additional file 1: Figure S1.Flow Chart describing MrOS sample size
for Trajectory Analysis. This figure describes, total sample size of men included from each study visit, and specifically, the sample of men with non missing values for the body composition and PASE score. A description of how the Proc Traj methods accommodates missing data into the trajectory building is also provided.Table S1.Declining Patterns of Body Composition Changes From Visit 1 to Visit 3 (2000 to 2009). This table reports the individual patterns of change in body weight, lean mass, and fat mass, according to the most parsimonious model of eight body weight trajectories, five fat mass trajectories groups and six lean mass trajectories, respectively. (DOCX 30 kb)
Abbreviations
BIC:Bayesian Information Criterion; DXA: Dual energy x-ray absorptiometry; GBTM: Group-based trajectory modeling; LM: Lean mass; MrOS: Osteoporotic Fractures in Men Study; PA: Physical activity; PASE: Physical Activity Scale for the Elderly; SD: Standard deviation; V: Visit
Acknowledgments None.
Funding
The Osteoporotic Fractures in Men (MrOS) Study is supported by National Institutes of Health (NIH) funding. The following institutes provide support: the National Institute of Arthritis and Musculoskeletal and Skin Diseases (NIAMS); the National Institute on Aging (NIA); the National Center for Research Resources (NCRR); and, NIH Roadmap for Medical Research under the following grant numbers: U01 AR45580, U01 AR45614, U01 AR45632, U01 AR45647, U01 AR45654, U01 AR45583, U01 AG18197, U01 AG027810, and UL1 TR000128. Dr. Laddu was supported by the National Institutes of Health /National Heart, Lung, and Blood Institute Cardiovascular Disease Prevention Fellowship (T32; grant HL007034).
This work was presented by Dr. Deepika R. Laddu at the 2016 International Conference on Frailty and Sarcopenia Research, April 28, 2016, Philadelphia, Pennsylvania.
Availability of data and materials
The datasets analyzed during the current study are available from the corresponding author and the MrOS coordinating center upon reasonable request.
Authors’contributions
DRL analyzed the data, interpreted the results and wrote the manuscript. DRL, PMC, MLS conceptualized the research question and designed the study. PMC provided consultation on methodology and helped with analysis interpretation. NP performed the statistical data analysis, and contributed to the interpretation of results. ARH, EO, and IM provided critical revisions to the manuscript. All authors approved the final version of the submitted and published manuscript and take responsibility for the integrity of the data and the accuracy of the data analysis. All authors contributed to the work equally.
Competing interests
The authors declare that they have no competing interests. Additionally, there are no conflicts of interest and there is nothing to disclose by any of the authors.
Consent for publication Not applicable.
Ethics approval and consent to participate
Publisher’s Note
Springer Nature remains neutral with regard to jurisdictional claims in published maps and institutional affiliations.
Author details
1Department of Physical Therapy, University of Illinois at Chicago, Chicago,
Illinois 60612, USA.2California Pacific Medical Center Research Institute, San Francisco, California, USA.3Department of Epidemiology and Biostatics, University of California, San Francisco, CA, USA.4Division of Endocrinology, Gerontology and Metabolism, Department of Medicine, Stanford University, Palo Alto, California, USA.5Department of Medicine, Oregon Health & Sciences University, Portland, OR, USA.6Department of Epidemiology, University of Pittsburgh, Pittsburgh, PA, USA.7Stanford Prevention Research Center, Department of Medicine, Stanford University, Stanford, California, USA.
Received: 28 December 2016 Accepted: 22 May 2017
References
1. Dziura J. Mendes de Leon C, Kasl S, DiPietro L: Can physical activity attenuate aging-related weight loss in older people? The Yale Health and Aging Study, 1982-1994. Am J Epidemiol. 2004;159(8):759–67.
2. Ensrud KE, Fullman RL, Barrett-Connor E, Cauley JA, Stefanick ML, Fink HA, et al. Voluntary weight reduction in older men increases hip bone loss: the osteoporotic fractures in men study. J Clin Endocrinol Metab. 2005;90(4): 1998–2004.
3. Goodpaster BH, Park SW, Harris TB, Kritchevsky SB, Nevitt M, Schwartz AV, et al. The loss of skeletal muscle strength, mass, and quality in older adults: the health, aging and body composition study. J Gerontol A Biol Sci Med Sci. 2006;61(10):1059–64.
4. Newman AB, Lee JS, Visser M, Goodpaster BH, Kritchevsky SB, Tylavsky FA, et al. Weight change and the conservation of lean mass in old age: the Health, Aging and Body Composition Study. Am J Clin Nutr. 2005;82(4):872–8. quiz 915-876
5. Mitchell WK, Williams J, Atherton P, Larvin M, Lund J, Narici M. Sarcopenia, dynapenia, and the impact of advancing age on human skeletal muscle size and strength; a quantitative review. Front Physiol. 2012;3:260.
6. Cruz-Jentoft AJ, Baeyens JP, Bauer JM, Boirie Y, Cederholm T, Landi F, et al. Sarcopenia: European consensus on definition and diagnosis: Report of the European Working Group on Sarcopenia in Older People. Age Ageing. 2010;39(4):412–23.
7. Visser M, Goodpaster BH, Kritchevsky SB, Newman AB, Nevitt M, Rubin SM, et al. Muscle mass, muscle strength, and muscle fat infiltration as predictors of incident mobility limitations in well-functioning older persons. J Gerontol A Biol Sci Med Sci. 2005;60(3):324–33.
8. Forhan M, Gill SV. Obesity, functional mobility and quality of life. Best Pract Res Clin Endocrinol Metab. 2013;27(2):129–37.
9. Sims ST, Kubo J, Desai M, Bea J, Beasley JM, Manson JE, et al. Changes in physical activity and body composition in postmenopausal women over time. Med Sci Sports Exerc. 2013;45(8):1486–92.
10. Goodpaster BH, Chomentowski P, Ward BK, Rossi A, Glynn NW, Delmonico MJ, et al. Effects of physical activity on strength and skeletal muscle fat infiltration in older adults: a randomized controlled trial. Journal of applied physiology (Bethesda, Md : 1985). 2008;105(5):1498–503.
11. Hughes VA, Frontera WR, Roubenoff R, Evans WJ, Singh MA. Longitudinal changes in body composition in older men and women: role of body weight change and physical activity. Am J Clin Nutr. 2002;76(2):473–81. 12. Nelson ME, Rejeski WJ, Blair SN, Duncan PW, Judge JO, King AC, et al.
Physical activity and public health in older adults: recommendation from the American College of Sports Medicine and the American Heart Association. Med Sci Sports Exerc. 2007;39(8):1435–45.
13. CDC/NCHS, National Health Interview Survey, 1997–2014, Sample Adult Core component, U.S. Department of Health and Human Services. Centers for Disease Control and Prevention: National Center for Health Statistics; 2014.
14. Matthews CE, Chen KY, Freedson PS, Buchowski MS, Beech BM, Pate RR, et al. Amount of time spent in sedentary behaviors in the United States, 2003-2004. Am J Epidemiol. 2008;167(7):875–81.
15. Di Pietro L, Dziura J, Blair SN. Estimated change in physical activity level (PAL) and prediction of 5-year weight change in men: the Aerobics Center
Longitudinal Study. International journal of obesity and related metabolic disorders : journal of the International Association for the Study of Obesity. 2004;28(12):1541–7.
16. Williams PT, Wood PD. The effects of changing exercise levels on weight and age-related weight gain. International journal of obesity (2005). 2006; 30(3):543–51.
17. Genton L, Karsegard VL, Chevalley T, Kossovsky MP, Darmon P, Pichard C. Body composition changes over 9 years in healthy elderly subjects and impact of physical activity. Clinical nutrition (Edinburgh, Scotland). 2011; 30(4):436–42.
18. Nagin DS, Odgers CL. Group-based trajectory modeling in clinical research. Annu Rev Clin Psychol. 2010;6:109–38.
19. Jones BL, Nagin D. K R: A SAS Procedure Based on Mixture Models for Estimating Developmental Trajectories. Sociol Methods Res. 2001;29:374–93. 20. Orwoll E, Blank JB, Barrett-Connor E, Cauley J, Cummings S, Ensrud K, et al.
Design and baseline characteristics of the osteoporotic fractures in men (MrOS) study–a large observational study of the determinants of fracture in older men. Contemporary clinical trials. 2005;26(5):569–85.
21. Blank JB, Cawthon PM, Carrion-Petersen ML, Harper L, Johnson JP, Mitson E, et al. Overview of recruitment for the osteoporotic fractures in men study (MrOS). Contemporary clinical trials. 2005;26(5):557–68.
22. Washburn RA, Smith KW, Jette AM, Janney CA. The Physical Activity Scale for the Elderly (PASE): development and evaluation. J Clin Epidemiol. 1993; 46(2):153–62.
23. Dinger MK, Oman RF, Taylor EL, Vesely SK, Able J. Stability and convergent validity of the Physical Activity Scale for the Elderly (PASE). The Journal of sports medicine and physical fitness. 2004;44(2):186–92.
24. Janney CA, Cauley JA, Cawthon PM, Kriska AM. Longitudinal physical activity changes in older men in the Osteoporotic Fractures in Men Study. J Am Geriatr Soc. 2010;58(6):1128–33.
25. Shiroma EJ, Sesso HD, Lee IM. Physical activity and weight gain prevention in older men. International journal of obesity (2005). 2012;36(9):1165–9. 26. Lee CG, Boyko EJ, Nielson CM, Stefanick ML, Bauer DC, Hoffman AR, et al.
Mortality risk in older men associated with changes in weight, lean mass, and fat mass. J Am Geriatr Soc. 2011;59(2):233–40.
27. Martin KR, Koster A, Murphy RA, Van Domelen DR, Hung MY, Brychta RJ, et al. Changes in daily activity patterns with age in U.S. men and women: National Health and Nutrition Examination Survey 2003-04 and 2005-06. J Am Geriatr Soc. 2014;62(7):1263–71.
28. Kruger J, Carlson SA, Buchner D. How active are older Americans? Prev Chronic Dis. 2007;4(3):A53.
29. de Souto BP, Ferrandez AM. Static or dynamic predictors of physical activity (PA)? A tracking study based on 12- and 38-month follow-ups in older adults. Arch Gerontol Geriatr. 2014;59(2):326–30.
30. Gallagher D, Ruts E, Visser M, Heshka S, Baumgartner RN, Wang J, et al. Weight stability masks sarcopenia in elderly men and women. Am J Phys Endocrinol Metab. 2000;279(2):E366–75.
• We accept pre-submission inquiries
• Our selector tool helps you to find the most relevant journal
• We provide round the clock customer support
• Convenient online submission
• Thorough peer review
• Inclusion in PubMed and all major indexing services
• Maximum visibility for your research
Submit your manuscript at www.biomedcentral.com/submit