Telephone: +44 (0)1582 763133 Web: http://www.rothamsted.ac.uk/
Rothamsted Repository Download
A - Papers appearing in refereed journals
International Wheat Genome Sequencing Consortium (IWGSC),
Kanyuka, K. and King, R. 2018. Shifting the limits in wheat research and
breeding using a fully annotated reference genome. Science. 361 (6403),
p. eaar7191.
The publisher's version can be accessed at:
• https://dx.doi.org/10.1126/science.aar7191
The output can be accessed at:
https://repository.rothamsted.ac.uk/item/84751/shifting-the-limits-in-wheat-research-and-breeding-using-a-fully-annotated-reference-genome.
© 17 August 2018, Please contact [email protected] for copyright queries.
Title: Shifting the limits in wheat research and breeding using a fully
annotated reference genome
Authors: International Wheat Genome Sequencing Consortium (IWGSC)* †.
Affiliations:
*Correspondence to: [email protected] (Rudi Appels),
5
[email protected] (Kellye Eversole), and [email protected] (Nils Stein).
† All authors with their affiliations appear in the acknowledgements at the end of this paper.
Abstract (100 – 125 words): An annotated reference sequence representing the hexaploid bread
wheat genome in 21 pseudomolecules has been analyzed to identify the distribution and genomic
10
context of coding and non-coding elements across the A, B and D sub-genomes. With an
estimated coverage of 94% of the genome and containing 107,891 high confidence gene models,
this assembly enabled the discovery of tissue and developmental stage related co-expression
networks using a transcriptome atlas representing all stages of wheat development. Dynamics of
complex gene families involved in environmental adaptation and end-use quality were revealed at
15
sub-genome resolution and contextualized to known agronomic single gene or quantitative trait
loci. This community resource establishes the foundation for accelerating wheat research and
application through improved understanding of wheat biology and genomics-assisted breeding.
One Sentence Summary (keep under 125 characters): The 21 annotated chromosomes of
20
bread wheat provide a foundation for accelerated innovation in wheat research and breeding.
Main Text: Wheat (Triticum aestivum L.), the most widely-cultivated crop on earth, contributes
source (1). Thus, wheat yields and production impact the global economy and failed harvests
result in malnutrition and can lead to social unrest as evidenced by the 2007-2008 crisis when
average wheat prices doubled rapidly because of major drought-related crop losses around the
world (2). Breeders strive to develop improved varieties by fine-tuning genetically complex yield
and end-use quality parameters while maintaining yield stability and regional adaptation to
5
specific biotic and abiotic stresses (3). These efforts are limited, however, by insufficient
knowledge and understanding of the molecular basis of key agronomic traits. To meet the
demands of human population growth, there is an urgent need for wheat research and breeding to
accelerate genetic gain while increasing wheat yield and protecting quality traits. In other plant
and animal species, access to a fully annotated and ordered genome sequence, including
10
regulatory sequences and genome diversity information, has promoted the development of
systematic and more time-efficient approaches for the selection and understanding of important
traits (4). Wheat has lagged behind primarily due to the challenges of assembling a genome that
is large (1C=16 Gb) (5), hexaploid and complex with over 85% repetitive DNA.
To provide a foundation for improvement through molecular breeding, the International
15
Wheat Genome Sequencing Consortium (IWGSC) established a road map in 2006 to deliver a
high-quality reference genome sequence of the bread wheat cultivar ‘Chinese Spring’ (CS). In
2014, a chromosome survey sequence (CSS) intermediate product assigned 124,201 gene loci
across the 21 chromosomes (6) and revealed the evolutionary dynamics of the wheat genome
through gene loss, gain, and duplication. The lack of global sequence contiguity and incomplete
20
coverage (only 10 Gb were assembled), however, did not provide the wider regulatory genomic
provided full annotation, resolved the intergenic space, or, more importantly for applications in
breeding and gene cloning, presented the genome in the correct physical order.
Here, the IWGSC reports an ordered and annotated assembly (IWGSC RefSeq v1.0) of the 21
chromosomes of the allohexaploid wheat cultivar CS, integrated with extensive genetic and
genomic resources. The completeness and accuracy of IWGSC RefSeq v1.0 provided novel
5
insights into global genome composition and enabled the construction of complex gene
co-expression networks to identify central regulators in critical pathways such as flowering time
control. The ability to resolve the inherent complexity of gene families related to important
agronomic traits demonstrated the impact of IWGSC RefSeq v1.0 on dissecting quantitative traits
genetically and implementing modern breeding strategies including genome editing for future
10
wheat improvement.
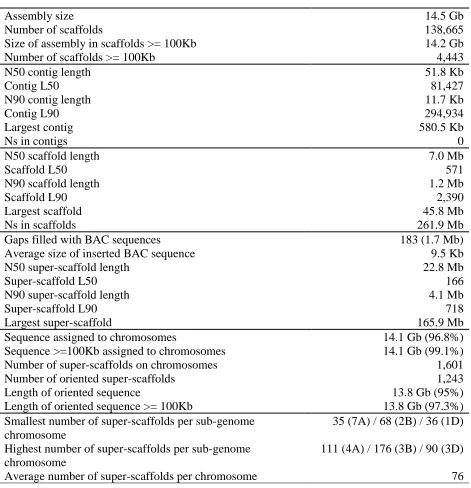
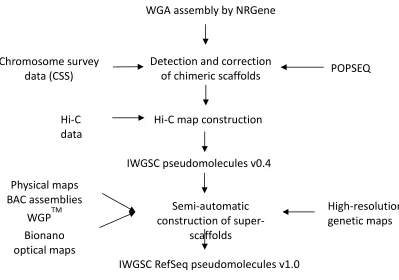
Chromosome-scale assembly of the wheat genome
Pseudomolecule sequences representing the 21 chromosomes of the bread wheat genome were
assembled by integrating a draft whole genome de novo assembly (WGA), built from Illumina
short read sequences using NRGene deNovoMagic2 (Table 1, Fig. 1A, Table S1, S2) with
15
additional layers of genetic, physical, and sequence data (Table S3-S8, Fig. S1, S2). In the
resulting 14.5 Gb genome assembly, contigs and scaffolds with N50s of 52 kb and 7 Mb,
respectively, were linked into superscaffolds (N50 = 22.8 Mb), with 97% (14.1 Gb) assigned and
ordered along the 21 chromosomes and almost all of the assigned sequences also oriented (13.8
Gb, 98%). Unanchored scaffolds comprising 481 Mb (2.8% of the assembly length) formed the
20
‘unassigned chromosome’ (ChrUn) bin. The quality and contiguity of the IWGSC RefSeq v1.0
genome assembly was assessed through alignments with three independent datasets: (i) radiation
(average Spearman’s ρ: 0.98); (ii) the genetic positions of 7,832 and 4,745
genotyping-by-sequencing (GBS) derived genetic markers in 88 double haploid and 993 recombinant inbred
lines, respectively, showed a high correlation to their positions in the pseudomolecules
(Spearman’s r: 0.986 and 0.987, respectively); and (iii) 1.24 million pairs of neighbor insertion
site based polymorphism markers (ISBPs) (10) of which 97% were collinear and mapped in a
5
similar size range (difference <2 kb) between the de novo WGA and the available BAC-based
sequence assemblies. Finally, IWGSC RefSeq v1.0 was assessed using independent data derived
from coding and non-coding sequences revealing that 99% and 98% of the previously known
coding exons (6) and TE-derived (ISBP) markers (Table S9), respectively, were present in the
assembly. The approximate 1 Gb size difference between IWGSC RefSeq v1.0 and the new
10
genome size estimates of 15.4-15.8 Gb (Material and Methods) can be accounted for by collapsed
or unassembled sequences of highly-repeated clusters, such as ribosomal RNA coding regions
and telomeric sequences.
A key feature distinguishing the IWGSC RefSeq v1.0 from previous draft wheat assemblies (6-9)
is the long-range organization with 90% of the genome represented in super-scaffolds larger than
15
4.1 Mb and with each chromosome represented on average by only 76 super-scaffolds (Table 1).
The largest super-scaffold spanned 166 Mb, i.e. half the rice (Oryza sativa L.) genome, and larger
than the Arabidopsis thaliana L. genome (11, 12). Moreover, the 21 pseudomolecules now
provide unique positions for large numbers of molecular markers widely used in wheat research
and breeding (504 SSRs, 3,025 DArTs, 6,689 ESTs, 205,807 SNPs, 4,512,979 ISBPs) (Table
20
S9), thus providing a direct link between the genome sequence and genetic loci / genes
underlying traits of agronomic importance.
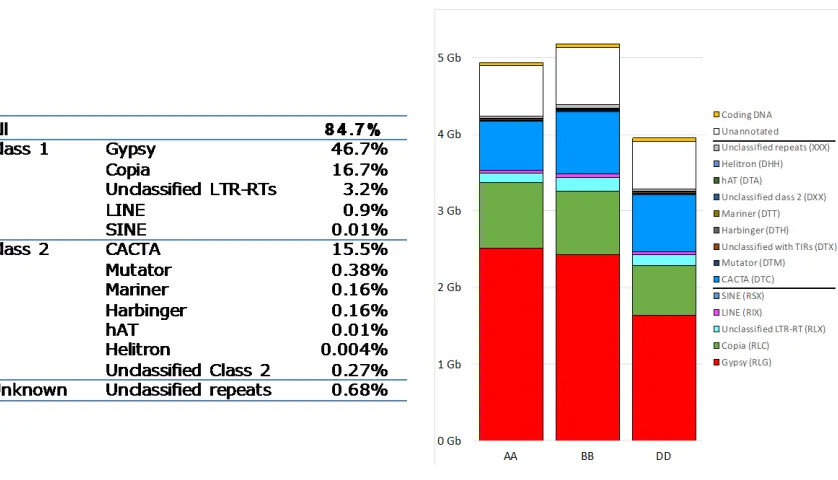
Analyses of the components of the genome sequence revealed the distribution of key elements
and enabled detailed comparisons of the homeologous A, B and D sub-genomes. Accounting for
85% of the genome with a relatively equal distribution across the three sub-genomes (Table 2),
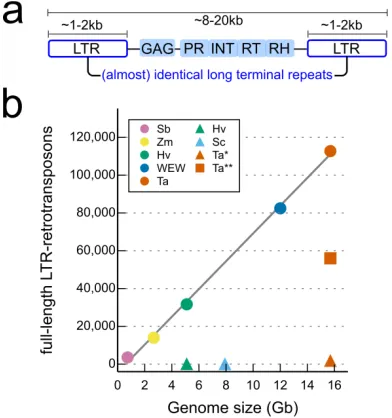
3,968,974 copies of transposable elements (TEs) belonging to 505 families were annotated. Large
numbers (112,744) of full length long terminal-repeat retrotransposons (fl-LTRs) were identified
5
that have been previously notoriously difficult to define from short read sequence assemblies
(Fig. S3). Although the TE content has been extensively rearranged through rounds of deletions /
amplifications since the divergence of the A, B and D sub-genomes about 5 million years ago, the
TE families that shaped the Triticeae genomes have been maintained in similar proportions: 76%
of the 165 TE families present in a cumulative length greater than 1Mb contributed similar
10
proportions (<2-fold change between sub-genomes) and only 11 families, accounting for 2% of
total TEs, showed a higher than 3-fold change between 2 sub-genomes (13). TE abundance
accounts, in part, for the size differences between sub-genomes, e.g. 64% of the 1.2 Gb size
difference between the B and D sub-genomes can be attributed to lower gypsy retrotransposon
content. Significant differences in the low-copy DNA content (primarily unclassified sequences)
15
(e.g. 97 Mb of the 245 Mb size difference between A and B genomes) were also observed (Fig.
S4). As reported previously (14), no evidence was found for a major burst of transposition after
polyploidization. The independent evolution in the diploid lineages was reflected in differences in
the specific composition of A, B and D at the family (variants) level as evidenced by
sub-genome specific over-representation of individual transposon domain signatures (Fig. 1B). A
20
more detailed analysis of the TE content and its impact on the evolution of the wheat genome is
In addition to TEs, annotation of the intergenic space included non-coding RNAs. The analysis of
miRNA and tRNA content identified eight new miRNA families with an excess of lysine tRNAs
(Fig. S5, S6, Table S10). Around 8,000 NUPTs (nuclear inserted plastid DNA segment) and
11,000 NUMTs (nuclear inserted mitochondrial DNA segments) representing respectively 5 and
17 Mb were also revealed by comparing the genome assembly with complete plastid and
5
mitochondrial genomes assembled from the IWGSC RefSeqv1.0 raw read data (Material and
Methods).
Precise positions for the centromeres were defined by integrating Hi-C, CSS data (6) and
published chromatin immuno-precipitation sequencing (ChIP-seq) data for CENH3, a
10
centromere-specific histone H3 variant (15). Clear ChIP-Seq peaks were evident in all
chromosomes and coincided with the centromere-specific repeat families (Fig. 1C, Fig. S7, Table
S11). CENH3 targets were also found in unassigned sequence scaffolds (ChrUn) indicating that
centromeres of several chromosomes are not yet completely resolved. Based on these data, a
conservative estimate for the minimal average size of a wheat centromere is 4.9Mb (6.7Mb, if
15
including ChrUn, Table S11) contrasting with ~1.8 Mb in maize (16, 17) and 0.4-0.8 Mb in rice
(18).
Gene models were predicted using two independent pipelines previously utilized for wheat
genome annotation and then consolidated to produce the RefSeq Annotation v1.0 (Fig. S8).
Subsequently, a set of manually-curated gene models was integrated to build RefSeq Annotation
20
v1.1 (Fig. S9, Table S12-S17). In total, 107,891 high confidence (HC) protein coding loci were
identified, with relatively equal distribution across the A, B and D sub-genomes (35,345, 35,643,
loci were classified as low confidence (LC) genes representing partially supported gene models,
gene fragments, and orphans (Table S18). A predicted function was assigned to 82.1% (90,919)
of HC genes in RefSeq Annotation v1.0 (Table S19, S20) and evidence for transcription was
found for 85% (94,114), compared to 49% of the LC genes (19). Within the pseudogene
category, 25,419 (8%) of 303,818 candidates matched LC gene models. The D sub-genome
5
contained significantly fewer pseudogenes than the A and B sub-genomes (81,905 versus 99,754
and 109,097, respectively; P <2.2e-16), consistent with the more ancient allo-tetraploidization
between A and B (Table S21, S22, Fig. S10). In ChrUn, 2,691 HC and 675 LC gene models were
identified.
The quality of the RefSeq Annotation v1.1 gene set was benchmarked against BUSCO v3 (20)
10
representing 1,440 Embryophyta near-universal single-copy orthologs and previously published
annotated wheat gene sets (Fig. 2B, Fig. S11). 99% (1436) of the BUSCO v3 genes were
represented in at least one complete copy in RefSeq Annotation v1.1 and 90% (1292) in three
complete copies, a major improvement over the 25% (353) and 70% (1,014) identified in the
previous IWGSC (6) and TGACv1 (8) gene sets, respectively (Fig. 2B). Improved contiguity of
15
sequences in the immediate vicinity of genes was also found: 61% of the HC and LC genes were
flanked by at least 10 kb of sequence without Ns, in contrast to 37% and only 5% of TGACv1
and IWGSC CSS gene models, respectively (Fig. S12).
To further characterize the gene-space, a phylogenomic approach was applied to identify gene
20
homeologs and paralogs between and within the wheat sub-genomes, in addition to orthologs in
other plant genomes (Table S23, Fig. S13-S15). Analysis of a subset of 181,036 genes (“filtered
identified 39,238 homeologous groups, i.e. clades of A, B and D sub-genome orthologs deduced
from gene trees, containing a total of 113,653 genes (63% of the filtered set). Gene losses /
retention and gene gains (gene duplications) were determined for all homeologous loci of
IWGSC RefSeq v1.0 (Table 3) assuming the presence of a single gene copy at every
homeologous locus (referred to as a “triad”). The percentage of genes in homeologous groups for
5
all configurations (ratios) is highly similar, hence balanced, across the three sub-genomes: 63%
(A), 61% (B), and 66% (D). The slightly higher percentage of homeologs on the D sub-genome,
together with the lower number of pseudogenes (Table S22) is consistent with its more recent
hybridization with the A / B genome progenitor. Although the majority of genes are present in
homeologous groups, only 18,595 (47%) of the groups contained triads with one single gene
10
copy per sub-genome (1:1:1 configuration). 5,673 (15%) groups of homeologous genes exhibited
at least one sub-genome inparalog, i.e. a gene copy resulting from a tandem or segmental /
trans-duplication (1:1:N configuration). The three genomes exhibited similar levels of loss of
individual homeologs, affecting 10.7% (0:1:1), 10.3% (1:0:1), and 9.5% (1:1:0) of the
homeologous groups in the A, B and D sub-genomes, respectively (Table 3, Table S24, S25).
15
Among the 67,383 (37%) genes of the filtered set not present in homeologous groups, 31,140
genes also had no orthologs in species included in the comparisons outside of bread wheat and
comprised, mainly, gene fragments, non-protein-coding loci with open reading frames or other
gene calling artifacts. The remaining 36,243 genes had homologs outside of bread wheat and
appeared to be sub-genome specific (Table 3). Two of the genes in this category were granule 20
bound starch synthase, GBSS, on chromosome 4A (1:0:0, a gene that is a key determinant of
udon noodle quality) and ZIP4 within the Ph1 (Pairing homeologous 1) locus on chromosome 5B
(21)]. The phylogenomic analysis indicated the GBSS on 4A is a divergent translocated homeolog
originally located on chromosome 7B (Fig. S16); whereas, ZIP4 is a trans-duplication of a
chromosome 3B locus (Table S26). Both genes confer important properties on wheat and
illustrate the diversity in origin and function of gene models that are not in a 1:1:1 configuration.
No evidence was found for sub-genome dominance, as suggested for maize and other grasses
5
(22-24) as well as for wheat (25). Rather, our analysis supported a scenario of gradual gene loss
and gene movement among the sub-genomes that may have occurred either in the diploid
progenitor species, the tetraploid ancestor or following the final hexaploidization event in modern
bread wheat (Table 3, Table S24, S25).
The bread wheat genome contains 29,737 HC genes (27%) in tandem duplication, which is up to
10
10% higher than found for other monocotyledonous species (Table S27). Tandemly repeated
genes are most prevalent in the B genome (29%), contributing to its higher gene content and
larger number of 1:N:1 homeologous groups (Table 3). The postulated hybrid origin of the D
sub-genome as a result of inter-specific crossing with AB genome progenitors 1-2 My after they
diverged (26), is mirrored by the synonymous substitution rates of homeologous gene pairs (Fig.
15
S17). Homeologous groups with gene duplicates in at least one sub-genome (1:1:N, 1:N:1, N:1:1)
showed elevated evolutionary rates (for the sub-genome carrying the duplicate) compared to
strict 1:1:1 or 1:1 groups (Fig. S18-S22). Homeologs with recent duplicates also showed higher
levels of expression divergence (Fig. S23), consistent with gene / genome duplications acting as a
driver of functional innovation (27, 28).
20
Analysis of synteny between the seven triplets of homeologous chromosomes showed high levels
of conservation. There was no evidence for any major rearrangements since the A, B and D
inversions occurring on average every 74.8 Mb involving blocks of ten genes or more (mean
gene number 48.2 with a mean size of 10.5 Mb) (Fig. 1D, Table S28). Macro-synteny was
conserved across centromeric (C) regions, but collinearity (micro-synteny) broke down
specifically in these recombination-free, gene-poor regions, for all seven sets of homeologous
chromosomes (Fig. 1D, Fig. S24-S26, Table S29). Among the 113,653 homeologous genes, 80%
5
(90,232) were found organized in macro-synteny, i.e. still present at their ancestral position
(Table S24). At the micro-synteny scale, 72% (82,308) of the homeologs were organized in
collinear blocks i.e. intervals with a highly-conserved gene order (Fig. 1D). A higher proportion
of syntenic genes was found in the interstitial regions [short arm, R2a (14), 46% and long arm,
R2b (14), 61%] compared to the distal telomeric [short arm, R1 (14), 39% and long arm, R3 (14),
10
51%] and centromere regions [C (14), 29%], respectively, and the interstitial compartments
harbored larger syntenic blocks (Fig. S27, Fig. S28). The higher proportions of duplicated genes
in distal-terminal regions (34% and 27% versus 13-15% in the other regions; Fig. S29) exerted a
strong influence on the decay of syntenic block size and contributed to the higher sequence
variability in these regions. Overall, distal chromosomal regions are the preferential targets of
15
meiotic recombination and the fastest evolving compartments. As such, they represent the
genomic environment for creating sequence, hence, allelic diversity, providing the basis for
adaptability to changing environments.
Atlas of transcription reveals trait associated gene co-regulation networks
The gene annotation coupled with identification of homeologs and paralogs in IWGSC RefSeq
20
v1.0 provided a unique resource to study gene expression in genome-wide and sub-genome
contexts. A total of 850 RNA-Seq samples derived from 32 tissues at different growth stages
(Database S1, Fig. 3A, Table S30, S31, S32). Expression was observed for 94,114 (84.9%) HC
genes (Fig. S30) and for 77,920 (49.1%) LC genes, the latter showing lower expression breadth
and level [median 6 tissues; average 2.9 transcripts per million (tpm)] than the HC genes (median
20 tissues; average 8.2 tpm) (Fig. S31). This correlated with the higher average methylation
status of LC genes (Fig. S32, S33). A principal component analysis (PCA) identified tissue (Fig.
5
3B), rather than growth stage or stress (Fig. S34), as the main factor driving differentiated
expression between samples, consistent with studies in other organisms (29-32), with 31.0 % of
genes expressed in over 90% of tissues (average 16.9 tpm, ≥ 30 tissues), and 21.5% of genes
expressed in 10% or fewer tissues (average 0.22 tpm; ≤ 3 tissues; Fig. S31).
8,231 HC genes showed tissue-exclusive expression (Fig. S35), with reproductive tissues
10
(microspores, anther and stigma/ovary) accounting for around half of these, as observed in rice
(33). The tissue-exclusive genes were enriched for response to extra-cellular stimuli and
reproductive processes (Database S2). In contrast, 23,146 HC genes expressed across all 32
tissues were enriched for biological processes associated with house-keeping functions such as
protein translation and protein metabolic processes. Tissue specific genes were shorter (1,147 ± 8
15
bp), had fewer exons (2.76 ± 0.3), and were expressed at lower levels (3.4 ± 0.1 tpm) compared
to ubiquitous genes (1,429 ± 7 bp; 7.87 ± 0.4 exons, 17.9 ± 0.4 tpm) (Fig. S35).
Genes located in distal regions R1 and R3 (Fig. S25, Table S29) showed significantly lower
expression breadth than those in the proximal regions (15.7 and 20.7 tissues, respectively) (Fig.
3C; Fig. S36). This correlated with enrichment of Gene Ontology (GO) slim terms such as ‘cell
20
cycle’, ‘translation’, and ‘photosynthesis’ for genes in the proximal regions, whereas, genes
enriched for ‘response to stress’ and ‘external stimuli’ were found in the highly recombinant
also correlated with the distribution of the repressive H3K27me3 (R= -0.76, P < 2.2E-16) and
with the active H3K36me3 and H3K9ac (R= 0.9 and 0.83, respectively, P < 2.2E-16) histone
marks (Fig. S37).
Global patterns of co-expression (34) were determined using a weighted gene co-expression
network analysis (WGCNA) on 94,114 expressed HC genes. 58% of these genes (54,401) could
5
be assigned to 38 modules (Fig. 3D, Database S4) and, consistent with the PCA, tissues were the
major driver of module identity (Fig. 3D, Fig. S38 – S40). The analysis focused initially on the
9,009 triads (syntenic and non-syntenic) with a 1:1:1 A:B:D relationship and for which all
homeologs were assigned to a module. 16.4% of the triads had at least one homeolog in a
divergent module with the B homeolog most likely to be divergent (37.4% B divergent vs 31.7%
10
A divergent and 30.9% D divergent triads, χ2 P = 0.007). However, the expression profiles of the
majority (83.6%) of triads were relatively consistent with all homeologs in the same (57.6%) or a
closely related module (26.0%). The proportion of homeologs found within the same module was
higher than expected, pointing to a highly-conserved expression pattern of homeologs across the
850 RNA-Seq samples (Fig. 3E, Table S34). Triads with at least one gene in a non-syntenic
15
position had more divergent expression patterns compared to syntenic triads (21.2% vs 16.2%, χ2
P <0.001) and fewer triads with all homeologs in the same module (48.7%) compared to syntenic
triads (58.0%, χ2 P= 0.009). Similar patterns were observed in the 1,933 duplets having a 1:1
relationship between only two homeologs (Table S34). These results were consistent with
syntenic homeologs showing similar expression patterns while more dramatic changes in
20
chromosome context associate with divergent expression and possible sub- or
To explore the potential of the WGCNA network for identifying novel pathways in wheat, a
search was undertaken for modules containing known regulators of wheat flowering time [eg.
PPD1, (35); FT (18); Fig. 3F]. Genes belonging to this pathway were grouped into specific
modules. The upstream genes (PHYB, PHYC, PPD1, ELF3, VRN2) were present mainly in
modules 1 and 5 and were most highly correlated with expression in leaf/shoot tissues (0.68 and
5
0.67 respectively, Padj<E-108). In contrast, the integrating gene FT and downstream genes
VRN1, FUL2 and FUL3 were found in modules 8 and 11, most highly correlated with expression
in spikes (0.69 and 0.65 respectively, Padj<E-101, Table S35). The MADS_II TF family
generally associated with the above pathways, was examined more closely with a focus on the
gene tree OG0000041 containing 54 of the 118 MADS_II genes in wheat. 24 MADS_II genes
10
from modules 8 and 11 were identified within this gene tree, clustering into two main clades
along with Arabidopsis and rice orthologs associated with floral patterning (Fig. S41; Database
S5). Within these clades, other MADS_II genes were found that were not in modules 8 or 11
(Fig. 3G), indicating a different pattern of co-expression. None of the 24 MADS_II genes had a
simple 1:1 ortholog in Arabidopsis, suggesting that some wheat orthologs function in flowering
15
(those within modules 8 and 11), whereas others could have developed different functions,
despite being phylogenetically closely related. Thus, these data provide a new framework to
identify and prioritize the most likely functional orthologs of known model system genes within
polyploid wheat, to characterize them functionally (36) and to dissect genetic factors controlling
important agronomic traits (37, 38). A more detailed analysis of tissue-specific and stress-related
20
networks is presented elsewhere (19) and provides a framework for defining quantitative
variation and interactions between homeologs for many agronomic traits (39).
Gene duplication and gene family expansion are important mechanisms of evolution and
environmental adaptation, as well as major contributors to phenotypic diversity (40, 41). In a
phylogenomic comparative analysis, wheat gene family size and wheat-specific gene family
expansion / contraction were benchmarked against nine other grass genomes, including five
closely related diploid Triticeae species (Table S23, Fig. S13-15, S42). A total of 30,597 gene
5
families (groups of orthologous genes traced to a last common ancestor in the evolutionary
hierarchy of the compared taxa) were defined with 26,080 families containing gene members
from at least one of the three wheat sub-genomes (Tables S36-S38). Among the 8,592 expanded
wheat gene families (33% of all families), 6,216 were expanded in all three A, B and D
sub-genomes (24%; either shared with the wild ancestor or specific to bread wheat, Fig. 4A). Another
10
1,109 were expanded in only one of the wheat sub-genomes and 2,102 gene families were also
expanded in either the A or the D genome lineages (i.e. T. urartu or A. tauschii) (Fig. 4A, Table
S36, Fig. S43). Overall, only 78 gene families were contracted in wheat. Gene Ontology (GO;
ontology of biomedical terms for the areas ‘cellular component’, ‘biological process’, ‘molecular
function’), Plant Ontology (PO; ontology terms describing anatomical structures and growth and
15
developmental stages across Viridiplantae) and Plant Trait Ontology (TO; ontology of controlled
vocabulary to describe phenotypic traits and QTLs that were physically mapped to a gene in
flowering plant species) analysis identified 1,169 distinct GO/PO/TO terms (15% of all assigned
terms) enriched in genes belonging to expanded wheat gene families (Fig. 4B, Fig. S44, S45). ‘A
sub-genome’ or ‘A-lineage’ expanded gene families showed a bias for terms associated with seed
20
formation [overrepresentation of the TO term “plant embryo morphology” (TO:0000064) and
several seed, endosperm, and embryo-developmental GO terms] (Fig. S46). Similarly, ‘B
vegetative growth and development (Database S6, Fig. S47). Gene families that were expanded
in all wheat sub-genomes were enriched for 14 TO terms associated with yield-affecting
morphological traits and five terms associated with fertility and abiotic stress tolerance (Fig. 4B),
which was also mirrored by enrichment for GO and PO terms associated with adaptation to
abiotic stress (‘salt stress’, ‘cold stress’) and grain yield and quality (‘seed maturation’,
5
‘dormancy’ and ‘germination’). The relationship between the patterns of enriched TO/PO/GO
terms for expanded wheat gene families and key characteristics of wheat performance (Fig.
S45-S51) provides a novel resource (Database S6) to explore future QTL mapping and candidate gene
identification for breeding.
Many gene families with high relevance to wheat breeding and improvement were among the
10
expanded group and their genomic distribution was analyzed in greater detail (Fig. 4C, Fig.
S52-S54). Disease resistance related NLR (nucleotide-binding site leucine-rich repeat)-like loci and
WAK (wall-associated receptor)-like genes were clustered in high numbers at the distal (R1 and
R3) regions of all chromosome arms, with NLRs often co-localizing with known disease
resistance loci (Fig. 4C). The Restorer of Fertility-Like (RFL) sub-clade of P class PPR proteins,
15
potentially of interest for hybrid wheat production, comprised 207 genes, nearly three-fold more
per haploid sub-genome than in any other plant genome analyzed to date (42, 43). They localized
mainly as clusters of genes in regions on the group 1, 2, and 6 chromosomes, which are known to
carry fertility restoration QTLs in wheat (Fig. 4C, Fig. S54). Among the dehydrin gene family,
implicated with drought tolerance in plants, 25 genes that formed well defined clusters on
20
chromosomes 6A, 6B and 6D (Fig. S53, S55) showed early increased expression under severe
drought stress (44). As the structural variation in the CBF genes of wheat is known to be
revealed by IWGSC RefSeqv1.0 provides a basis for targeted allele mining for novel CBF
haplotypes from highly frost tolerant wheat genetic resources. Lastly, high levels of expansion
and variation in members of grain prolamin gene families (Fig. S52, Table S37) that can either be
related to the response to heat stress or whose protein epitopes are associated with levels of
coeliac disease and food allergies (46), provide candidates for future selection in breeding
5
programs. From these few examples, it is evident that significant flexibility in gene copy numbers
within the wheat genome has contributed to the adaptability of wheat to produce high quality
grain under diverse climates and environments (47). Knowledge of the complex picture of the
genome-wide distribution of gene families (Fig. 4C), that needs to be considered for selection in
breeding programs in the context of distribution of recombination and allelic diversity (48) can
10
now be applied in wheat improvement strategies. This is especially true if ‘must-have traits’ that
are allocated in chromosomal compartments with highly contrasting characteristics, are fixed in
repulsion, or are found only in incompatible genepools of the respective breeding germplasm.
Rapid trait improvement using physically resolved markers and genome editing 15
The selection and modification of genetic variation underlying agronomic traits in breeding
programs is often complicated if phenotypic selection depends on the expression of multiple loci
with quantitative effects that can be strongly influenced by the environment. This dilemma can be
overcome if DNA markers in strong linkage disequilibrium with the phenotype are identified
through forward genetic approaches, or if the underlying genes can be targeted through genome
20
editing. The potential for IWGSC RefSeq v1.0, together with the detailed genome annotation, to
accelerate the identification of potential candidate genes underlying important agronomic traits
for stem solidness (SSt1) conferring resistance to drought stress and to insect damage (49) that
was disrupted in previous wheat assemblies by a lack of scaffold ordering and annotation, partial
assembly, and/or incomplete gene models (Fig. S57, Table S39, S40). In IWGSC RefSeq v1.0,
SSt1 contains 160 HC genes (Table S41), of which 26 were differentially expressed (adj p <0.01)
between wheat lines with contrasting phenotypes. One of the differentially expressed genes,
5
TraesCS3B01G608800 was present as a single copy in RefSeq v1.0, but showed copy number
variation (CNV) associated with stem-solidness in a diverse panel of hexaploid cultivars (Fig.
5A, Fig. S58, Table S42). Using IWGSC RefSeq v1.0, we developed a diagnostic SNP marker
physically linked to the CNV that has been deployed to select for stem-solidness in wheat
breeding programs (Fig. 5B).
10
Knowledge from model species can also be used to annotate genes and provide a route to trait
enhancement through reverse genetics. The approach here targeted flowering time which is
important for crop adaptation to diverse environments and is well-studied in model plants. Six
wheat homologues of the Flowering Locus C (FLC) gene have been identified as having a role in
the vernalization response, a critical process regulating flowering time (50). IWGSC RefSeqv1.0
15
was used to refine the annotation of these six sequences to identify four HC genes and then to
design guide RNAs to specifically target by CRISPR/Cas9-based gene editing one of these genes,
TaAGL33, on all sub-genomes [TraesCS3A01G435000 (A),TraesCS3B01G470000 (B), and
TraesCS3D01G428000 (D)] (Fig. 5C). The three homeologswere sequenced to describe eight
gene edits in five independent events. Editing was obtained at the targeted gene and led to
20
truncated proteins after the MADS box through small deletions/insertions (Fig. 5D). Expression
of all homeologs was high prior to vernalization, dropped during vernalization, and remained low
not affected by the genome edits (data not shown). Plants with the two D-genome editing events
flowered 2-3 days earlier than controls (Fig. 5E). Further refinement of the editing approach will
help to fully understand the significance of the TaAGL33 gene for vernalization in monocots.
These results exemplify how the IWGSC RefSeqv1.0 could accelerate the development of
diagnostic markers and the design of targets for genome editing for traits relevant to breeding.
5
Conclusions
IWGSC RefSeq v1.0 is a resource that has a potential for disruptive innovation in wheat
improvement. By necessity, breeders work with the genome at the whole chromosome level, as
each new cross involves the modification of genome-wide gene networks that control the
expression of complex traits such as yield. With the annotated and ordered reference genome
10
sequence in place, researchers and breeders can now easily access sequence level information to
define changes in the genomes of lines in their programs. While several hundred wheat QTLs
have been published, only a small number of genes have been cloned and functionally
characterized. IWGSC RefSeq v1.0 underpins immediate application by providing access to
regulatory regions and it will serve as the backbone to anchor all known QTLs to one common
15
annotated reference. Combining this knowledge with the distribution of meiotic recombination
frequency, and genomic diversity (48) will enable breeders to tackle more efficiently the
challenges imposed by the need to balance the parallel selection processes for adaptation to biotic
and abiotic stress, end-use quality, and yield improvement. Strategies can now be defined more
precisely to bring desirable alleles into coupling phase, especially in less recombinant regions of
20
the wheat genome. Here the full potential of the newly available genome information may be
realised by the implementation of DNA marker platforms and targeted breeding technologies,
Methods Summary
Whole genome sequencing of cultivar 'Chinese Spring' by short read sequencing-by-synthesis
provided the data for de novo genome assembly and scaffolding using the software package
DenovoMAGIC2TM. The assembly was super-scaffolded and anchored into 21 pseudomolecules
using high density genetic (POPSEQ) and physical (Hi-C and 21 chromosome-specific physical
5
maps) mapping information and by integrating additional genomic resources. Validation of the
assembly used independent genetic (de novo GBS maps) and physical mapping evidences
(Radiation hybrid maps, BioNano ‘optical maps’ for group 7 homeologous chromosomes). The
genome assembly was annotated for genes, repetitive DNA, and other genomic features and
in-depth comparative analyses were carried out to analyze the distribution of genes, recombination,
10
position and size of centromeres and the expansion/contraction of wheat gene families. An atlas
of wheat gene transcription was built from an extensive panel of 850 independent transcriptome
datasets which was then used to study gene co-expression networks. Furthermore, the assembly
editing of genes implied in flowering time control in wheat. Detailed methodological procedures
are described in the supplementary materials.
References and Notes:
1. Food and Agriculture Organization of the United Nations, FAOSTAT Statistics Database,
5
78, http://www.fao.org/faostat/en/#data/FBS, http://www.fao.org/faostat/en/#data/QC
(2017).
2. B. Shiferaw et al., Crops that feed the world 10. Past successes and future challenges to the role played by wheat in global food security. Food Security5, 291-317 (2013).
3. G. N. Atlin, J. E. Cairns, B. Das, Rapid breeding and varietal replacement are critical to
10
adaptation of cropping systems in the developing world to climate change. Global Food Security12, 31-37 (2017).
4. J. M. Hickey, T. Chiurugwi, I. Mackay, W. Powell, C. B. P. W. P. Implementing
Genomic Selection in, Genomic prediction unifies animal and plant breeding programs to form platforms for biological discovery. Nat Genet49, 1297-1303 (2017).
15
5. K. Arumuganathan, E. D. Earle, Nuclear DNA content of some important plant species.
Plant Molecular Biology Reporter9, 208-218 (1991).
6. The International Wheat Genome Sequencing Consortium, A chromosome-based draft
sequence of the hexaploid bread wheat (Triticum aestivum) genome. Science345, (2014).
7. J. A. Chapman et al., A whole-genome shotgun approach for assembling and anchoring
20
the hexaploid bread wheat genome. Genome Biology16, 26 (2015).
8. B. J. Clavijo et al., An improved assembly and annotation of the allohexaploid wheat genome identifies complete families of agronomic genes and provides genomic evidence for chromosomal translocations. Genome Research27, 885-896 (2017).
9. A. V. Zimin et al., The first near-complete assembly of the hexaploid bread wheat
25
genome, Triticum aestivum. GigaScience6, 1-7 (2017).
10. E. Paux et al., Insertion site-based polymorphism markers open new perspectives for genome saturation and marker-assisted selection in wheat. Plant Biotechnology Journal8, 196-210 (2010).
11. The Arabidopsis Genome Initiative, Analysis of the genome sequence of the flowering
30
12. International Rice Genome Sequencing Project, The map-based sequence of the rice genome.
Nature436, 793-800 (2005).
13. T. Wicker et al., Impact of transposable elements on genome structure and evolution in wheat. Sciencesubmitted as companion paper, (2018).
14. F. Choulet et al., Structural and functional partitioning of bread wheat chromosome 3B.
5
Science345, (2014).
15. X. Guo et al., De Novo Centromere Formation and Centromeric Sequence Expansion in
Wheat and its Wide Hybrids. PLOS Genetics12, e1005997 (2016).
16. K. Wang, Y. Wu, W. Zhang, R. K. Dawe, J. Jiang, Maize centromeres expand and adopt a
uniform size in the genetic background of oat. Genome Research24, 107-116 (2014).
10
17. Y. Jiao et al., Improved maize reference genome with single-molecule technologies.
Natureadvance online publication, (2017).
18. L. Yan et al., The wheat and barley vernalization gene VRN3 is an orthologue of FT.
Proceedings of the National Academy of Sciences103, 19581-19586 (2006).
19. R. Ramirez-Gonzalez et al., The transcriptional landscape of hexaploid wheat across
15
tissues and cultivars. Sciencesubmitted as companion paper, (2018).
20. F. A. Simão, R. M. Waterhouse, P. Ioannidis, E. V. Kriventseva, E. M. Zdobnov, BUSCO: assessing genome assembly and annotation completeness with single-copy orthologs. Bioinformatics31, 3210-3212 (2015).
21. M.-D. Rey et al., Exploiting the ZIP4 homologue within the wheat Ph1 locus has
20
identified two lines exhibiting homoeologous crossover in wheat-wild relative hybrids.
Molecular Breeding37, 95 (2017).
22. M. R. Woodhouse et al., Following tetraploidy in maize, a short deletion mechanism removed genes preferentially from one of the two homeologs. PLOS Biology8, e1000409 (2010).
25
23. J. C. Schnable, M. Freeling, E. Lyons, Genome-wide analysis of syntenic gene deletion in the grasses. Genome Biology and Evolution4, 265-277 (2012).
24. J. Schnable, X. Wang, J. Pires, M. Freeling, Escape from preferential retention following repeated whole genome duplications in plants. Frontiers in Plant Science3, (2012).
25. C. Pont, J. Salse, Wheat paleohistory created asymmetrical genomic evolution. Current 30
Opinion in Plant Biology36, 29-37 (2017).
26. T. Marcussen et al., Ancient hybridizations among the ancestral genomes of bread wheat.
27. Y. Van de Peer, S. Maere, A. Meyer, The evolutionary significance of ancient genome duplications. Nature Reviews Genetics10, 725 (2009).
28. P. S. Soltis, D. E. Soltis, Ancient WGD events as drivers of key innovations in angiosperms. Current Opinion in Plant Biology30, 159-165 (2016).
29. M. Melé et al., The human transcriptome across tissues and individuals. Science348,
660-5
665 (2015).
30. S. C. Stelpflug et al., An expanded maize gene expression atlas based on RNA sequencing and its use to explore root development. The Plant Genome9, (2016).
31. F. He et al., Large-scale atlas of microarray data reveals the distinct expression landscape of different tissues in Arabidopsis. The Plant Journal86, 472-480 (2016).
10
32. X. Wang et al., Comparative genomic analysis of C4 photosynthetic pathway evolution in grasses. Genome Biology10, R68 (2009).
33. L. Xia et al., Rice Expression Database (RED): An integrated RNA-Seq-derived gene expression database for rice. Journal of Genetics and Genomics44, 235-241 (2017).
34. R. J. Schaefer, J.-M. Michno, C. L. Myers, Unraveling gene function in agricultural
15
species using gene co-expression networks. Biochimica et Biophysica Acta (BBA) - Gene Regulatory Mechanisms1860, 53-63 (2017).
35. J. Beales, A. Turner, S. Griffiths, J. Snape, D. Laurie, A pseudo-response regulator is misexpressed in the photoperiod insensitive Ppd-D1a mutant of wheat (Triticum aestivum
L.). Theoretical and Applied Genetics115, 721-733 (2007).
20
36. K. V. Krasileva et al., Uncovering hidden variation in polyploid wheat. Proceedings of the National Academy of Sciences114, E913-E921 (2017).
37. Y. Wang et al., Transcriptome Association Identifies Regulators of Wheat Spike Architecture. Plant Physiology175, 746-757 (2017).
38. M. Pfeifer et al., Genome interplay in the grain transcriptome of hexaploid bread wheat.
25
Science345, (2014).
39. P. Borrill, N. Adamski, C. Uauy, Genomics as the key to unlocking the polyploid potential of wheat. New Phytologist208, 1008-1022 (2015).
40. F. A. Kondrashov, Gene duplication as a mechanism of genomic adaptation to a changing
environment. Proceedings of the Royal Society B: Biological Sciences279, 5048-5057
30
(2012).
42. T. Sykes et al., In-silico identification of candidate genes for fertility restoration in cytoplasmic male sterile perennial ryegrass (Lolium perenne L.). Genome Biology and Evolution, (2016).
43. J. Melonek, J. D. Stone, I. Small, Evolutionary plasticity of restorer-of-fertility-like proteins in rice. Scientific Reports6, 35152 (2016).
5
44. S. Gálvez et al., The genomic architecture of field drought responses for wheat. Science submitted as companion paper, (2018).
45. T. Würschum, C. F. H. Longin, V. Hahn, M. R. Tucker, W. L. Leiser, Copy number
variations of CBF genes at the Fr-A2 locus are essential components of winter hardiness in wheat. The Plant Journal89, 764-773 (2017).
10
46. A. Juhász et al., Wheat proteins as a source of food intolerance: Genome mapping and influence of environment. Science Advancessubmitted as companion paper, (2018).
47. M. Feldman, A. A. Levy, in Alien Introgression in Wheat: Cytogenetics, Molecular Biology, and Genomics, M. Molnár-Láng, C. Ceoloni, J. Doležel, Eds. (Springer International Publishing, Cham, 2015), pp. 21-76.
15
48. C. Pont et al., Tracing the ancestry of modern cultivated bread wheats. Sciencesubmitted as companion paper, (2018).
49. K. T. Nilsen et al., High density mapping and haplotype analysis of the major
stem-solidness locus SSt1 in durum and common wheat. PLOS ONE12, e0175285 (2017).
50. N. Sharma et al., A flowering locus C homolog is a vernalization-regulated repressor in
20
Brachypodium and is cold regulated in wheat. Plant Physiology173, 1301-1315 (2017).
51. H. Puchta, Applying CRISPR/Cas for genome engineering in plants: the best is yet to come. Current Opinion in Plant Biology36, 1-8 (2017).
52. H.-Q. Ling et al., Draft genome of the wheat A-genome progenitor Triticum urartu.
Nature496, 87 (2013).
25
53. J. Jia et al., Aegilops tauschii draft genome sequence reveals a gene repertoire for wheat adaptation. Nature496, 91-95 (2013).
54. Y. Ishida, M. Tsunashima, Y. Hiei, T. Komari, in Agrobacterium Protocols: Volume 1, K. Wang, Ed. (Springer New York, New York, NY, 2015), pp. 189-198.
55. M. Alaux et al., Linking the International Wheat Genome Sequencing Consortium bread
30
wheat reference genome sequence to wheat genetic and phenomic data. Genome Biology
submitted as companion paper, (2018).
57. F. Choulet et al., Megabase Level Sequencing Reveals Contrasted Organization and Evolution Patterns of the Wheat Gene and Transposable Element Spaces. The Plant Cell 22, 1686-1701 (2010).
58. G. Keeble-Gagnère et al., Optical and physical mapping with local finishing enables megabase-scale resolution of agronomically important regions on wheat chromosome 7A.
5
Genome Biologysubmitted as companion paper, (2018).
59. R. Kalhor, H. Tjong, N. Jayathilaka, F. Alber, L. Chen, Genome architectures revealed by tethered chromosome conformation capture and population-based modeling. Nat Biotech 30, 90-98 (2012).
60. E. Lieberman-Aiden et al., Comprehensive Mapping of Long-Range Interactions Reveals
10
Folding Principles of the Human Genome. Science326, 289-293 (2009).
61. S. Beier et al., Construction of a map-based reference genome sequence for barley, Hordeum vulgare L. Scientific Data4, 170044 (2017).
62. J. Šafář et al., Dissecting large and complex genomes: flow sorting and BAC cloning of individual chromosomes from bread wheat. The Plant Journal39, 960-968 (2004).
15
63. J. Šafář et al., Development of chromosome-specific BAC resources for genomics of bread wheat. Cytogenetic and Genome Research129, 211-223 (2010).
64. M.-C. Luo et al., High-throughput fingerprinting of bacterial artificial chromosomes using the snapshot labeling kit and sizing of restriction fragments by capillary electrophoresis.
Genomics82, 378 (2003).
20
65. J. van Oeveren et al., Sequence-based physical mapping of complex genomes by whole genome profiling. Genome Research21, 618-625 (2011).
66. C. Soderlund, S. Humphray, I. Dunham, L. French, Contigs built with fingerprints, markers, and FPC V4.7. Genome Res11, 934 - 941 (2000).
67. Z. Frenkel, E. Paux, D. Mester, C. Feuillet, A. Korol, LTC: a novel algorithm to improve
25
the efficiency of contig assembly for physical mapping in complex genomes. BMC Bioinformatics11, 584 (2010).
68. H. Staňková et al., BioNano genome mapping of individual chromosomes supports
physical mapping and sequence assembly in complex plant genomes. Plant Biotechnology Journal14, 1523-1531 (2016).
30
69. N. Poursarebani et al., Whole-genome profiling and shotgun sequencing delivers an
anchored, gene-decorated, physical map assembly of bread wheat chromosome 6A. The
Plant Journal79, 334-347 (2014).
70. F. Kobayashi et al., A high-resolution physical map integrating an anchored chromosome
with the BAC physical maps of wheat chromosome 6B. BMC Genomics16, 595 (2015).
71. M. Kubaláková, J. Vrána, J. Číhalíková, H. Šimková, J. Doležel, Flow karyotyping and chromosome sorting in bread wheat (Triticum aestivum L.). Theoretical and Applied Genetics104, 1362-1372 (2002).
72. V. K. Tiwari et al., A whole-genome, radiation hybrid mapping resource of hexaploid wheat. The Plant Journal86, 195-207 (2016).
5
73. H. Rimbert et al., High throughput SNP discovery and genotyping in hexaploid wheat.
PLOS ONEin press, (2017).
74. S. de Givry, M. Bouchez, P. Chabrier, D. Milan, T. Schiex, Carhta Gene: multipopulation integrated genetic and radiation hybrid mapping. Bioinformatics21, 1703-1704 (2005).
75. M. E. Sorrells et al., Reconstruction of the Synthetic W7984 × Opata M85 wheat
10
reference population. Genome54, 875-882 (2011).
76. J. A. Poland, P. J. Brown, M. E. Sorrells, J.-L. Jannink, Development of high-density genetic maps for barley and wheat using a novel two-enzyme genotyping-by-sequencing approach. PLoS ONE7, e32253 (2012).
77. Y. Wu, P. R. Bhat, T. J. Close, S. Lonardi, Efficient and accurate construction of genetic
15
linkage maps from the minimum spanning tree of a graph. PLoS Genet4, e1000212 (2008).
78. J. Doležel, M. Kubaláková, E. Paux, J. Bartoš, C. Feuillet, Chromosome-based genomics in the cereals. Chromosome Research15, 51-66 (2007).
79. A. A. Myburg et al., The genome of Eucalyptus grandis. Nature510, 356 (2014).
20
80. H. Li, R. Durbin, Fast and accurate short read alignment with Burrows–Wheeler
transform. Bioinformatics25, 1754-1760 (2010).
81. H. Li et al., The Sequence Alignment/Map format and SAMtools. Bioinformatics25, 2078-2079 (2009).
82. R. Whitford et al., Hybrid breeding in wheat: technologies to improve hybrid wheat seed
25
production. Journal of Experimental Botany64, 5411-5428 (2013).
83. J. N. Burton et al., Chromosome-scale scaffolding of de novo genome assemblies based on chromatin interactions. Nature Biotechnology31, 1119 (2013).
84. A. R. Quinlan, I. M. Hall, BEDTools: a flexible suite of utilities for comparing genomic features. Bioinformatics26, 841-842 (2010).
30
86. S. Kurtz et al., Versatile and open software for comparing large genomes. Genome Biology5, R12 (2004).
87. M. Martin, Cutadapt removes adapter sequences from high-throughput sequencing reads.
EMBnet.journal17, 10-12 (2011 ).
88. P. Leroy et al., TriAnnot: A Versatile and High Performance Pipeline for the Automated
5
Annotation of Plant Genomes. Frontiers in Plant Science3, 5 (2012).
89. A. F. Smit, Identification of a new, abundant superfamily of mammalian
LTR-transposons. Nucleic Acids Research21, 1863-1872 (1993).
90. S. F. Altschul et al., Gapped BLAST and PSI-BLAST: a new generation of protein database search programs. Nucl. Acids Res.25, 3389-3402 (1997).
10
91. L. Pingault et al., Deep transcriptome sequencing provides new insights into the structural and functional organization of the wheat genome. Genome Biology16, 29 (2015).
92. L. Dong et al., Single-molecule real-time transcript sequencing facilitates common wheat genome annotation and grain transcriptome research. BMC Genomics16, 1039 (2015).
93. The International Barley Genome Sequencing Consortium (IBSC) et al., A physical,
15
genetical and functional sequence assembly of the barley genome. Nature (London)491, 711-716 (2012).
94. G. S. C. Slater, E. Birney, Automated generation of heuristics for biological sequence comparison. BMC Bioinformatics6, 31 (2005).
95. M. Stanke, S. Waack, Gene prediction with a hidden Markov model and a new intron
20
submodel. Bioinformatics2, 215-225 (2003).
96. N. Amano, T. Tanaka, H. Numa, H. Sakai, T. Itoh, Efficient plant gene identification based on interspecies mapping of full-length cDNAs. DNA Research17, 271-279 (2010).
97. T. D. Wu, C. K. Watanabe, GMAP: a genomic mapping and alignment program for
mRNA and EST sequences. Bioinformatics21, 1859-1875 (2005).
25
98. C. Trapnell et al., Transcript assembly and quantification by RNA-Seq reveals unannotated transcripts and isoform switching during cell differentiation. Nature Biotechnology28, 511 (2010).
99. D. Kim, B. Langmead, S. L. Salzberg, HISAT: a fast spliced aligner with low memory
requirements. Nature Methods12, 357 (2015).
30
101. M. Pertea et al., StringTie enables improved reconstruction of a transcriptome from RNA-seq reads. Nature Biotechnology33, 290 (2015).
102. The UniProt Consortium, UniProt: the universal protein knowledgebase. Nucleic Acids Research45, D158-D169 (2017).
103. G. Gremme, V. Brendel, M. E. Sparks, S. Kurtz, Engineering a software tool for gene
5
structure prediction in higher organisms. Information and Software Technology47, 965-978 (2005).
104. J. Keilwagen et al., Using intron position conservation for homology-based gene prediction. Nucleic Acids Research44, e89-e89 (2016).
105. K. Mochida, T. Yoshida, T. Sakurai, Y. Ogihara, K. Shinozaki, TriFLDB: a database of
10
clustered full-length coding sequences from Triticeae with applications to comparative grass genomics. Plant Physiology150, 1135-1146 (2009).
106. S. Ghosh, C.-K. K. Chan, in Plant Bioinformatics: Methods and Protocols, D. Edwards, Ed. (Springer New York, New York, NY, 2016), pp. 339-361.
107. S. R. Eddy, Accelerated Profile HMM Searches. PLOS Computational Biology7,
15
e1002195 (2011).
108. L. Venturini, S. Caim, G. Kaithakottil, D. L. Mapleson, D. Swarbreck, Leveraging
multiple transcriptome assembly methods for improved gene structure annotation. bioRxiv doi.org/10.1101/216994, (2017).
109. D. Mapleson, L. Venturini, G. Kaithakottil, D. Swarbreck, Efficient and accurate
20
detection of splice junctions from RNAseq with Portcullis. bioRxiv doi.org/10.1101/217620, (2017).
110. A. Kozomara, S. Griffiths-Jones, miRBase: integrating microRNA annotation and
deep-sequencing data. Nucleic Acids Research39, D152-D157 (2011).
111. S. J. Lucas, H. Budak, Sorting the wheat from the chaff: identifying miRNAs in genomic
25
survey sequences of Triticum aestivum chromosome 1AL. PLOS ONE7, e40859 (2012).
112. N. R. Markham, M. Zuker, in Bioinformatics: Structure, Function and Applications, J. M. Keith, Ed. (Humana Press, Totowa, NJ, 2008), pp. 3-31.
113. H. B. Cagirici, S. Biyiklioglu, H. Budak, Assembly and annotation of transcriptome provided evidence of miRNA mobility between wheat and wheat stem sawfly. Frontiers 30
in Plant Science8, 1653 (2017).
114. B. A. Akpinar, M. Kantar, H. Budak, Root precursors of microRNAs in wild emmer and
115. T. M. Lowe, S. R. Eddy, tRNAscan-SE: a program for improved detection of transfer RNA genes in genomic sequence. Nucleic Acids Research25, 955-964 (1997).
116. The Gene Ontology Consortium, Expansion of the Gene Ontology knowledgebase and
resources. Nucleic Acids Research45, D331-D338 (2017).
117. L. Cooper et al., The Plant Ontology as a tool for comparative plant anatomy and
5
genomic analyses. Plant and Cell Physiology54, e1-e1 (2013).
118. E. Arnaud et al., Towards a reference Plant Trait Ontology for modeling knowledge of plant traits and phenotypes. DOI:10.13140/2.1.2550.3525, (2012).
119. P. Borrill, R. Ramirez-Gonzalez, C. Uauy, expVIP: a customizable RNA-seq data
analysis and visualization platform. Plant Physiology170, 2172-2186 (2016).
10
120. N. L. Bray, H. Pimentel, P. Melsted, L. Pachter, Near-optimal probabilistic RNA-seq quantification. Nat Biotech34, 525-527 (2016).
121. P. Langfelder, S. Horvath, WGCNA: an R package for weighted correlation network
analysis. BMC Bioinformatics9, 559 (2008).
122. M. I. Love, W. Huber, S. Anders, Moderated estimation of fold change and dispersion for
15
RNA-seq data with DESeq2. Genome Biology15, 550 (2014).
123. Y. Benjamini, D. Yekutieli, The Control of the false discovery rate in multiple testing under dependency. The Annals of Statistics29, 1165-1188 (2001).
124. F. Krueger, S. R. Andrews, Bismark: a flexible aligner and methylation caller for Bisulfite-Seq applications. Bioinformatics27, 1571-1572 (2011).
20
125. A. Veluchamy et al., LHP1 regulates H3K27me3 spreading and shapes the
three-dimensional conformation of the Arabidopsis genome. PLOS ONE11, e0158936 (2016).
126. A. M. Bolger, M. Lohse, B. Usadel, Trimmomatic: a flexible trimmer for Illumina sequence data. Bioinformatics30, 2114-2120 (2014).
127. B. Langmead, S. L. Salzberg, Fast gapped-read alignment with Bowtie 2. Nature Methods 25
9, 357 (2012).
128. A. D. Zimmer et al., Reannotation and extended community resources for the genome of the non-seed plant Physcomitrella patens provide insights into the evolution of plant gene structures and functions. BMC Genomics14, 498 (2013).
129. J. S. Bernardes, F. R. J. Vieira, G. Zaverucha, A. Carbone, A multi-objective optimization
30
130. D. M. Emms, S. Kelly, OrthoFinder: solving fundamental biases in whole genome comparisons dramatically improves orthogroup inference accuracy. Genome Biology16, 157 (2015).
131. J. Huerta-Cepas, H. Dopazo, J. Dopazo, T. Gabaldón, The human phylome. Genome
Biology8, R109 (2007).
5
132. J. Huerta-Cepas, F. Serra, P. Bork, ETE 3: reconstruction, analysis, and visualization of phylogenomic data. Molecular Biology and Evolution33, 1635-1638 (2016).
133. S. Mirarab, T. Warnow, ASTRAL-II: coalescent-based species tree estimation with many
hundreds of taxa and thousands of genes. Bioinformatics31, i44-i52 (2015).
134. D. Lang et al., Genome-wide phylogenetic comparative analysis of plant transcriptional
10
regulation: a timeline of loss, gain, expansion, and correlation with complexity. Genome Biology and Evolution2, 488-503 (2010).
135. J. T. Garland, A. W. Dickerman, C. M. Janis, J. A. Jones, Phylogenetic analysis of covariance by computer simulation. Systematic Biology42, 265-292 (1993).
136. S. Grossmann, S. Bauer, P. N. Robinson, M. Vingron, Improved detection of
15
overrepresentation of Gene-Ontology annotations with parent–child analysis.
Bioinformatics23, 3024-3031 (2007).
137. S. Aibar, C. Fontanillo, C. Droste, J. De Las Rivas, Functional Gene Networks: R/Bioc package to generate and analyse gene networks derived from functional enrichment and clustering. Bioinformatics31, 1686-1688 (2015).
20
138. G. Su, A. Kuchinsky, J. H. Morris, D. J. States, F. Meng, GLay: community structure analysis of biological networks. Bioinformatics26, 3135-3137 (2010).
139. N.-p. D. Nguyen, S. Mirarab, K. Kumar, T. Warnow, Ultra-large alignments using
phylogeny-aware profiles. Genome Biology16, 124 (2015).
140. M. N. Price, P. S. Dehal, A. P. Arkin, FastTree 2 – approximately maximum-likelihood
25
trees for large alignments. PLOS ONE5, e9490 (2010).
141. I. Letunic, P. Bork, Interactive tree of life (iTOL) v3: an online tool for the display and annotation of phylogenetic and other trees. Nucleic Acids Research44, W242-W245 (2016).
142. N. M. Glover, H. Redestig, C. Dessimoz, Homoeologs: what are they and how do we
30
infer them? Trends in Plant Science21, 609-621 (2016).
144. M. Mascher et al., A chromosome conformation capture ordered sequence of the barley genome. Nature544, 427-433 (2017).
145. L. Al Ait, Z. Yamak, B. Morgenstern, DIALIGN at GOBICS—multiple sequence
alignment using various sources of external information. Nucleic Acids Research41, W3-W7 (2013).
5
146. D. Wang, Y. Zhang, Z. Zhang, J. Zhu, J. Yu, KaKs_Calculator 2.0: A toolkit incorporating gamma-series methods and sliding window strategies. Genomics, Proteomics & Bioinformatics8, 77-80 (2010).
147. J. C. Zadoks, T. T. Chang, C. F. Konzak, A decimal code for the growth stages of cereals.
Weed Research (Oxford)14, 415-421 (1974).
10
148. A. Dobin et al., STAR: ultrafast universal RNA-seq aligner. Bioinformatics29, 15-21 (2013).
149. M. Pertea, D. Kim, G. M. Pertea, J. T. Leek, S. L. Salzberg, Transcript-level expression analysis of RNA-seq experiments with HISAT, StringTie and Ballgown. Nat. Protocols 11, 1650-1667 (2016).
15
150. K. J. Livak, T. D. Schmittgen, Analysis of relative gene expression data using real-time quantitative PCR and the 2−ΔΔCT method. Methods25, 402-408 (2001).
151. A. H. Paterson et al., The Sorghum bicolor genome and the diversification of grasses.
Nature457, 551 (2009).
152. P. S. Schnable et al., The B73 Maize genome: complexity, diversity, and dynamics.
20
Science326, 1112-1115 (2009).
153. E. Bauer et al., Towards a whole-genome sequence for rye (Secale cereale L.). The Plant Journal89, 853-869 (2017).
154. M. J. Sanderson, Estimating absolute rates of molecular evolution and divergence times: a penalized likelihood approach. Molecular Biology and Evolution19, 101-109 (2002).
25
155. P.-A. Christin et al., Molecular dating, evolutionary rates, and the age of the grasses.
Systematic Biology63, 153-165 (2014).
156. M. Krzywinski et al., Circos: an information aesthetic for comparative genomics. Genome Res19, 1639 - 1645 (2009).
157. C. E. Niederhuth et al., Widespread natural variation of DNA methylation within
30
angiosperms. Genome Biology17, 194 (2016).
158. Y. Benjamini, Y. Hochberg, Controlling the false discovery rate: a practical and powerful approach to multiple testing. Journal of the Royal Statistical Society. Series B
159. G. Yu et al., GOSemSim: an R package for measuring semantic similarity among GO terms and gene products. Bioinformatics26, 976-978 (2010).
160. S. Fischer et al., in Current Protocols in Bioinformatics. (John Wiley & Sons, Inc., 2002).
161. S. Cheng et al., Redefining the structural motifs that determine RNA binding and RNA editing by pentatricopeptide repeat proteins in land plants. The Plant Journal85, 532-547
5
(2016).
162. Z. Li et al., SSR analysis and identification of fertility restorer genes Rf1 and Rf4 of
Triticum timopheevii cytoplasmic male sterility (T-CMS) in wheat (Triticum aestivum L.).
Journal of Agricultural Biotechnology22, 1114-1122 (2014).
163. M. Geyer, T. Albrecht, L. Hartl, V. Mohler, Exploring the genetics of fertility restoration
10
controlled by Rf1 in common wheat (Triticum aestivum L.) using high-density linkage maps. Molecular Genetics and Genomics293, 451-462 (2017).
164. P. Sinha, S. M. S. Tomar, Vinod, V. K. Singh, H. S. Balyan, Genetic analysis and
molecular mapping of a new fertility restorer gene Rf8 for Triticum timopheevi cytoplasm in wheat (Triticum aestivum L.) using SSR markers. Genetica141, 431-441 (2013).
15
165. J. Breen et al., A physical map of the short arm of wheat chromosome 1A. PLOS ONE8, e80272 (2013).
166. S. J. Lucas et al., Physical mapping integrated with syntenic analysis to characterize the gene space of the long arm of wheat chromosome 1A. PLOS ONE8, e59542 (2013).
167. D. Raats et al., The physical map of wheat chromosome 1BS provides insights into its
20
gene space organization and evolution. Genome Biology14, R138 (2013).
168. R. Philippe et al., A high density physical map of chromosome 1BL supports evolutionary studies, map-based cloning and sequencing in wheat. Genome Biology14, R64 (2013).
169. E. Paux et al., A physical map of the 1-Gigabase bread wheat chromosome 3B. Science 322, 101-104 (2008).
25
170. K. Holušová et al., Physical map of the short arm of bread wheat chromosome 3D. The Plant Genome10, (2017).
171. O. Shorinola et al., Association mapping and haplotype analysis of the pre-harvest sprouting resistance locus Phs-A1 reveals a causal role of TaMKK3-A in global germplasm. bioRxiv, 10.1101/131201 (2017).
30
172. D. Barabaschi et al., Physical mapping of bread wheat chromosome 5A: an integrated approach. The Plant Genome8, (2015).