Cagatay Turkay and Tao R. Wan (Editors)
Selective BRDFs for High Fidelity Rendering
1025
Abstract
High fidelity rendering systems rely on accurate material representations for produce a realistic visual appearance. However, these accurate models can be slow to evaluate. This work presents an approach for approximating these high accuracy reflectance models with faster, less complicated functions in regions of an image which identified as possessing low visual importance. A subjective rating experiment was conducted in which thirty participants were asked to assess the similarity of scenes rendered with low quality reflectance models, a high quality data-driven model and saliency based hybrids of those images. In two out of the three scenes that were evaluated, the hybrid images were shown to have no observable significant difference from the reference images. This implies that in less visually salient regions of an image computational gains can be achieved by approximating computationally expensive materials with simpler analytic models.
Categories and Subject Descriptors(according to ACM CCS): I.3.3 [Computer Graphics]: Rendering—Reflectance Modelling
1. Introduction
There is a continuing demand for increased accuracy and simulation speed in virtual environments. This comes at the cost of ever increasing demands on computational re-sources, especially when using algorithms relying on ray-traced lighting, and in scenes with multiple complicated ma-terials. These demands can be partially mitigated through various strategies, such as improvements in light transport algorithms, coherence for tracing and shading, filtering, and to reduce computation in less visually important regions of the scene. This paper investigates the latter approach, specifically whether straightforward and computationally in-expensive surface reflection models can be used in place of accurate but more detailed models in less salient regions of the image.
Visual attention models provide a framework to predict the areas of an image which are likely to be attended to by the Human Visual System (HVS). These models have been applied to improving rendering performance by several pre-vious authors [CCW03] [CDMPdS07] [KDCM14] [GDS14], however this work has predominantly focused on decreasing the number of samples computed in a Monte Carlo image synthesis context. Our work aims to improve performance in an orthogonal manner; by reducing the complexity of ma-terials in less visually salient areas, computational savings can be gained without a significant loss in perceived quality of the resultant image.
Material models used in physically-based rendering are
known as Bidirectional Reflectance Distribution Functions (BRDFs). These are 4D descriptions of how incident light is reflected in a given direction. Two types of models are frequently used in rendering systems; analytical and data-driven. Analytical BRDFs range from simple models of dif-fuse reflectance, to parametrised glossy models, such as Phong [Pho75] and Walter [WMLT07], and multi-lobed BRDFs [LFTG97]. These parameters can be altered to affect the appearance of multiple surfaces, but can only approxi-mate real approxi-materials. Data-driven BRDFs consist of captured reflectance values of real-world materials. These typically consist of a 4D (or 3D in the case of isotropic materials) lookup table which is queried at runtime. Uncompressed data-driven BRDFs require significant storage, for example the MERL database [MPBM03] stores each measured sur-face as a 33MB binary file, the total size of the database of 100 materials being 3.30GB. This requires significant mem-ory bandwidth during the frequent, and often incoherent, lookups from the table.
more expensive models are likely to give further improve-ments.
In this paper, an application of visual saliency models to reduce the computational and memory bandwidth costs for BRDF evaluation is described. A series of analytic BRDF models were fitted to the MERL dataset, and applied these to several virtual scenes. A saliency map was generated for each scene and used to evaluate whether users notice a difference between an expensive, but accurate, data-driven BRDF, and a fitted analytic approximation.
The structure of this paper is as follows, the second section discusses the relevant work that is related to this project. The third section outlines the methodology that was used to prepare the scenes and reflectance models used in the experiment as well as the procedure and design of the per-ceptual experiment. The results of the perper-ceptual tests are discussed in section five and section six concludes the paper.
2. Related Work
This section describes related work from the domains of ap-plications of visual attention to accelerating rendering, as well as BRDF models.
2.1. Visual Attention and Level of Detail
Visual attention models attempt to measure Regions of Interest (ROIs) in an image, either from a Top-Down or Bottom-upperspective. Top-down models are task focused, and estimate ROIs based on an objective that the observer is trying to achieve. Bottom-up models estimate ROIs based on knowledge of the Human Visual System (HVS) and preat-tentive features, a good summary of preatpreat-tentive features can be found in Healy and Enns [HE12].
The saliency map was proposed by Koch and Ullman [KU87]. Saliency maps are grayscale images, where the pixel value corresponds to how likely an observer is to pay atten-tion to that point in the scene, the higher the pixel value the higher the saliency of that point.
Itti and Koch [IKN98] then developed a computational model of bottom-up visual attention by using a scale-space feature detection method on an image, that is they subsam-pled and smooth the image to emphasise prominent features orconspicuities within the image. Their method performed well on a variety of images but struggled in images with uni-form noise. They also had no eyetrackers or other methods available to validate their model by testing it with human subjects.
Cater et al. [CCL02] examined whether inattentional blindness could be used to reduce the quality of portions of a rendered image, in order to reduce computation time. Their experiment verified their model of task-based visual attention using eye tracking technology and revealed that users were not able to consistently notice that areas in the images that were of a reduced quality. Cateret al.[CCW03]
expanded their work and combined task maps and a contrast sensitivity function to selectively reduce the number of sam-ples in unimportant regions of an image and regions where errors would be more noticeable. This in effect reduced the resolution of the image in less salient areas but occasionally stuttered when interpolating between neighbouring frames.
Sundstedt et al. [SCCD04] developed task importance maps, which allowed users to manually select regions of an image which would be relevent to a given task. They deter-mined that if sufficiently focused on a task observers would often fail to see reductions in image quality even if those low quality regions were within the foveal region. They later expanded this method [SDL∗05] combining task maps with saliency maps to create overall importance maps. Longhurst et al.introduced a system which did live anti-aliasing within a selective rendering framework, it functioned on the GPU.
Chalmers et al. [CDMPdS07] created low quality Snap-shots of scenes using rasterization and then subdivided the image into salient regions, sampling important sub-images more frequently to achieve a higher level of perceived real-ism.
More recently Koulieriset al.[KDCM14] developed a sys-tem based on top down visual saliency to reduce the level of detail of subsurface light transport, with effects varying from subsurface scattering and refraction to a simple diffuse model (D), in unimportant regions.
2.2. BRDFs and Fitting
In order to reproduce the appearance of real materials digi-tally it is necessary to either have stored data, which repre-sents its appearance, or determined a set of parameters for a BRDF, which will produce a function that closely matches that data. Finding parameters for representing a specific ma-terial is referred to as fitting that BRDF to the material. This section will focus on the literature related to acquisi-tion of reflectance data and the fitting of BRDFs to that data.
Two of the BRDFs used in this study are the Phong (P) BRDF [Pho75] and the Walter (W) BRDF [WMLT07]. The Phong method simulates glossy reflections through the use of a cosine lobe raised to an exponent alongside a diffuse component.
The Walter method is an adaptation of the Cook-Torrance [CT82] model, designed to simulate refraction through rough surfaces as well as reflection through the use of the GGX microfacet distribution function and a correction to Smith’s shadowing and masking function [Smi67]. This is based on a physically plausible model of the underlying surface, and has been used to represent a wide variety of materials.
re-placement for acquiring first-hand data [BSH12] [LKYU12] [BLPW14] [HP15].
Gonioreflectometers have been employed to capture how light bounces off real world materials. Dana et al. [DVGNK97] gathered sparse measurements from over 60 material samples, forming theCUReT database, and fitted them to the Oren-Nayar [ON95] and Koenderink [KVDS96] BRDFs.
Lafortuneet al.[LFTG97] developed a system to fit multi-ple Phong lobes to measured materials, while more effective than individual lobes, they found this insufficient for some materials and found that the stability of their fitting func-tion decreased as the number of reflectance lobes increased.
Another early focus was put on reducing the dimensional-ity of the BRDF space, to enable representing reflectance functions with fewer parameters. This easier, more intu-itive tuning of parameters to match material appearance and smaller datasets to reduce the cost of measurement and storage of data-driven reflectance models. The most note-worthy of which is the Rusinkiewicz’s half angle parametri-sation [Rus98], which reduces the dimensionality of isotropic BRDFs, such as the MERL database from four to three. originally described by Neumannet al.[NNSK99].
Nganet al.[NDM05] used Sequential Quadratic Program-ming to minimise a squared difference error metric. They evaluated the ability of seven analytical BRDFs to repre-sent the MERL database. The Cook-Torrance, Ashikhmin-Shirley and Heet al.fit the data well with minimal errors, simpler Blinn-Phong, Lafortune and Duer models performed poorly. The grazing angles were not included in the fitting, as the data was extrapolated when the MERL materials were captured. They established that BRDFs which used the half-angle parametrisation performed significantly bet-ter than those that used the difference angle paramebet-terisa- parameterisa-tion. They also found that it was difficult to fit many of the materials with a single reflectance lobe. The disadvantage of using an extra reflectance lobe is the increased computation time and fitting becomes less stable.
Recently a number of BRDFs have been designed, specifi-cally to fit to the MERL database, Bagheret al.[BSH12] in-troduced the Shifted Gamma microfacet Distribution (SGD) function for the Cook Torrance BRDF [CT82], replacing the traditional Beckmann distribution. It has a large number of parameters but can fit each material in the database with a single reflectance lobe. They precompute the values of their shadowing and masking function for offline rendering and use an approximation for GPU-based rendering as the pre-computed values are slow to access in real-time applications.
L¨owet al. [LKYU12] introduced the ABC BRDF which accurately models glossy surfaces. Bradyet al. [BLPW14] use genetic algorithms to generate new BRDFs from the MERL database, their system is called genBRDF. Holzschuch and Pacanowski’s BRDF [HP15] designed a physically based BRDF incorporating both reflectance and diffraction, which provided accurate fits to the MERL
database and outperformed the SGD distribution for the Cook-Torrance BRDF, which had previously provided the best fits to the MERL database. It is L¨ow’s fitting function that is adapted in the next section to fit to the methods that are used in the perceptual experiment.
3. Methodology
This work is motivated by the need to provide better overall performance for scenes that may not require detailed repre-sentations of the entire scene at every point in the scenario. In order to demonstrate the feasibility of such a system an experiment was conducted to identify perceptual differences amongst analytical and data-driven BRDFs and hybrids of the two that give higher quality to areas of the region con-sidered more salient.
3.1. Design
The experiment is a subjective rating study, in which partic-ipants were asked to rate the quality of images in comparison to a ground truth image. A hidden reference is also included to provide a relation to the ground truth image. The rating design permits quantification of distance between methods. The hidden reference permits comparisons with the other stimuli to identify perceivable differences across them.
The independent variable is the analytical BRDF which is used to create the mixed images and the scenes used. Both independent variables follow a within-participant de-sign. The BRDF variable consists of seven possibilities, three analytical BRDFs (The analytical BRDFs in question are a diffuse model, the Phong BRDF [Pho75], the Walter BRDF [WMLT07]), mixed saliency models consisting of the three chosen BRDFs mixed with the data-driven BRDF using a saliency map and a hidden reference.
The scenes chosen were all enclosed, indoor scenes. The scenes were enclosed to ensure that the number of indirect lighting bounces remained constant, for timing purposes. The three scenes were of a kitchen a conference room and a lounge.
The camera angle, BRDF fitting procedure, sampling al-gorithm, saliency model, image resolution, number of sam-ples per pixel and viewing time for each image are constant across all scenes and BRDF mixtures. The dependent vari-able is the rating given to each stimulus.
3.2. Materials
This section describes the preparation of the materials, par-ticularly the stimuli used in the experiment.
3.2.1. BRDFs
the focus of related literature. The Walter BRDF was cho-sen because it is heavily used in industry, fits the MERL database well and is a good representation of micro-facet BRDFs. The Phong BRDF was also chosen for its preva-lence in rendering and its speed, it is purely specular and is normally combined with a basic lambertian diffuse model to provide colour.
This section outlines the procedure that was followed to fit the analytical BRDFs used in this study to each entry in the MERL database. Each model had independent parame-ters for each colour channel, with the exception of roughness parameters, as surface micro-structure is independent of the incident wavelength. In the case of the Walter BRDF, the incident index of refraction was the same for each colour channel as the incident medium is air and the difference in refractive index for red, green and blue’s respective wave-lengths is negligible.
The MERL BRDFs have an angular resolution of one de-gree, as the materials are isotropic, the reflectance doesn’t vary with the incident angle,φ, therefore φ = −φ. The density of the tabulated BRDFs is then 90×90×180 = 1,458,000 entries for each colour channel.
In order to find parameters for the diffuse, Phong and Walter BRDFs a nonlinear least-squares regression algo-rithm is used of the form:
min
p∈Rng(x, p), l < p < u (1)
Wherexrepresents the fixed inputs to the function and p,landuare vectors of lengthmcontaining the parameters for the BRDF in question and the lower and upper bounds of those parameters, respectively. The cost function, g, is defined as:
g(ωi, pk) = n
X
i=1
Ei2 (2)
WhereEi is the squared error at theith) data point on the
kthiteration andω
i is the vector representing the direction
of incoming light. To calculate the error a variant of the formulae described in the paper of L¨owet al.is used.
E= sinθo
p y2
m−ya2 (3)
Whereθois the elevation of the view vectorω, expressed in
spherical coordinates and ym andya are the weighted
out-puts of the material and the analytical BRDF being fitted, respectively.
ym= ln(1 + cosθif(ωi, ωo)) (4)
ya= ln(1 + cosθif(ωi, ωo, p)) (5)
In this weighting function MERL material and analyti-cal BRDF are queried and their returned RGB values are multiplied by the cosine of the incident vector’s elevation, to reduce the effect of the poor data near grazing angles [NDM05]. Then this result is logged, in order to put an even
weight on specular and non specular regions. The squared difference of each colour channel is then calculated.
In order to gather a manageable set of vectors to sam-ple the material over circles of increasing radii are projected from the unit disk onto the hemisphere centred around the perfect specular direction with half the circles projected hav-ing a small radius (approximately 0.2 on the unit disk), in order to capture the specular colour and glossiness and half having a larger radius, to capture the diffuse colour.
3.2.2. Scenes
The scenes chosen were all enclosed, indoor scenes. The scenes were enclosed to ensure that the number of indirect lighting bounces remained constant, to ensure consistent indirect lighting and ensure comparability of render times across scenes. The three scenes were of a kitchen a confer-ence room and a lounge, containing 68, 26 and 54 distinct materials, respectively. The reference images for each scene can be seen in Figure2and all images for the Kitchen scene can be seen in Figure1.
3.2.3. Salient Mixture Model
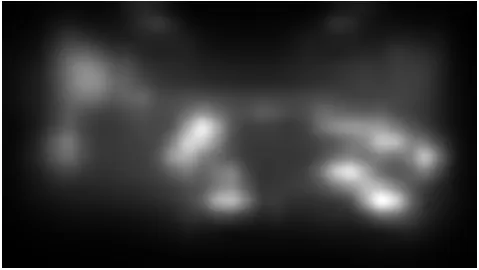
The mixture model stimuli are produced as hybrids of the MERL materials and analytical BRDFs. The saliency model employed isGraph-Based Visual Saliency(GBVS) [HKP06]. However this method is agnostic of the method and any other image-based saliency model could be used. An example saliency map, of the conference scene, is shown in Figure??.
Figure 3: The saliency map generated with GBVS for the Conference scene.
The salient mixture images are created by using the saliency of the given pixel to weight the BRDF that is sam-pled. Every time a surface is to be shaded, either the data-driven BRDF or an analytic model is selected based on sam-pling the normalized saliency value:
f r= (
f rDAT A ifξ < S(i)
f rAN ALY T IC otherwise
(a) Diffuse (b) Phong (c) Walter
(d) Sal-Diffuse (e) Sal-Phong (f) Sal-Walter
Figure 1: The Kitchen scene, rendered with the methods used in the experiment.
(a) Conference (b) Kitchen (c) Lounge
Figure 2: Reference images, rendered with the MERL database
wheref ris the selected BRDF,f rDAT Ais the relevent data
driven BRDF,f rAN ALY T IC is the analytic BRDF (diffuse,
Phong or Walter),S(i) is the normalized saliency at pixeli, where the path originated, andξis a uniformly distributed random number between 0 and 1.
3.3. Participants
There were 30 total participants in this experiment, 4 female and 26 male from a variety of academic backgrounds. Only one possessed expert-level graphics knowledge. All partici-pants had normal or corrected to normal vision.
3.4. Procedure
The experiment took take place in a room with low ambi-ent light varying between 8.1 and 35.3 lux and the images viewed on a 55 inch HD monitor with the brightness and contrast set low to avoid eye fatigue, as per the ITU-R rec-ommendation [Ass03]. The viewing distance was 2.1 metres to avoid discomfort, as per the same recommendations.
A sequential arrangement for the images was followed with the ground truth image displayed first followed by the stimulus. Both were displayed for a duration of three sec-onds [MTM12]. All stimuli were shown to all the partici-pants.
This was followed by a 5 second break for the participants to rate the image before the next image in the series was displayed. The order of the images was randomised. Each experiment took around 10 minutes to complete.
4. Results
In this section the results of the perceptual experiment are presented, analysed and discussed as well as timings for ren-dering both the hybrid images and the images rendered with each method.
4.1. Timing
is-Table 1: Time taken (s) for one sample per pixel in a 1920×1080 image for each BRDF in each scene
Scene D P W SD SP SW R
Conference 31.21 31.48 32.31 31.72 31.66 32.28 33.94 Kitchen 29.52 25.91 26.37 30.95 32.07 33.32 28.21 Lounge 42.48 42.02 42.57 42.51 42.84 42.86 42.95
Table 2: Ratios of time taken to render with the reference method in comparison to all other methods
Scene D P W SD SP SW
Conference 1.087 1.078 1.050 1.070 1.072 1.051 Kitchen 0.956 1.089 1.070 0.911 0.880 0.847 Lounge 1.011 1.022 1.009 1.010 1.003 1.002
sues and the same importance sampling method was used for creating each image. The images were rendered at a res-olution of 1920 by 1080 with one direct and one indirect lighting bounce. The timings for computing one sample per pixel are shown in Table 1. The ratio of computation time vs the reference is shown in Table 2. This illustrates that on average, computational gains can be expected using the saliency weighted methods.
The recorded timings for the
4.2. Perceptual Tests
In order to analyse the similarity of images to the hidden reference the ratings given by participants are converted into distances between their rating of each condition and their rating of the relevant reference image, as recommended by Mantiuket al.[MTM12].
di,j,k=ri,ref(k),k−ri,j,k (7)
Wheredis a distance score, indicating the distance between a given participant’s raw rating, r, of an image and their rating of the respective reference. Herei,jandk represent the observer, image and scene respectively.
The scale used in this study, 1 to 100, is broad and differ-ent participants have differdiffer-ent standards for what a low simi-larity score is. Therefore in order to more effectively compare results from different participants, Z-scores are calculated. Doing so sets the mean and standard deviation of each par-ticipant’s ratings across all scenes to 0 and 1, respectively.
zi,j,k=
di,j,k−(d¯i)
σi
(8)
Figure7displays the mean scores for each BRDF across all scenes, the lower the score the more similar the set of images rendered with that particular BRDF are to the ref-erence. The scores for the hidden reference are also included as theoretically participants could rate the other images as
Table 3: Contrast comparisons between BRDFs in each scene.
Scene BRDF pvalue Kendall(W)
Kitchen D W P SP SD SW R <0.05 0.227 Lounge D W P SW SP SD R <0.05 0.267 Conference D P W SP SW SD R <0.05 0.213 All D W P SP SW SD R <0.05 0.397
Figure 4: Mean Z scores and standard deviation for each BRDF across all participants for the Conference scene
more similar to the reference than itself, which will always have a score of −d¯i
σ for thei
th participant, by definition.
Results were analysed via repeated measures ANOVA in a 7 (method) × 3 (scenes) factorial design. The main ef-fect of scenes did not violate the assumption of spherecity (Maulchy’s Test of Spherecity, P>0.05) and did not
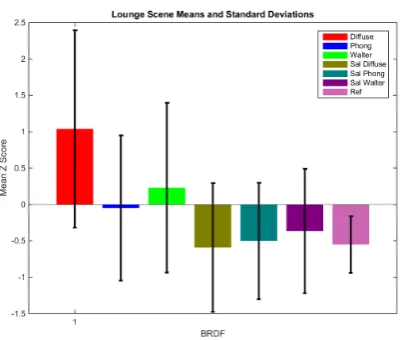
Figure 6: Mean Z scores and standard deviation for each BRDF across all participants for the Lounge scene
duce significant differences, F(2, 384)>0.05, indicating no effect of scene upon the results. The main effect of method did not violate the assumption of spherecity (Maulchy’s Test of Spherecity, P > 0.05) and was significant F(6, 384) = 29.445, P < 0.01. Kendall’s co-efficient of Agreement was computed on the three scenes and on the folded overall scores to identify agreement across participants. Kendall’s co-efficient gives a value of 0 when participants are in com-plete disagreement and 1 when in comcom-plete agreement. The results are shown in Table3. The results are all considered significant (P<0.01) indicating relative agreement in judg-ing by the participants.
Pairwise comparisons using Bonferroni corrections were conducted to identify significant differences amongst the in-dividual methods. The results of these tests can be seen in Table 3. Coloured groupings demonstrate lack of a signifi-cant difference amongst the methods. Results demonstrate groupings of the saliency methods and the other methods. As expected diffuse by itself performs poorer than all other methods, the Phong and Walter methods are grouped to-gether as are all the mixed model methods. Finally the ref-erence is significantly better than the rest of the methods.
5. Discussion
As is visible in Figure 7, the Salient-Diffuse method was rated as the most similar to the reference and each hybrid method out-performed its counterpart. An examination of Figures4,5and6show the results for the Conference scene differ heavily from the Kitchen and Lounge scenes. In the conference scene all methods were rated significantly lower than the reference and pairwise comparisons found a sig-nificant difference in the similarity ratings of the reference image and the hybrid images and between the hybrid images and their analytical counterparts, as can be seen in Table3. The saliency based methods exhibited no significant
differ-Figure 7: Mean Z scores and standard deviation for each BRDF across all participants and scenes
ence in every scene and the overall average, suggesting they are of a similar quality. In addition Phong and Walter exhib-ited no significant difference while Diffuse has no correlation with any other method except in the conference scene, while exhibiting the highest average rating for its hybrid method. This warrants further investigating as there may be a rela-tionship between the simplicity of the model and it’s ability to create convincing hybrid images.
There is not enough data available to determine the cause of this and this will be the subject of future work. .
Timing results (see Tables1and2) show that a decrease in computation cost can be expected, and as Table3shows, visual perception of the scene is not significantly affected.
6. Conclusion and Future Work
This work has investigated whether that analytical BRDFs can be substituted for data-driven models in a rendering pipeline without a noticeable effect to an observer. Three scenes and seven methods for representing materials were compared through the utilisation of a subjective study and statistical analysis. In two of the three scenes examined, no significant difference was found between the reference image, which supports our hypothesis of The hybrid images and in all scenes the hybrids out performed their non-salient coun-terparts. This provides an indication that visual saliency can be used to improve computational performance by replacing expensive materials with cheaper analytic models in less vi-sually important regions of the image.
References
[Ass03] Assembly I. R.: Methodology for the subjective as-sessment of the quality of television pictures. International Telecommunication Union, 2003.5
[BLPW14] Brady A., Lawrence J., Peers P., Weimer W.: genbrdf: Discovering new analytic brdfs with genetic program-ming, 2014. 3
[BSH12] Bagher M. M., Soler C., Holzschuch N.: Accu-rate fitting of measured reflectances using a shifted gamma micro-facet distribution. InComputer Graphics Forum(2012), vol. 31, Wiley Online Library, pp. 1509–1518.3
[CCL02] Cater K., Chalmers A., Ledda P.: Selective quality rendering by exploiting human inattentional blindness: looking but not seeing. In Proceedings of the ACM symposium on Virtual reality software and technology(2002), ACM, pp. 17– 24. 2
[CCW03] Cater K., Chalmers A., Ward G.: Detail to atten-tion: exploiting visual tasks for selective rendering. InACM International Conference Proceeding Series (2003), vol. 44, pp. 270–280.1,2
[CDMPdS07] Chalmers A., Debattista K., Mastoropoulou G., Paulo dos Santos L.: There-reality: selective rendering in high fidelity virtual environments. The International Journal of Virtual Reality 6, 1 (2007), 1–10. 1,2
[CT82] Cook R. L., Torrance K. E.: A reflectance model for computer graphics.ACM Transactions on Graphics (TOG) 1, 1 (1982), 7–24.2,3
[DVGNK97] Dana K., Van Ginneken B., Nayar S., Koen-derink J.: Columbia-utrecht reflectance and texture database, 1997. 3
[ENSB13] Eisenacher C., Nichols G., Selle A., Burley B.: Sorted deferred shading for production path tracing. In Com-puter Graphics Forum (2013), vol. 32, Wiley Online Library, pp. 125–132.1
[GDS14] Galea S., Debattista K., Spina S.: Gpu-based se-lective sparse sampling for interactive high-fidelity rendering. InGames and Virtual Worlds for Serious Applications (VS-GAMES), 2014 6th International Conference on(2014), IEEE, pp. 1–8. 1
[HE12] Healey C. G., Enns J. T.: Attention and visual mem-ory in visualization and computer graphics. Visualization and Computer Graphics, IEEE Transactions on 18, 7 (2012), 1170– 1188. 2
[HKP06] Harel J., Koch C., Perona P.: Graph-based visual saliency. InAdvances in neural information processing systems (2006), pp. 545–552.4
[HP15] Holzschuch N., Pacanowski R.:A physically accurate reflectance model combining reflection and diffraction. PhD thesis, INRIA, 2015. 3,7
[HTSG91] He X. D., Torrance K. E., Sillion F. X., Green-berg D. P.: A comprehensive physical model for light reflec-tion. InACM SIGGRAPH computer graphics(1991), vol. 25, ACM, pp. 175–186.7
[IKN98] Itti L., Koch C., Niebur E.: A model of saliency-based visual attention for rapid scene analysis.IEEE Transac-tions on Pattern Analysis & Machine Intelligence, 11 (1998), 1254–1259.2
[KDCM14] Koulieris G. A., Drettakis G., Cunningham D., Mania K.: C-lod: Context-aware material level-of-detail ap-plied to mobile graphics. InComputer Graphics Forum(2014), vol. 33, Wiley Online Library, pp. 41–49. 1,2
[KU87] Koch C., Ullman S.: Shifts in selective visual atten-tion: towards the underlying neural circuitry. In Matters of intelligence. Springer, 1987, pp. 115–141.2
[KVDS96] Koenderink J. J., Van Doorn A. J., Stavridi M.: Bidirectional reflection distribution function expressed in terms of surface scattering modes. InEuropean Conference on Com-puter Vision (1996), Springer, pp. 28–39.3
[LFTG97] Lafortune E. P., Foo S.-C., Torrance K. E., Greenberg D. P.: Non-linear approximation of reflectance functions. InProceedings of the 24th annual conference on Computer graphics and interactive techniques (1997), ACM Press/Addison-Wesley Publishing Co., pp. 117–126. 1,3
[LKYU12] L¨ow J., Kronander J., Ynnerman A., Unger J.: Brdf models for accurate and efficient rendering of glossy sur-faces. ACM Transactions on Graphics (TOG) 31, 1 (2012), 9.
3,7
[Mca02] Mcallister D. K.: A generalized surface appearance representation for computer graphics. PhD thesis, University of North Carolina at Chapel Hill, 2002. 1
[MPBM03] Matusik W., Pfister H., Brand M., McMillan L.: A data-driven reflectance model. ACM Transactions on Graphics 22, 3 (July 2003), 759–769. 1,2
[MTM12] Mantiuk R. K., Tomaszewska A., Mantiuk R.: Comparison of four subjective methods for image quality as-sessment. InComputer Graphics Forum(2012), vol. 31, Wiley Online Library, pp. 2478–2491. 5,6
[NDM05] Ngan A., Durand F., Matusik W.: Experimen-tal analysis of brdf models. Rendering Techniques 2005, 16th (2005), 2. 3,4
[NNSK99] Neumann L., Neumann A., Szirmay-Kalos L.: Re-flectance models with fast importance sampling. InComputer Graphics Forum(1999), vol. 18, Wiley Online Library, pp. 249– 265. 3
[ON95] Oren M., Nayar S. K.: Generalization of the lamber-tian model and implications for machine vision. International Journal of Computer Vision 14, 3 (1995), 227–251. 3
[Pho75] Phong B. T.: Illumination for computer generated pictures. Communications of the ACM 18, 6 (1975), 311–317.
1,2,3
[Rus98] Rusinkiewicz S. M.: A new change of variables for efficient brdf representation. In Rendering techniques 98. Springer, 1998, pp. 11–22. 3
[SCCD04] Sundstedt V., Chalmers A., Cater K., Debat-tista K.: Top-down visual attention for efficient rendering of task related scenes. InVMV (2004), pp. 209–216. 2
[SDL∗05] Sundstedt V., Debattista K., Longhurst P., Chalmers A., Troscianko T.: Visual attention for efficient high-fidelity graphics. InProceedings of the 21st spring con-ference on Computer graphics (2005), ACM, pp. 169–175.2
[Smi67] Smith B.: Geometrical shadowing of a random rough surface. IEEE transactions on antennas and propagation 15, 5 (1967), 668–671. 2
[WMLT07] Walter B., Marschner S. R., Li H., Torrance K. E.: Microfacet models for refraction through rough surfaces. InProceedings of the 18th Eurographics conference on Render-ing Techniques(2007), Eurographics Association, pp. 195–206.
1,2,3