ORIGINAL RESEARCH
Diffusely Abnormal White Matter in Progressive
Multiple Sclerosis: In Vivo Quantitative MR
Imaging Characterization and Comparison
between Disease Types
H. Vrenken A. Seewann D.L. Knol C.H. Polman F. Barkhof J.J.G. Geurts
BACKGROUND AND PURPOSE: Recent postmortem studies in MS brain suggest that the severity of changes in DAWM can be measured by using quantitative MR imaging. This study aimed to charac-terize DAWM in vivo by using 4 quantitative MR imaging measures and to explore differences between MS disease types.
MATERIALS AND METHODS: In 17 patients with chronic MS (7 PP, 10 SP), quantitative MR imaging was performed at 1.5T, yielding whole-brain voxelwise maps of T1, MTR, ADC, and FA. ROIs were placed to obtain values for DAWM, NAWM, and WM lesions. A general linear mixed-model analysis was used to compare T1, MTR, ADC, and FA between tissue types and disease types.
RESULTS: Values of T1, MTR, ADC, and FA for DAWM were intermediate to those observed in NAWM and WM lesions. In patients with SPMS, DAWM was significantly different from both WM lesions and NAWM regarding all 4 measures, while in patients with PPMS, DAWM differed significantly from NAWM regarding T1, MTR, and FA and from lesions only regarding FA. Most interesting, DAWM differed between disease types: DAWM in patients with SPMS exhibited significantly higher T1 and lower MTR than did DAWM in patients with PPMS.
CONCLUSIONS:In vivo T1, MTR, ADC, and FA reflect the variable severity of pathologic changes in DAWM in MS. Moreover, these quantitative MR imaging measures suggest that DAWM may differ between PPMS and SPMS.
ABBREVIATIONS:ADC⫽apparent diffusion coefficient; DAWM⫽diffusely abnormal white matter; EDSS⫽Expanded Disability Status Scale; FA⫽fractional anisotropy; FLASH⫽fast low-angle shot; IQR⫽interquartile range; kfor⫽forward magnetization exchange rate; MS⫽multiple sclerosis; MTR ⫽ magnetization transfer ratio; NAWM ⫽ normal-appearing white matter; Pd ⫽ proton density; PP⫽primary progressive; PPMS⫽primary progressive multiple sclerosis; ROI⫽region of interest; SP ⫽ secondary progressive; SPMS ⫽ secondary progressive multiple sclerosis; STEAM⫽stimulated echo acquisition mode; T1⫽T1 relaxation time; T1free⫽native T1 relaxation time; WM⫽white matter
I
n the brain of patients with MS, in vivo MR imaging often shows fuzzy-bordered areas of subtly increased signal inten-sity on Pd or T2-weighted images. These abnormalities have been referred to as dirty WM, dirty-appearing WM, or DAWM.1-4The use of varying criteria renders comparisons among these studies difficult. A previous article has proposed a set of MR imaging criteria to define DAWM, applied them ina postmortem setting, and concluded that the use of these specific criteria yields only areas with truly diffuse pathology, without including multifocal lesional pathology.4
Recently, these areas of DAWM have been characterized histopathologically and were found to contain tissue changes indicating a chronic pathology, including axonal loss, myelin loss, and chronic isomorphic gliosis.4,5However, the severity of these changes may vary among patients. On the basis of previous histopathology and MR imaging results, DAWM is believed to represent a separate pathologic entity in MS,4,5in addition to MR imaging⫺visible focal WM lesions, focal le-sions in the gray matter, and subtle changes in the so-called normal-appearing brain tissue. Because DAWM pathology appears to be chronic, most likely reflecting secondary axonal degeneration, one could hypothesize that monitoring DAWM in vivo may give important information on the progression of the disease. In any case, the histopathologic changes observed in DAWM suggest that to obtain a full in vivo assessment of the total disease burden, the tissue damage in DAWM should be taken into account.
Beyond the mere detection of DAWM areas on T2-weighted images, measures are required that can reflect the severity of the pathology in DAWM regions because this se-Received May 5, 2009; accepted after revision July 2.
From the Departments of Radiology (H.V., J.J.G.G.), Physics and Medical Technology (H.V.), Neurology (A.S., C.H.P.), Epidemiology and Biostatistics (D.L.K., F.B.), and Pathology (J.J.G.G.), MS Center Amsterdam, VU University Medical Center, Amsterdam, the Netherlands.
The MS Center Amsterdam is supported by the Dutch MS Research Foundation through a program grant (05–358c). This study was further supported by the Dutch MS Research Foundation through a project grant (98 –371). A.S. was supported by the Dutch MS Research Foundation through a pilot project grant (08 – 633 MS).
Paper previously presented at: Pathogenesis and Mechanisms of White Matter Injury workshop organized by the International Society for Magnetic Resonance in Medicine White Matter Study Group, Krakow, Poland, September, 23–26, 2008.
Please address correspondence to H. Vrenken, MD, Departments of Radiology and Physics and Medical Technology, VU University Medical Center, De Boelelaan 1118, 1081 HV Amsterdam, the Netherlands; e-mail: [email protected]
Indicates open access to non-subscribers at www.ajnr.org
DOI 10.3174/ajnr.A1839
BRAIN
ORIGINAL
verity appears to be variable. Using quantitative MR imaging, Seewann et al4demonstrated that in the postmortem setting, quantitative MR imaging measures reflect the degree of tissue change as measured by histopathologic methods. These quan-titative MR imaging measures are, therefore, important can-didates for quantifying the DAWM disease burden in patients in vivo.
To date, few studies have investigated diffuse WM changes by using quantitative MR imaging techniques in an in vivo setting. In 2 studies, both with small numbers of patients and ROIs, values for MTR, kfor, and T1free of diffuse WM changes were intermediate to those of NAWM and focal WM le-sions,3,6and 1 of these observed lower kfor and higher T1free in diffuse abnormalities compared with those in NAWM.6A larger histogram-based study found that MTR values distin-guished diffuse changes from NAWM and focal WM lesions.2 Finally, in a study of 13 patients, T2 relaxation times of diffuse changes were higher than those of NAWM and lower than those of focal WM lesions.7The varying criteria used to define diffuse abnormalities in these studies, specifically regarding whether multifocal lesions were included, make it difficult to draw reliable conclusions about the nature of the areas of truly diffuse pathology. Furthermore, no comparisons between MS disease types have been reported.
The present study aimed to characterize and quantify changes in purely diffuse DAWM in vivo in progressive MS, defined following previously proposed MR imaging criteria,4 by using quantitative MR imaging techniques. This study in-vestigated the progressive disease types because DAWM seems to be more prevalent in progressive MS than in relapsing-remitting MS (Seewann et al, unpublished general observa-tions). Second, we aimed to investigate whether differences in the severity of DAWM pathology exist between PP and SPMS.
Materials and Methods
Patients
Data previously acquired as part of an academic quantitative MR imaging study were retrospectively selected, including only patients with progressive MS who had results for all 3 techniques: diffusion tensor imaging, MTR, and T1, yielding a subgroup of the total group of progressive patients originally studied.8-10
Quantitative MR Imaging Techniques
This section briefly describes the 3 quantitative MR imaging tech-niques used in this study. T1 mapping produces voxelwise maps of the longitudinal relaxation time, T1, assuming monoexponential decay. In MS, T1 has been shown to be increased in different pathologic processes, most prominently axonal damage but also edema, demy-elination, and gliosis.4,11-16MTR mapping produces voxelwise maps of the relative amount of signal-intensity decrease that results from adding a magnetization-preparation prepulse to a pulse sequence. The MTR is a semiquantitative measure that is ultimately determined by more fundamental parameters such as the fraction of bound pool protons, the magnetization exchange rate between bound and free protons, and the relaxation rates. As such, MTR can theoretically be expected to be altered especially by demyelination and edema, though it has been suggested that inflammation per se may also decrease MTR.17 Correlative imaging⫺histopathologic studies in MS have found reduced MTR to be associated with a lower grade of
myelina-tion4,18,19; similar relations of MTR with axonal loss are thought to result from the close relation between demyelination and axonal loss.17
Finally, diffusion tensor imaging uses magnetic field gradients to sensitize the MR imaging signal intensity to the effects of water diffu-sion in several directions; and from the results of these multiple mea-surements, the water self-diffusion tensor is calculated. Two impor-tant parameters that can be deduced from this tensor are the ADC, which can be interpreted as reflecting the overall magnitude of diffu-sion, and the FA, which reflects the degree to which the diffusion has a preferential direction. Diffusion tensor imaging was used in this study to create voxelwise maps of both ADC and FA. Increased ADC and decreased FA in MS have both been associated with a lower grade of myelination and with axonal loss, and it has been suggested that the relation with axonal loss is largely determined by its relation to demyelination.4,20
MR Image Acquisition
MR imaging investigations were performed on a 1.5T Magnetom Vi-sion MR imaging system (Siemens, Erlangen, Germany) with the standard circularly polarized head coil. A fast spin-echo technique was used to generate Pd and T2-weighted images (TR, 2625 ms; TE, 16/98 ms) for 2 interleaved sets of 16 sections covering the whole brain (section thickness, 4 mm; in-plane resolution, 1⫻1 mm2).
For T1 mapping,21six 3D FLASH image sets were acquired (TR/ TE, 20/4 ms; NEX, 1; bandwidth, 244 Hz/pixel), with nominal flip angles of 2°, 5°, 10°, 15°, 20°, and 25° (small flip angle array), by using a 128-mm 3D slab consisting of thirty-two 4-mm sections, with the same position, orientation, and resolution as the Pd/T2-weighted im-ages. Acquisition took approximately 8 minutes.
For MTR mapping, 2 sets of 3D FLASH images covering the same volume were acquired (TR/TE, 27/4 ms; flip angle, 20°; NEX, 2; 1⫻ 1⫻4 mm3voxels), 1 with a magnetization transfer prepulse (gaussian pulse shape, 7.68-ms duration; frequency offset, 1500 Hz; equivalent flip angle, 500°), and 1 without. Acquisition took approximately 5 minutes.
For B1correction of the T1 and MTR measurements, sagittal 3D FLASH images (TR/TE, 25/5 ms; NEX, 1; bandwidth, 244 Hz/pixel; 200-mm 3D slab; 2⫻2⫻4 mm3voxels) were acquired with nominal flip angles of 140°, 160°, 180°, 200°, and 220° (large flip angle array). Acquisition took approximately 12 minutes.
Diffusion tensor mapping was performed for 20 contiguous 6-mm sections with 2⫻2 mm2pixels, again with the same orienta-tion and in-plane FOV as the T2-weighted images, by using a diffu-sion-weighted single-shot short TE STEAM sequence,22with gradi-ents in 6 noncollinear directions; b-value, 750 s/mm⫺2; flip angle, 11°; effective TE, 65 ms; and 4 acquisitions. Acquisition took approxi-mately 6 minutes.
MR Image Analysis
Calculation of Supratentorial Lesion Volume.To calculate
su-pratentorial lesion loads, we manually marked MR imaging⫺visible abnormalities and semiautomatically outlined them on the Pd-weighted images by using in-house-developed software (Show_Im-ages, VU University Medical Center, Amsterdam, the Netherlands), using a seed-growing technique with a local threshold.
Quantitative MR Imaging Analysis
T1 Mapping.Whole-brain T1 maps (Fig 1) were obtained as
coregistered with FLIRT (FMRIB’s linear image registration tool)23,24; T1 was then calculated21for each pixel by nonlinear least-squares fitting by using a hill-climbing algorithm, correcting the flip angle values for the local effective B1field strength, which was calcu-lated from the signal-intensity zero crossing21in the large flip angle array images.
MTR Mapping.Whole-brain MTR maps were obtained as
previ-ously described.10Briefly, 3D FLASH images acquired with and with-out magnetization transfer prepulse were coregistered, MTR maps were generated, and a correction for B1-induced variation was applied for each subject by using the method described by Ropele et al.25
ADC and FA Mapping.ADC and FA maps were generated as
previously described.8Briefly, maps of the 6 unique diffusion tensor elements were calculated from the raw data and then used to calculate ADC and FA maps.26
ROI for Quantitative MR Imaging Analysis
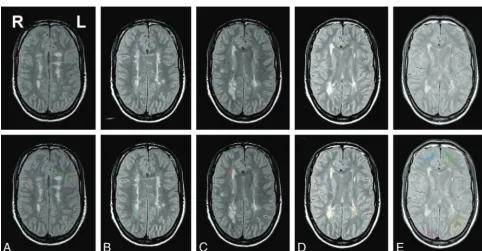
Figures 2 and 3 illustrate how the ROIs were placed in the different tissue types. In this study, DAWM was defined as a uniform nonfocal area of signal increase on the Pd-weighted sequence, in which the signal increase is more subtle than the signal increase of focal WM lesions. ROIs were placed by manual outlining on the Pd-weighted images. To avoid regional bias, we aimed to sample all 3 tissue types (NAWM, DAWM, and focal WM lesions) in 4 locations: left and right frontal WM and left and right parieto-occipital WM, leading to a total of 12 ROIs per patient. Another interesting region, the periventricular region, unfortunately had to be discarded because images of too many patients did not exhibit NAWM in that region, which would have led to systematic bias in the sampling.If a tissue type was not present in a particular location, the corresponding ROI was not placed. To pro-vide good sampling of NAWM, we used ROIs in NAWM that were
Fig 1.Sample of maps of quantitative MR imaging measures for 1 axial section in a female patient with PPMS (59.5 years of age; disease duration, 8.3 years; EDSS score, 4.0; total focal
WM lesion volume on T2, 14.9 mL). Images show maps of the T1 (A), MTR (B), ADC (C), and FA (D). The empty (black) voxels located centrally in the maps of T1 and MTR are voxels excluded from analyses because of insufficient accuracy in determining the local effective B1field strength in and close to the CSF. Details of methods are provided in the text.
Fig 2.Early-echo (Pd) images from a T2-weighted 2D dual-echo fast spin-echo sequence used to identify and outline focal WM lesions, DAWM, and NAWM. Images shown are from a
[image:3.594.59.535.42.188.2] [image:3.594.53.536.232.483.2]fairly large compared with those in DAWM and lesions, in which the sizes of the pathologic areas present in the 4 anatomic regions studied here created limitations on the size of ROIs that could be drawn, especially sometimes leading to small ROIs in lesions. Within these limitations, we aimed to draw ROIs of roughly similar size in DAWM and lesions. For each tissue type, we attempted to draw similar-sized ROIs in the different anatomic regions as much as possible.
Within each patient, ROIs were then combined for each tissue type, giving 1 combined ROI for DAWM, 1 for NAWM, and 1 for focal WM lesions. Using FLIRT,23,24we registered the patient’s T2-weighted images to their MTR, T1, and ADC/FA maps, by using the corresponding native images as a reference. The transformation ma-trices thus obtained were applied to the binary ROIs, by using trilinear interpolation and a 25% intensity threshold, yielding binary ROIs in the MTR, T1, ADC, and FA map spaces, which were used to calculate the average MTR, T1, ADC, and FA for each tissue type for that patient.
Statistical Analysis
Clinical variables and supratentorial lesion volumes were compared between patients with PPMS and SPMS by using the Mann-Whitney
Utest, except for sex for which the Pearson2test was used. For each quantitative MR imaging parameter (MTR, T1, ADC, FA), a model was constructed incorporating all 3 tissue types and all patients. A general linear mixed model was used with the tissue types nested within patients and an unstructured covariance matrix. The model further contained disease type (PPMS or SPMS) and the inter-action between disease type and tissue type. If the interinter-action between disease type and tissue type was not significant at theP⫽.05 level, differences between PPMS and SPMS and pair-wise differences among the 3 tissue types were assessed by using post hoc Bonferroni-adjusted contrasts. If there was a significant interaction between dis-ease type and tissue type, post hoc Bonferroni-adjusted contrasts were set up to assess differences between PPMS and SPMS within each of the 3 tissue types separately and, similarly, to assess differences among the 3 tissue types within patients with PPMS and SPMS separately.P
values below .05 were considered statistically significant.
Results
Patients
Demographic and clinical characteristics are given in Table 1. Sex distributions in both groups were as expected, with rela-tively more women in the SPMS group, but this difference was not significant(P⫽.6). Disease durations were shorter in the PPMS group (P⫽.3), while patients with PPMS were signif-icantly older than those with SPMS (P⫽.002), as expected from the higher average age at onset of PPMS. EDSS scores were higher in the SPMS group (P⫽.2). The T2 focal WM lesion volumes were higher in the SPMS group compared with the PPMS group (P⫽.07).
ROIs
[image:4.594.55.533.63.143.2]A total of 190 ROIs were placed in the 17 patients included in this study, with 12 ROIs per patient except in the follow-ing cases: In 2 patients, no parieto-occipital lesions were found. In another patient, no parieto-occipital DAWM was found. In 1 patient with PPMS, no lesion was found in the frontal or parieto-occipital WM, so no lesion ROI could be placed. Similarly, in 1 patient with SPMS, no NAWM ROI could be placed. The numbers of patients analyzed in each tissue category were therefore the following: DAWM: 7 PP, 10 SP; focal WM lesions: 6 PP, 10 SP; NAWM: 7 PP, 9 SP. Table 2 lists the median numbers and volumes of analyzed voxels for each quantitative MR imaging measure in each tissue type, as well as the same number for the original ROIs drawn on the Pd-weighted images. Table 3 provides more detail on the ROIs as drawn on the Pd-weighted images, listing the median numbers and IQRs for each patient group by anatomic region and tissue type. As indicated in “Materials and Methods,” NAWM ROIs were larger than those for DAWM or lesions. Also, DAWM ROIs were larger than lesion ROIs. The largest discrepancies between the PPMS and SPMS groups were seen for parieto-occipital DAWM and parieto-occipital lesions.
Table 1: Demographic and clinical characteristicsa
PPMS SPMS
PValue for Comparison: PPMS vs SPMS
No. of patients 7 10
Sex: M/F 3/4 3/7 .6
Age (yr) (mean⫾SD) 59.2⫾5.9 43.8⫾10.3 .002 Disease duration (yr): Median (IQR) 8.3 (3.8–16.4) 15.9 (8.7–23.7) .3 EDSS score: median (IQR) 4.5 (3.0–4.5) 5.5 (4.0⫺6.75) .2 Supratentorial focal WM lesion volume (mL): median (IQR) 3.6 (1.4–13.8) 15.5 (3.9–23.6) .07
a
Pvalues for the comparison between patients with PPMS and SPMS are derived from the Mann-WhitneyUtest, except for sex, for which Pearson2
[image:4.594.52.532.183.238.2]was used.
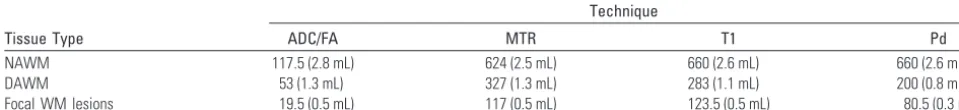
Table 2: Median number (volume) of analyzed voxels per patient in each tissue type for each quantitative MR imaging measurea
Tissue Type
Technique
ADC/FA MTR T1 Pd
NAWM 117.5 (2.8 mL) 624 (2.5 mL) 660 (2.6 mL) 660 (2.6 mL) DAWM 53 (1.3 mL) 327 (1.3 mL) 283 (1.1 mL) 200 (0.8 mL) Focal WM lesions 19.5 (0.5 mL) 117 (0.5 mL) 123.5 (0.5 mL) 80.5 (0.3 mL)
a
Median values are given for the entire group of patients in this study. A more detailed subdivision by anatomic region and disease type is provided in Table 3. The size of each region of interest was defined as the total number of voxels included in the ROI, after warping it to the corresponding quantitative MR imaging maps as described in the text. The corresponding ROI volume was calculated by multiplying the number of voxels by the appropriate voxel volume, which was 4 mm3
for the T1 and MTR maps, and 24 mm3
Quantitative MR Imaging Characterization of DAWM
Table 4 and Fig 4 show the observed values of the quantitative MR imaging measures. Values observed in DAWM were in-termediate to those observed in focal WM lesions and those
observed in NAWM. For ADC, MTR, and T1, the interaction between disease type and tissue type was significant, whereas for FA, the interaction between disease type and tissue type was not significant; in both cases, the appropriate method was used to assess pair-wise contrasts.
In patients with SPMS, the discrimination among tissue types was clearest: DAWM differed significantly from both focal WM lesions and NAWM regarding all 4 quantitative MR imaging measures. ADC and T1 were significantly higher (by between 10% and 20%) in DAWM than in NAWM and sig-nificantly lower than in focal WM lesions (by approximately 25%). FA and MTR were significantly lower in DAWM com-pared with NAWM (by approximately 10%) and significantly higher compared with lesions (by approximately 30%).
In patients with PPMS, DAWM differed significantly from NAWM, in that FA and MTR were significantly lower in DAWM (by between 5% and 10%) and T1 was significantly higher in DAWM (by approximately 10%), whereas DAWM differed significantly from focal WM lesions only regarding FA, which was approximately 10% higher in DAWM com-pared with focal WM lesions.
[image:5.594.54.533.57.167.2]Focal WM lesions and NAWM were significantly different regarding all 4 quantitative MR imaging measures and in both disease types (Table 3, Fig 4), with the exception of T1 in
Table 3: Number of voxels (medians and IQRs) in the ROI drawn on the Pd-weighted imagesa
Disease Type, Region
NAWM DAWM Lesions
Median IQR Median IQR Median IQR
PPMS
Frontal 314.0 247.5–338.5 89.0 79.5–120.0 25.0 17.0–56.0 Parieto-occipital 318.0 305.0–379.5 128.0 111.0–156.0 32.0 26.0–52.0 Combined 593.0 528.0–713.0 212.0 190.5–265.5 57.0 17.0–80.0 SPMS
Frontal 394.0 238.0–452.0 99.0 69.0–121.0 40.5 32.0–87.0 Parieto-occipital 390.0 319.0–501.0 94.5 76.0–114.0 56.0 36.0–61.0 Combined 703.0 629.0–921.0 193.0 141.0–238.0 95.0 71.0–144.0
[image:5.594.52.533.201.416.2]aThe “Combined” ROI for each patient is the combination of the frontal and parieto-occipital ROIs for that tissue type (NAWM, DAWM, or lesions).
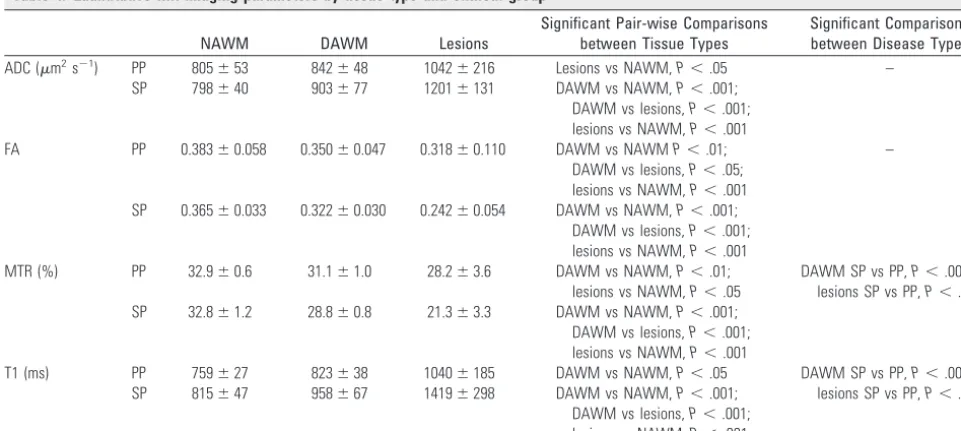
Table 4: Quantitative MR imaging parameters by tissue type and clinical groupa
NAWM DAWM Lesions
Significant Pair-wise Comparisons between Tissue Types
Significant Comparisons between Disease Types ADC (m2s⫺1) PP 805⫾53 842⫾48 1042⫾216 Lesions vs NAWM,P⬍.05 –
SP 798⫾40 903⫾77 1201⫾131 DAWM vs NAWM,P⬍.001; DAWM vs lesions,P⬍.001; lesions vs NAWM,P⬍.001 FA PP 0.383⫾0.058 0.350⫾0.047 0.318⫾0.110 DAWM vs NAWMP⬍.01;
DAWM vs lesions,P⬍.05; lesions vs NAWM,P⬍.001
–
SP 0.365⫾0.033 0.322⫾0.030 0.242⫾0.054 DAWM vs NAWM,P⬍.001; DAWM vs lesions,P⬍.001; lesions vs NAWM,P⬍.001 MTR (%) PP 32.9⫾0.6 31.1⫾1.0 28.2⫾3.6 DAWM vs NAWM,P⬍.01;
lesions vs NAWM,P⬍.05
DAWM SP vs PP,P⬍.001; lesions SP vs PP,P⬍.01 SP 32.8⫾1.2 28.8⫾0.8 21.3⫾3.3 DAWM vs NAWM,P⬍.001;
DAWM vs lesions,P⬍.001; lesions vs NAWM,P⬍.001
T1 (ms) PP 759⫾27 823⫾38 1040⫾185 DAWM vs NAWM,P⬍.05 DAWM SP vs PP,P⬍.001; lesions SP vs PP,P⬍.05 SP 815⫾47 958⫾67 1419⫾298 DAWM vs NAWM,P⬍.001;
DAWM vs lesions,P⬍.001; lesions vs NAWM,P⬍.001
a
Means and SDs of ADC, FA, MTR, and T1 in NAWM, DAWM, and lesions by clinical group (PP or SPMS). Bonferroni-correctedPvalues derived from general linear mixed model analysis are indicated for statistically significant pair-wise differences between tissue types and disease types. Details of statistical analyses are provided in the text.
Fig 3.Further illustration of the radiologic definition of DAWM and placement of ROIs.
[image:5.594.53.287.447.578.2]PPMS, which did not significantly differ between NAWM and focal WM lesions.
Comparison between PPMS and SPMS
DAWM differed between PPMS and SPMS regarding MTR and T1, with MTR lower and T1 higher in SPMS DAWM compared with PPMS DAWM, both associated with more se-vere MS-related tissue changes. No differences were observed between PPMS and SPMS regarding ADC or FA of DAWM. Similarly, focal WM lesions had lower MTR and higher T1 in SPMS compared with PPMS, again suggesting more severe
damage in the patients with SPMS, while lesional ADC and FA did not differ between SPMS and PPMS.
Discussion
This study demonstrates that 4 in vivo quantitative MR imag-ing measures enable a clear discrimination between DAWM and other tissue pathologies in MS brain and that T1 and MTR may differentiate between DAWM in PPMS and SPMS.
The ability of quantitative MR imaging to reflect his-topathologic changes in DAWM has recently been demon-strated in postmortem tissue.4,5In the in vivo imaging setting
Fig 4.Boxplots showing median, range, and 25th and 75th percentiles for T1 (A), MTR (B), ADC (C), and FA (D). Each boxplot shows data split according to patient group (either PP or
[image:6.594.57.533.44.550.2]used in the present study, no distinction can be made between truly diffuse pathology and areas containing multiple micro-scopic lesions. Therefore, DAWM was selected on the basis of well-defined MR imaging criteria that have been shown in postmortem imaging to lead to inclusion of truly diffuse ab-normalities, without including multifocal lesional pathology. Hence, this study is the first to give real in vivo insight in the pathology of “pure” diffusely abnormal WM, by using a pathologically confirmed method to select it. The results are in agreement with the limited data available from previous in vivo quantitative MR imaging studies, in which MTR,2,3 kfor,3,6T1free,3,6and T27 were measured in “diffuse” WM changes, sometimes including multifocal lesions. The present study demonstrates that “pure” DAWM without multifocal lesions exhibits in vivo quantitative MR imaging measures in-termediate to and significantly different from those of focal WM lesions and those of NAWM.
These results are in agreement with findings of a recent postmortem MR imaging⫺histopathology correlation study that used the same quantitative MR imaging measures in fixed brain sections4and that also observed that quantitative MR imaging measures of DAWM showed intermediate values be-tween those of focal WM lesions and those of NAWM. We, therefore, conclude that the applied quantitative MR imaging techniques are useful as paraclinical tools for measuring the severity and evolution of DAWM in patients with MS.
Previous postmortem histopathologic findings evidenced that though quantitative MR imaging measures of DAWM are intermediate to those of NAWM and focal WM lesions, the disease process in DAWM is by no means a stage preceding focal lesions, but a different pathologic phenomenon alto-gether, involving old chronic gliosis with extensive axonal and myelin loss.4Remyelination or other evidence of resolution of pathology was not observed in that study, but it would cer-tainly be important to scrutinize those findings in indepen-dent studies on different samples. Combined with a moderate activation of microglia, these observations are certainly com-patible with secondary (wallerian) degeneration, similar to what has been reported in white matter hyperintensities in Alzheimer disease by Gouw et al.27If DAWM indeed repre-sents secondary axonal degeneration, studying DAWM changes in vivo will be of paramount importance for under-standing and monitoring the disease process.
Although groups in this study were relatively small, the results for T1 and MTR suggest that DAWM in PPMS may be different from DAWM in SPMS. This finding is important because it establishes that pathologic changes in DAWM are not the same in all patients with MS and, in fact, may differ significantly between 2 clinical groups. Whether the differ-ences observed between the PPMS and SPMS patients in the present study are strictly the result of a fundamental difference between PPMS and SPMS cannot be concluded from our re-sults. The retrospective nature of the present study implies that we have been unable to influence the size and composi-tion of the patient groups. From the groups of patients with PPMS and SPMS included in the original study, we had to exclude several patients because data were not complete for all 4 measures (MTR, T1, ADC, and FA). Although the 2 resulting patient groups were representative of their respective disease types, they did differ in terms of disease durations and EDSS
scores (though not significantly). Therefore, it cannot be ex-cluded that the observed difference between our groups of patients with PPMS and SPMS is partly or wholly the result of a longer and/or more severe disease process in the patients with SPMS. Lower numbers of inflammatory infiltrates were reported in the WM in PPMS compared with SPMS in a post-mortem study.28It has been hypothesized that PPMS may be more primarily neurodegenerative in nature, compared with the relapse-onset type of disease.29Further in vivo studies should address the putative DAWM differences between PPMS and SPMS in well-matched groups. The nature and severity of tissue changes in DAWM should also be compared between PPMS and SPMS through postmortem histopatho-logic studies.
Although in this study, ROI sizes differed somewhat be-tween patient groups and tissue types, this difference is un-likely to have affected the results. Most important, the ROIs were placed in the same anatomic regions, thus controlling for regional variations in the quantitative MR imaging measures, and were of sufficient size to provide good sampling of each tissue type. Because of the small sizes of the lesions present in these regions in many patients, the lesion ROIs were overall smaller than the DAWM ROIs, which can be expected to result in somewhat less accurate determination of the average values of the quantitative MR imaging measures in lesional tissue but would not have any systematic effect on the values themselves or the statistical comparisons performed in this study.
The comparison between clinical groups demonstrates that the severity of tissue damage in DAWM may vary between patients; and as argued by Chen et al,1quantitative MR imag-ing will be a valuable tool for studyimag-ing DAWM changes com-prehensively. The most important next step in this process would be to investigate the clinical correlate of the observed quantitative MR imaging changes in DAWM, by assessing re-lations with clinical measures, by comparing DAWM across the course of relapse-onset disease, and by measuring changes with time through prospective follow-up studies applying quantitative MR imaging of DAWM regions. Furthermore, whether DAWM severity is related to the abundance of or severity of the damage in the focal WM lesions should be in-vestigated as well as the relations of DAWM with cortical at-rophy, to scrutinize the hypothesis that DAWM may consist of secondary axonal degeneration. In the current retrospective study, groups were too small and available image data inade-quate to address these issues.
The current study was designed to investigate DAWM, not to compare MR imaging techniques, and the different MR imaging techniques were, therefore, not designed to be as comparable as possible. However, our results suggest that though T1, MTR, ADC, and FA all show the same trends, which are in agreement with postmortem findings, of these 4, T1 and MTR may be especially sensitive to the changes occur-ring in DAWM. These, therefore, seem the most promising candidates for use in future studies investigating the clinical and imaging correlates of DAWM.
NAWM, differing by as much as 30%. While taking care to exclude focal or confluent WM lesions from the analyses, pre-vious histogram studies have most likely included DAWM as defined according to the criteria of Seewann et al,4because DAWM as defined by these criteria exhibits fairly subtle sig-nal-intensity increases. To understand the respective roles of NAWM and DAWM in MS, future studies should also inves-tigate the extent of DAWM in addition to studying its severity with quantitative MR imaging techniques.
In conclusion, the present retrospective study demon-strated that 4 widely used in vivo quantitative MR imaging measures can discriminate “pure” DAWM—without multifo-cal lesional abnormalities—from both fomultifo-cal WM lesions and NAWM, confirming earlier postmortem results in vivo and laying the foundations for future prospective clinical studies of DAWM. Moreover, the results suggest that DAWM may be more abnormal in patients with SPMS than in patients with PPMS.
Acknowledgments
We thank all patients who participated in this study and Petra J.W. Pouwels, PhD, Department of Physics and Medical Tech-nology, VU University Medical Center, Amsterdam, the Neth-erlands, for help with quantitative MR imaging techniques.
References
1. Chen SC, Chung HW, Liou M.Measurement of volumetric lesion load in multiple sclerosis: moving from normal- to dirty-appearing white matter.
AJNR Am J Neuroradiol2003;24:1929 –30
2. Ge Y, Grossman RI, Babb JS, et al.Dirty-appearing white matter in multiple sclerosis: volumetric MR imaging and magnetization transfer ratio histogram analysis.AJNR Am J Neuroradiol2003;24:1935– 40
3. Ropele S, Strasser-Fuchs S, Augustin M, et al.A comparison of magnetization transfer ratio, magnetization transfer rate, and the native relaxation time of water protons related to relapsing-remitting multiple sclerosis.AJNR Am J Neuroradiol2000;21:1885–91
4. Seewann A, Vrenken H, van der Valk P, et al.Diffusely abnormal white matter in chronic multiple sclerosis: imaging and histopathologic analysis.Arch Neu-rol2009;66:601– 09
5. Moore GR, Laule C, MacKay A, et al.Dirty-appearing white matter in multiple sclerosis: preliminary observations of myelin phospholipid and axonal loss.
J Neurol2008;255:1802–11
6. Karampekios S, Papanikolaou N, Papadaki E, et al.Quantification of magneti-zation transfer rate and native T1 relaxation time of the brain: correlation with magnetization transfer ratio measurements in patients with multiple sclerosis.Neuroradiology2005;47:189 –96
7. Papanikolaou N, Papadaki E, Karampekios S, et al.T2 relaxation time analysis in patients with multiple sclerosis: correlation with magnetization transfer ratio.Eur Radiol2004;14:115–22
8. Vrenken H, Pouwels PJ, Geurts JJ, et al.Altered diffusion tensor in multiple
sclerosis normal-appearing brain tissue: cortical diffusion changes seem re-lated to clinical deterioration.J Magn Reson Imaging2006;23:628 –36 9. Vrenken H, Geurts JJ, Knol DL, et al.Whole-brain T1 mapping in multiple
sclerosis: global changes of normal-appearing gray and white matter. Radiol-ogy2006;240:811–20
10. Vrenken H, Pouwels PJ, Ropele S, et al.Magnetization transfer ratio measure-ment in multiple sclerosis normal-appearing brain tissue: limited differences with controls but relationships with clinical and MR measures of disease.
Mult Scler2007;13:708 –16
11. Bitsch A, Kuhlmann T, Stadelmann C, et al.A longitudinal MRI study of his-topathologically defined hypointense multiple sclerosis lesions.Ann Neurol
2001;49:793–96
12. Brex PA, Parker GJ, Leary SM, et al.Lesion heterogeneity in multiple sclerosis: a study of the relations between appearances on T1 weighted images, T1 re-laxation times, and metabolite concentrations. J Neurol Neurosurg Psychiatry
2000;68:627–32
13. MacKay AL, Vavasour IM, Rauscher A, et al.MR relaxation in multiple sclero-sis.Neuroimaging Clin N Am2009;19:1–26
14. van Waesberghe JH, Kamphorst W, De Groot CJ, et al.Axonal loss in multiple sclerosis lesions: magnetic resonance imaging insights into substrates of dis-ability.Ann Neurol1999;46:747–54
15. van Walderveen MA, Kamphorst W, Scheltens P, et al.Histopathologic corre-late of hypointense lesions on T1-weighted spin-echo MRI in multiple sclero-sis.Neurology1998;50:1282– 88
16. Vavasour IM, Li DK, Laule C, et al.Multi-parametric MR assessment of T(1) black holes in multiple sclerosis: evidence that myelin loss is not greater in hypointense versus isointense T(1) lesions.J Neurol2007;254:1653–59 17. Ropele S, Fazekas F.Magnetization transfer MR imaging in multiple sclerosis.
Neuroimaging Clin N Am2009;19:27–36
18. Schmierer K, Scaravilli F, Altmann DR, et al.Magnetization transfer ratio and myelin in postmortem multiple sclerosis brain.Ann Neurol2004;56:407–15 19. Schmierer K, Wheeler-Kingshott CA, Tozer DJ, et al.Quantitative magnetic
resonance of postmortem multiple sclerosis brain before and after fixation.
Magn Reson Med2008;59:268 –77
20. Schmierer K, Wheeler-Kingshott CA, Boulby PA, et al.Diffusion tensor imag-ing of post mortem multiple sclerosis brain.Neuroimage2007;35:467–77 21. Venkatesan R, Lin W, Haacke EM.Accurate determination of spin-density and
T1 in the presence of RF-field inhomogeneities and flip-angle miscalibration.
Magn Reson Med1998;40:592– 602
22. Nolte UG, Finsterbusch J, Frahm J.Rapid isotropic diffusion mapping without susceptibility artifacts: whole brain studies using diffusion-weighted single-shot STEAM MR imaging.Magn Reson Med2000;44:731–36
23. Jenkinson M, Smith S.A global optimisation method for robust affine regis-tration of brain images.Med Image Anal2001;5:143–56
24. Jenkinson M, Bannister P, Brady M, et al.Improved optimization for the ro-bust and accurate linear registration and motion correction of brain images.
Neuroimage2002;17:825– 41
25. Ropele S, Filippi M, Valsasina P, et al.Assessment and correction of B1-in-duced errors in magnetization transfer ratio measurements.Magn Reson Med
2005;53:134 – 40
26. Basser PJ, Pierpaoli C.Microstructural and physiological features of tissues elucidated by quantitative-diffusion-tensor MRI.J Magn Reson B1996;111: 209 –19
27. Gouw AA, Seewann A, Vrenken H, et al.Heterogeneity of white matter hyper-intensities in Alzheimer’s disease: post-mortem quantitative MRI and neuro-pathology.Brain2008;131:3286 –98
28. Kutzelnigg A, Lucchinetti CF, Stadelmann C, et al.Cortical demyelination and diffuse white matter injury in multiple sclerosis.Brain2005;128:2705–12 29. Miller DH, Leary SM.Primary-progressive multiple sclerosis.Lancet Neurol