http://www.sciencepublishinggroup.com/j/ijmpem doi: 10.11648/j.ijmpem.20190401.14
ISSN: 2575-1840 (Print); ISSN: 2575-1859 (Online)
Investigation of Efficiency of Magnetic Separation Methods
for Processing of Low-Grade Iron Pigments Ore (RED
Ochre)
Seyed Hamzeh Amiri
School of Mining Engineering, University of Tehran, Tehran, Iran
Email address:
To cite this article:
Seyed Hamzeh Amiri. Investigation of Efficiency of Magnetic Separation Methods for Processing of Low-Grade Iron Pigments Ore (RED Ochre). International Journal of Mineral Processing and Extractive Metallurgy. Vol. 4, No. 1, 2019, pp. 18-25.
doi: 10.11648/j.ijmpem.20190401.14
Received: March 7, 2019; Accepted: April 13, 2019; Published: May 15, 2019
Abstract:
In this research, the efficiency of magnetic separation methods for processing of a low-grade iron pigments ore (red ochre) has been studied. Based on the mineralogical analyses (XRD), thin section and polish studies, the reserve is an iron sedimentary deposit with an average Fe grade of %31.3. The most valuable minerals are Hematite and Goethite and main gangue minerals are Calcite and Quartz. Wet and dry high-intensity magnetic separation methods were applied for processing. The full factorial design was implemented for all of the wet high-intensity magnetic separation (WHIMS) experiments. Factors of magnetic field intensity, rotor speed and feed water flowrate were considered for design. In optimal conditions in rougher stage, WHIMS produced a concentrate with grade %42.92 Fe and recovery %62.23 in magnetic field intensity 1.7 Tesla, feed water flowrate 5 liter per minute and speed of rotor 3 rounds per minute; also after two stage cleaning WHIMS produced a concentrate with Fe grade and Fe recovery of %56.12 and %38.56, respectively. The results of the dry high-intensity magnetic separation for the two coarser fractions showed that size fraction of coarser than 1000 micron produced a concentrate with Fe grade %40.32 and relative Fe recovery %95.11 and size fraction of -1000+150 micron with Fe grade %45. 04 and relative Fe recovery %75.14. The results of experiments show that there is a low capability for improving quality and grade of this ore. Achieved concentrate from experiments could be used as an initial feed of producing pigment.Keywords:
Red Ochre, Iron, High-Intensity Magnetic Separation, Full Factorial Design1. Introduction
Red ochre is one of the most important iron oxide forms. The main mineral of red ochre is Hematite (Fe2O3) and it
uses in many industries such as paint, cement, chemical, cosmetics, plastic, paper, glass, ceramic and etc. [1-2]. There are many red ochre reserves in Iran which are mainly located in southern and central parts [3]. The majority of these deposits has a low grade and they should be processed to use in various industries [3-4]. Different separation methods such as Gravity, magnetic, flotation are mainly used for processing of these kinds of deposits [5-9]. There are a great number of researches on the separation principles [10], while a few applications have been accomplished in processing of low-grade ochre. In this research dry and wet high-intensity magnetic separation methods were applied in processing of
red ochre.
2. Materials and Methods
2.1. Low Grade Ore Characteristics
Table 1. Distribution of iron in different size fractions.
Size fraction (micron) Iron grade (%) Iron distribution (%)
+2000 30.6 4.52
-2000+1000 32.73 19.11
-1000+850 34.44 3.27
-850+600 34.38 7.14
-600+300 34.54 8.01
-300+212 31.59 6.62
-212+150 28.08 4.84
-150+75 27.88 4.76
-75 34.45 41.75
Figure 1. Iron distribution in different size fractions.
As shown in figure 1, distribution of iron in size fraction finer than 75 microns rather than larger size fractions has considerably increased. This is due to concentration of earthy Hematite in this size fraction.
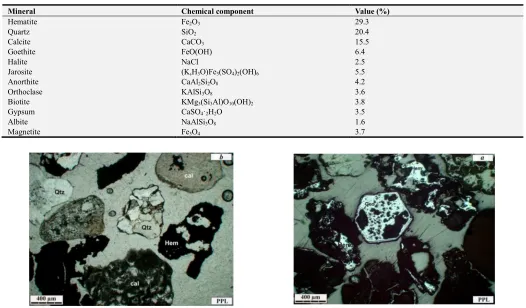
Table 2. Mineralogical composition of the primary low-grade ore using XRD analysis.
Mineral Chemical component Value (%)
Hematite Fe2O3 29.3
Quartz SiO2 20.4
Calcite CaCO3 15.5
Goethite FeO(OH) 6.4
Halite NaCl 2.5
Jarosite (K,H3O)Fe3(SO4)2(OH)6 5.5
Anorthite CaAl2Si2O8 4.2
Orthoclase KAlSi3O8 3.6
Biotite KMg3(Si3Al)O10(OH)2 3.8
Gypsum CaSO4·2H2O 3.5
Albite NaAlSi3O8 1.6
Magnetite Fe3O4 3.7
Figure 2. Thin section image of low-grade ochre ore, Hem: Hematite, Geo: Goethite, Qtz: Quartz, Cal: Calcite.
2.2. Procedure of Wet High-Intensity Magnetic Separation
(WHIMS) Experiments
WHIMS experiments were done using high-intensity magnetic separator model Boxmag that was available in the mineral processing laboratory of college. Magnetic field intensity, feed water flowrate and speed of drum are adjustable factors of this separator.
2.3. Full Factorial Design
Many experiments should be done for achieving to
optimized conditions in different processes which caused a lot of costs. So many researchers have focused on selecting the best conditions for effective factors on processes. Full factorial design is one of the experiment design methods which increased using it in recent years [11] and it was used to design WHIMS experiments in this research. Table 3 shows selected levels of each factor in magnetic separation rougher stage. Each factor was varied three levels.
Table 3. The level of factors in the full factorial design of high-intensity magnetic separation experiments.
Factor Low level Center level High level
A: Field intensity (Ampere & Tesla) 1.2 1.45 1.7
B: Feed water flowrate (lpm) 2 3.5 5
C: Speed of drum (rpm) 1 2 3
2.4. Magnetic Experiments
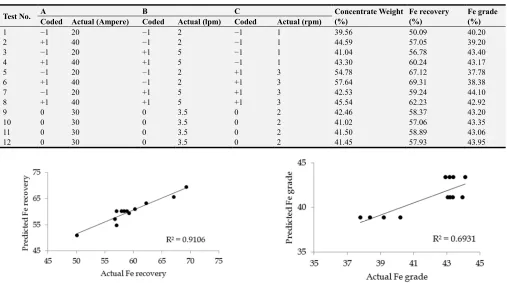
Twelve magnetic experiments were designed using full factorial design. The experimental conditions and their responses are shown in Table 4. The results were added to “Design Expert (DX)” software and a quadratic model was chosen and fitted to them. Two models were fitted to Fe recovery and Fe grade.
Quadratic models found to be adequate for the prediction of the response variables are given by the following equations:
Grade (%) = 41.14+2.25B (1)
Recovery (%) = 60.26+1.95A+4.22C-3.1BC (2)
In these models all factors are in coded values and A, B and C are magnetic field intensity, feed water flowrate and Speed of drum, respectively. BC is the interaction of between B and C factors. Table 5 shows the analysis of variance (ANOVA) of the developed models. It demonstrates that all fitted models are significant at 95% confidence level (p-value < 0.05). Figures 4 and 5 represent predicted against actual values for Fe recovery and Fe grade, respectively. R-square Values of models are shown in these figures. The high R-square value indicates that the quadratic equation is capable of representing the system under the given experimental domain [12].
Table 4. Experimental scheme of magnetic tests and achieved results.
Test No. A B C Concentrate Weight
(%)
Fe recovery (%)
Fe grade (%) Coded Actual (Ampere) Coded Actual (lpm) Coded Actual (rpm)
1 −1 20 −1 2 −1 1 39.56 50.09 40.20
2 +1 40 −1 2 −1 1 44.59 57.05 39.20
3 −1 20 +1 5 −1 1 41.04 56.78 43.40
4 +1 40 +1 5 −1 1 43.30 60.24 43.17
5 −1 20 −1 2 +1 3 54.78 67.12 37.78
6 +1 40 −1 2 +1 3 57.64 69.31 38.38
7 −1 20 +1 5 +1 3 42.53 59.24 44.10
8 +1 40 +1 5 +1 3 45.54 62.23 42.92
9 0 30 0 3.5 0 2 42.46 58.37 43.20
10 0 30 0 3.5 0 2 41.02 57.06 43.35
11 0 30 0 3.5 0 2 41.50 58.89 43.06
12 0 30 0 3.5 0 2 41.45 57.93 43.95
Table 5. The ANOVA results of selected factorial models.
Source Sum of Squares df Mean Square F Value p-value
Fe Grade 40.64 1 40.64 71.94 < 0.0001
Fe Recovery 249.85 3 83.28 49.90 < 0.0001
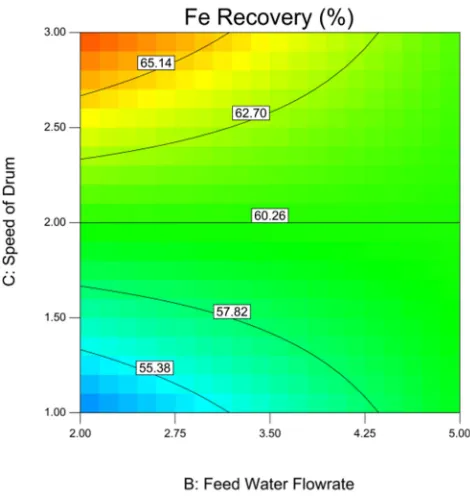
Main effects of factors on grade and recovery are indicated in Figures 6-8. These results were obtained at the midpoint of other factors. However, interaction between feed water flowrate and speed of drum factors had significant effects on recovery, therefore results were presented and discussed according to interaction. Figures 9 and 10 presents the effect of feed water flowrate and speed of drum on the Fe recovery.
Figure 6. Effect of drum speed factor on Fe recovery.
Figure 7. Effect of field intensity factor on Fe recovery.
Figure 8. Effect of feed water flowrate factor on Fe grade.
Figure 9. Interaction effect of feed water flowrate and speed of drum on the Fe recovery in field intensity 30 ampere (A).
Figure 10. Interaction effect of feed water flowrate and speed of drum on the Fe recovery in field intensity 30 ampere (A).
As shown in Figure 6. Fe grade is related to the feed water flowrate and its value improves in terms of increasing feed water flowrate. Also field intensity and speed of drum factors have the main effects on Fe recovery and increasing of each factor causes to improve Fe recovery. Figure 7 represents the interaction effect of between feed water flowrate and speed of drum factors on Fe recovery. It is indicated that Fe recovery increases when the speed of drum factor is positioned on its low level, while Fe recovery decreases by selecting the high level of this factor
.
2.5. Optimization of Experiments Results
The purpose of experiment design is to find a desirable situation in the design space which could be a maximum, a minimum, or an area where the response is stable over a range of factors [12]. In this research, a simultaneous optimization technique was used (by DX software) for optimization of multiple responses. Finding the conditions for achieving to maximum grade or minimum recovery was the target of these experiments. Several optimum conditions were shown in table 6.
Table 6. Conditions and results of optimized experiments.
Condition Levels of factors Software results Experiment results
A B C Fe grade (%) Fe recovery (%) Fe grade (%) Fe recovery (%)
Maximum grade 30 5 2.5 43.4 60.81 42.89 62.1
Maximum recovery 40 2 3 38.89 69.32 38.38 69.31
Fe grade: at least %40 40 3 1 40.4 57.37 39.87 57.83
2.6. Supplementary Experiments of High-Intensity Magnetic Separation
Figure 11. Size distribution plot of a representative sample from tailings of rougher experiments.
Several experiments were conducted on the tailings of experiments which done in rougher stage. At first, tailings of twelve rougher experiments were mixed together and the representative samples were selected after homogenizing. Average Fe grade of tailing sample was specified 21%. Some
magnetic experiments were implemented on these samples. Also the sieve analysis was done on a sample. The results of this sieve analysis were presented Figure 11.
Figure 11 is shown more than 64% of the rougher tailing sample is finer than 38 microns. So these samples were re-ground to a P80 of 35 microns and then three experiments with different conditions were implemented on them. Table 7 represents the results of magnetic experiments which were conducted on rougher tailings.
Tests 1 and 3 in table 7 were produced a concentrate with Fe grade lower than the Fe grade of rougher experiment feeds. Test no. 2 was produced a concentrate with a Fe grade of 32.75%, which is a little higher than rougher experiment feeds, although Fe recovery of this test was very low, 15.89%. Results of rougher tailing experiments were represented that there is a low potential for concentrating tailings of rougher experiments. So experiments were completed with target of maximum recovery in rougher stage and reprocessing of rougher concentrate.
Table 7. Obtained results of magnetic separation experiments on rougher tailings.
Test No.
Factor levels Results
Field intensity (Tesla) Feed water flowrate (lpm) Speed of drum (rpm) Concentrate Weight (%) Fe grade (%) Fe recovery (%)
1 1.7 2 3 32.96 24.92 39.11
2 1.45 3 1 10.19 32.75 15.89
3 1.2 3 2 18.43 28.47 24.98
2.7. Cleaner and Re-Cleaner Experiments on Rougher Concentrate
Several experiments with different operational conditions were implemented on rougher concentrate with the aim of increasing grade. Firstly, the maximum recovery was accounted as a target in experiments of rougher stage. Then experiments of
cleaner and re-cleaner stages were completed on rougher concentrate according to the best operating conditions on rougher stage. Cleaner experiment was completed on Concentrate of the rougher experiment no. 6 which produced a concentrate with maximum Fe recovery 69.31% and Fe grade 38.38%. Table 8 represents the levels of effective factors and the results of cleaner experiments on rougher concentrate.
Table 8. Achieved results of cleaner experiments on rougher concentrate.
Product Weight (%) Fe grade (%) Relative Fe recovery (%) Total Fe recovery (%)
Feed 100 38.38 100 69.31
Concentrate 63.90 48.16 70.18 48.64
Tailing 36.10 25.97 29.72 20.60
Cleaner experiment produced a concentrate with Fe grade and recovery of 48.16% and 48.64%, respectively, as shown in table 9. It is clear that the amount of recovery has considerably decreased, although Fe grade of cleaner
concentrate has risen to 48.16%. In order to investigate increasing of Fe grade, re-cleaner experiment was designed that implemented on concentrate of cleaner experiment. The results of this experiment are presented in table 9.
Table 9. Achieved results of re-cleaner experiment on cleaner concentrate.
Product Weight (%) Fe grade (%) Relative Fe recovery (%) Total Fe recovery (%)
Feed 100 48.16 100 48.64
Concentrate 68.04 56.12 79.28 38.56
The results of re-cleaner experiment show that a concentrate was produced with Fe grade and recovery of 56.12% and 38.56%, respectively. Also, relative Fe recovery of cleaner and re-cleaner stages were 70.18% and 79.28%, while Fe recovery of rougher stage was 69.31%. Table 10 shows the final results of magnetic experiments with one rougher stage and two cleaner stages.
Table 10. Final results of magnetic experiments.
Product Weight (%) Fe grade (%) Fe recovery (%)
Feed 100 31.48 100
Concentrate 25.06 56.12 38.56
Tailing 74.94 23.24 61.44
2.8. Dry High-intensity Magnetic Separation (DHIMS)
Dry high-intensity magnetic separators are proper for processing of coarse particles [13]. Dry high-intensity magnetic experiments were completed using dry induced roll separator which was available in mineral processing lab. Dividing blades between tailing, medium and concentrate parts are adjustable according to degree in this separator. Increasing angle of dividing medium-concentrate blade caused to increases Fe grade and decreases Fe recovery. Also increasing angle of dividing tailing-medium blade caused to pull more amount of feed to tailing.
Dry sieve analysis and Fe grade distribution on different size fractions were presented in Table 11. Regarding to Fe grade distribution on different size fractions, two samples were provided and tested from size fractions of -1000+150 micron and coarser than 1000 micron. All dry magnetic experiments were implemented in field intensity 1.7 tesla and speed of drum 80 rpm.
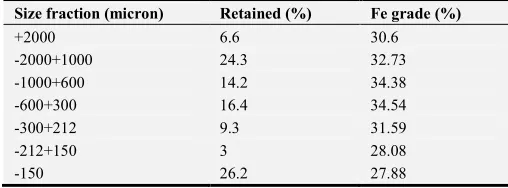
Table 11. Results of dry sieve analysis and Fe grade distribution on different size fractions.
Size fraction (micron) Retained (%) Fe grade (%)
+2000 6.6 30.6
-2000+1000 24.3 32.73
-1000+600 14.2 34.38
-600+300 16.4 34.54
-300+212 9.3 31.59
-212+150 3 28.08
-150 26.2 27.88
2.8.1. Dry Magnetic Experiments on Size Fraction Coarser than 1000 Micron
Several experiments were done on a sample that provided from size fraction coarser than 1000 micron. Tailing dividing blade was adjusted on 80 degrees and the particles that pulled into medium and concentrate parts, they were mixed and accounted as final concentrate. The final concentrate of first concentrating stage was reprocessed with conditions which were similar to first stage. Concentrate of cleaner stage was accounted as final concentrate. The results of dry magnetic experiments were presented in table 12.
Table 12. Obtained results of dry magnetic experiments on size fraction coarser than 1000 micron.
Product Weight (%) Fe grade (%) Fe recovery (%)
First stage feed 100 31.39 100
First stage concentrate 77.62 39.24 97.003
First stage tailing 22.38 4.17 2.97
Second stage feed 77.62 39.24 97.03
Second stage concentrate 74.06 40.32 95.11
Second stage tailing 3.56 16.89 1.92
Final concentrate 74.06 40.32 95.11
Final tailing 3.56 16.89 1.92
The results of dry magnetic experiments showed that a concentrate was produced with Fe grade and recovery of 40.32% and 95.11%, respectively after two stages of concentrating. It is clear that one stage cleaning has very little effect on Fe grade and the majority of iron minerals lockedwithin gangue materials.
2.8.2. Dry Magnetic Experiments on Size Fraction of -1000+150 Micron
In addition, several experiments were implemented on a sample that provided from size fraction of -1000+150 micron. Different angles of dividing blade were investigated in this part of experiments. Tailing dividing blade and concentrate dividing blade was finally adjusted on 80 and 90 degrees, respectively. First stage of magnetic separation had three products of concentrate, medium and tailing. Medium of first stage was reprocessed using separator. Concentrates of first and second stages were mixed together and they were defined as final concentrate. the results of these experiments were presented in table 13.
Table 13. Obtained results of dry magnetic experiments on size fraction of -1000+150 micron.
Product Weight (%) Fe grade (%) Fe recovery (%)
First stage feed 100 31.33 100
First stage concentrate 29.32 46.07 43.11
First stage medium 56.84 30.86 55.94
First stage tailing 13.84 2.03 0.95
Second stage feed 56.84 30.86 55.94
Second stage concentrate 22.95 43.72 32.5
Second stage medium 28.70 24.15 22.49
Second stage tailing 5.19 5.66 0.95
Final concentrate 52.27 45.04 75.14
Final medium 28.70 24.15 22.49
Final tailing 19.03 3.02 2.37
Two stages of magnetic separation was produced a concentrate with Fe grade and recovery of 45.04% and 75.14%, respectively. The results of experiments which completed on this size fraction sample shows that liberation of iron minerals was slightly improved.
3. Results and Discussion
concentrate low Fe grade ores in order to reach the quality demand of the steel mills [14]. Investigations and studies on processing low-grade ores showed that it is possible to increase the Fe grade from approximate 30% to more than 50%. In fact, the obtained concentrates when compared with the magnetic concentration feed, it is deemed satisfactory for rougher operation or even blast furnace [15-17]. In this paper, the iron
low-grade ore sample -with size distributions finer than 5 mm and concentration of more than 40% iron content at the particles finer than 75 microns- is processed. As shown at the table 14, there is the possibility of achieving to a concentrate with Fe grade more than 55% although Fe recovery is considerable lower than achieved values at the other papers.
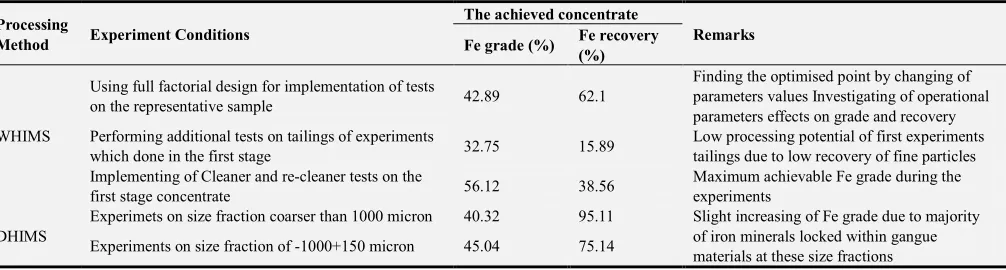
Table 14. The summary of experiments and achieved results.
Processing
Method Experiment Conditions
The achieved concentrate
Remarks Fe grade (%) Fe recovery
(%)
WHIMS
Using full factorial design for implementation of tests
on the representative sample 42.89 62.1
Finding the optimised point by changing of parameters values Investigating of operational parameters effects on grade and recovery Performing additional tests on tailings of experiments
which done in the first stage 32.75 15.89
Low processing potential of first experiments tailings due to low recovery of fine particles Implementing of Cleaner and re-cleaner tests on the
first stage concentrate 56.12 38.56
Maximum achievable Fe grade during the experiments
DHIMS
Experimets on size fraction coarser than 1000 micron 40.32 95.11 Slight increasing of Fe grade due to majority of iron minerals locked within gangue materials at these size fractions
Experiments on size fraction of -1000+150 micron 45.04 75.14
Wet magnetic separation methods in comparison with dry processing methods are more efficient, because the most of iron minerals for this kind of ores are concentrated at fine particles and dry magnetic separation methods doesn’t have appropriate efficiency for fine particles [18]. Degree of liberation is one of the most factors for selecting of processing method [13]. As mentioned above, because of low liberation degree of iron minerals at size fractions larger than 150 microns, DHIMS methods aren’t able to increasing of iron grade considerably.
4. Conclusions
Mineralogical analyses, thin section and polish studies have specified that the deposit is a kind of low-grade iron pigment containing Fe grade 31% and earthy Hematite is main iron mineral. Wet and dry high intensity magnetic experiments were performed on this deposit. Rougher stage of WHIMS experiments was completed using full factorial design and field intensity, feed water flowrate and speed of drum were the effective factors on separator performance. Two quadratic models were developed for Fe grade and Fe recovery. Feed water flowrate was the most effective factor on Fe grade. Also speed of drum and field intensity and interaction between feed water flowrate and speed of drum were the most important factors which effect on Fe recovery. First stage of WHIMS was produced a concentrate with Fe grade and recovery of 38.38% and 69.31%, respectively while optimum operational conditions of separator were field intensity 1.7 tesla, feed water flowrate 5 lpm and speed of drum 2 rpm. Also two cleaning stages of rougher concentrate on WHIMS experiments was produced a concentrate with Fe grade and recovery of 56.12% and 38.56%, respectively. The results of WHIMS experiments showed that Fe recovery sharply decreases after two stage of cleaning because of being Hematite mineral in earhty form in this deposit. Dry
high intensity experiments produced a concentrate with Fe grade of %40.32 and relative Fe recovery of %95.11 on size fraction coarser than 1000 micron and -1000+150 micron with grade %45.04 Fe and relative recovery %75.14. This ore was a representative sample of low-grade iron pigment deposits in Iran and results of experiments shows that there is a low capability for improving of their qualities and grade. Concentrate which obtained from experiment could be used as an initial feed of producing pigment.
Acknowledgements
The author would like to thank all laboratory crews of school of mining engineering at university of Tehran for cooperating.
References
[1] Jafarzaden, A. G., Geology of Iran, iron deposits. Tehran: Geological survey and mineral explorations Country, Iran, 1996.
[2] Kogel J. E., Trivedi N. C., Barker J. M., Krukowski S. T., Industrial Minerals & Rocks: Commodities, Markets, and Uses, SME. USA, 2006.
[3] Salehi, A., Mehmanavazan, D., Eshghabadi, D, Prospecting and exploration report of red ochre in Central Iran. Tehran: Geological survey and mineral explorations Country, Iran, 1989.
[4] Karimpour, M. Industrial minerals and rocks, University of Ferdowsi press, Iran, 2007.
[5] Svoboda J., Fujita T., Recent developments in magnetic methods of material separation, Minerals Engineering, 2003, 16, 785-792.
[7] Rath, R. K., Gravity concentration of iron ores. Advanced Gravity Separation, 2007.
[8] Rath, R. K., Beneficiation response of a low grade iron ore from eastern India for the production of sinter and pellet feed. Proceedings of the XI International Mineral Processing Technology, New Dehli, 2010, 179-185.
[9] Jyoti, D. R, Beneficiation of a finely disseminated low-grade iron ore by froth flotation. Proceedings of the XI International Mineral Processing Technology, New Dehli, 2010, 590-596. [10] Liqun, L. S., Recovering limonite from Australia iron ores by
flocculation high intensity magnetic separation. Journal of Central South University, 2005, 682-687.
[11] Anderson, M. J., DOE Simplified: Practical Tools for Effective Experimentation. Productivity Press, 2007.
[12] Mehrabani, J. V., Process optimization and modelling of sphalerite flotation from a low-grade Zn-Pb ore using response surface methodology. Journal of Separation and Purification Technology, 2010, 242-249.
[13] Wills BA. Mineral processing technology – an introduction to the practical aspects of ore treatment and mineral recovery.5th ed. Cornwall, UK: Camborne School of Mines, 1992.
[14] Pedro D. D., Guilherme B. C., Margarida M. Fe. L., Rosa M. F. L., Characterization and magnetic concentration of an iron ore tailings, Journal of Materials Research and Technology, 2018.
[15] Al-Wakeel M. I., Abd El-Rahman M. K., Beneficiation of low grade Ghorabi iron ore, Bahariya Oasis, Egypt: A case study, Mineral Processing and Extractive Metallurgy IMM Transactions Section C, 2006, 115, 177-182.
[16] Chen L., Xiong D., Huang H., Pulsating high-gradient magnetic separation of fine hematite from tailings, 2009, 26, 163-168.
[17] Yu J., Han Y., Li Y., Gao P., Separation and recovery of iron from a low-grade carbonate-bearing iron ore using magnetizing roasting followed by magnetic separation, 2017, 52, 1768-1774.