DOI: 10.7324/JAPS.2018.8609 ISSN 2231-3354
© 2018 M. Ajay Babu et al. This is an open access article distributed under the terms of the Creative Commons Attribution License -NonCommercial-ShareAlikeUn-ported License (http://creativecommons.org/licenses/by-nc-sa/3.0/).
*Corresponding Author
M. Ajay Babu, Koneru Lakshmaiah Education Foundation, Vaddeswaram, Guntur District, A.P., India.
E-mail: ajaymakineni @ yahoo.co.in
A Sensitive, Stability indicating UPLC method for the identification
and characterization of forced degradation products for Drometrizole
Trisiloxane through MS
nstudies
M. Ajay Babu1,2*, G. V. Krishna Mohan1, J. Satish2, Pradipbhai D. Kalariya2, CH. Krishnam Raju1,2, Sharad D. Mankumare2 1Koneru Lakshmaiah Education Foundation, Vaddeswaram, Guntur District, India.
2USP India Private Limited, IKP Knowledge Park, Hyderabad, India.
ARTICLE INFO ABSTRACT
Article history: Received on: 25/04/2018 Accepted on: 30/05/2018 Available online: 29/06/2018
A rapid, simple and reliable gradient ultra performance liquid chromatography combined with tandem mass spectrometry method was developed and validated for separation, recognition, and characterization of forced degradation products for Drometrizole Trisiloxane. As per International Conference on Harmonization guidelines, the drug was exposed to acidic, basic, photolytic, oxidative and thermal conditions. The main drug shows extensive degradation towards stress conditions such as acid and base hydrolysis. The three degradation products were identified. The chromatographic separation was achieved through the C8 column 2.1 × 100, 1.8 µm) from linear gradient elution and the wavelength detection was set at 305 nm for drug and its forced degradation products. The parameters such as specificity, linearity, accuracy, precision, and robustness were used for validation of the method. The sequential pathway for the fragments was achieved through the acquired mass spectra from drug and its degradation products through LC/MS/MS studies. Accurate masses of drug and its degradation products were confirmed through LC-MS/Q-ToF analysis. Degradation products were characterized by comparing with the pattern of drug molecule fragmentation.
Key words:
Drometrizole Trisiloxane, Stability indicating, UPLC, Degradation Products, Characterization, LC-MS/ MS.
INTRODUCTION
Drometrizole Trisiloxane (DRT) is UV absorber and UV
filter. It is a lipophilic benzotriazole derivative and widely used in
sunscreen cosmetics which help in the absorption of UV radiation. The drug is soluble in oils and photostable compound. UV sunscreen
cosmetic product containing UV filters in its formulation helps in protecting the skin from direct exposure to the UV-light and
avoids or minimizes the damage due to the UV radiation which
causes human health problems. To prevent the harmful effect on
the skin through UV radiation leads to the development of organic
chemicals called as UV filters (Hughes et al., 2005). The quality of Stability features of active pharmaceutical ingredient (API), explains the drug product quality attributes. The inherent stability of chemical from drug molecule can be found by carrying out
various forced degradation studies with different conditions like
acidic and basic hydrolysis, photolysis, oxidation and thermal. These studies are especially important for the daily usage of drugs and help in recognizing the proper storage conditions and for drug
formulations (Abiramasundari et al., 2015).
Literature survey reveals following methods reported viz.
the determination studies for sixteen different UV filters in sun care formulations by using high-performance liquid chromatography
(Schakel et al., 2004); Simultaneous determination of thirteen
UV Filters in Sunscreen Products (Application note, Schimadzu,
2006). The drug substance monograph on Drometrizole Trisiloxane
in Authorized USP Pending monograph (USP, Authorized pending
monograph, 2011) lists six impurities. There were no systematic studies found for the forced degradation behavior of DRT. In recent days, many works were published on characterization studies of probable impurities developed from API and formulation drugs
using ICH guidelines with different advanced analytical test
methods (Abiramasundari et al., 2015; Chinthalpati et al., 2018;
Krishnam et al., 2017b; Prasad et al., 2016; Roshan et al., 2012). The recognition of degradation products for DRT helps in further metabolic studies and helps in determination of process related impurity during its bulk synthesis. We have focused our research into three stages in the present study as follows: 1) To
develop a suitable validated method by using reversed-phase Ultra performance liquid chromatography (RP-UPLC) for recognition of
degradation products formed during application of various forced
conditions on drug as per ICH guidelines (International Conference
on Harmonization, 2006). 2) Identification and characterization of
degradation products using ultra performance liquid chromatography
(UPLC) combined with tandem mass spectroscopy (LC/MSn). 3)
The degradation products were subjected through LC-MS/Q-TOF to confirm the proposed structures.
EXPERIMENTAL Drugs and reagents
DRT and its related impurity samples were used from
USP-India, Hyderabad. High pure HPLC grade solvents like
Methanol, Acetonitrile, and chemicals like hydrochloric acid, sodium hydroxide, and hydrogen peroxide were used from Merck
Corporation, Mumbai, India. The high grade purified water was obtained from a Milli-Q-Water purification system (Millipore
Corporation, Billerica, MA, USA).
Instrumentation
The Waters Acquity H-Class UPLC system provided with
photodiode array (PDA) detector and Zorbax SB RRHD C8, 100 mm × 2.1 mm column packed with 1.8 µm particles from Agilent was used for the chromatographic separation. The Empower 3 software was used for chromatographic data acquisition. All weights were done on Sartorius balances (CPA225D). The photostability chamber from Atlas SUNTEST XLS+ (Atlas Material Testing, USA) was
used for photolytic stress study. The Espec SH-642 Temperature
and Humidity Benchtop Chamber (AT Equipment Corporation, CA, USA) was used for humidity stress study. The stress study for
thermal conditions was performed in a Memmert hot air oven
(100-800 Model, Make: Memmert KG, Germany).
The ion trap mass spectrometer from Thermo Scientific,
USA attached to a Dionex Ultimate 3000 UPLC quaternary
gradient was used to perform LCMS/MS analysis. LC-MS/MS experimental studies were performed to identify the different
patterns of fragmentation of DP1, DP2, DP3, and DRT which
creates linkage in a well-ordered manner helps to draw the
structures for fragments. The heated electrospray ionization (HESI) source was used for analysis of MS study using both ion modes such as positive and negative. The parameter settings for a mass source were used are 4.0 kV of voltage for the source, 350°C temperature for capillary, 350°C temperature for source heater,
45.0 sheath gas flow, 20.0 of auxiliary gas flow, 60% S-Lens RF
level. The data acquisition was done through Xcalibur software (Krishnam et al., 2017b).
The SYNAPT G2Q-TOF mass spectrometer from Waters Corporation attached to Waters Acquity H-Class UPLC having a quaternary gradient pump was used to perform the LC-Q-TOF-MS
analysis. This study helps to recognize and drive suggested chemical formula for the degradation products by providing mass measurements in accurate from mass accuracy studies. Mass
spectrometry analysis was performed with the positive ion mode using electrospray ionization (ESI) source. Parameter settings for a source were kept as follows; 3.25 kV of capillary voltage, 120°C of source temperature, 250°C of desolvation temperature,
40 V of sampling cone, 3.0 V of extract ion cone, and 800 L h−1
of desolvation gas flow. The data acquisition was done through
Masslynx 4.1 software (Krishnam et al., 2017b).
Chromatographic conditions
The column used was Agilent SB RRHD C8 (100 mm × 2.1 mm) with 1.8 µm particles for the studies on chromatographic separation. The water (Solution A) was used as mobile phase A and methanol (Solution B) was used as mobile phase B. Flow rate for
the mobile phase was maintained at 0.25 mL min−1. The gradient
for UPLC was set as time (min)/% Solution B: 0/80, 6/80, 10/100,
16/100, 16.2/80 and 18/20. The temperature for the column was maintained at 30°C and the wavelength was kept as 305 nm. The volume of 2 µL was used for the injection. The diluent used for
the analysis was methanol. The 100 µg mL−1 concentration for the
sample was used for Assay and 500 µg/mL−1 concentration for the
sample was used for related substances.
Preparation of sample solution for assay
Accurately weighed and transferred 10 mg of Drometrizole Trisiloxane into 100 ml dry and clean volumetric
flask (VF) and 70 ml of methanol was added, dissolve completely
and dilute to volume with methanol up to the mark to obtain 100
µg mL−1 concentration.
Preparation of organic impurities sample solution
Accurately weighed and transferred 10 mg of Drometrizole
Trisiloxane into a 20 mL clean dry volumetric flask, added 7 mL
methanol to dissolve completely and made the volume up to the
mark with the methanol to obtain a concentration of 500 µg mL−1.
Preparation of impurity standard solutions
A impurities stock solution containing a mixture of impurity (Imp)1, Imp2, Imp 3, Imp4, Imp5 and Imp6 at a
concentration of 100 µgmL−1 was also prepared in methanol.
Preparation of organic impurities standard preparation
A preparation of a stock solution of DRT and its
impurities (100 µg mL−1) was made by taking an appropriate
amount in the diluent and dissolves it. The preparation of working solution was done from above stock solution for determination of
organic impurities solution containing 1 µg mL−1 concentration in
the diluent.
Analytical method validation
According to the ICH guidelines (International Conference
on Harmonization, 2005), the developed method was validated and used for determination of DRT and six related compounds. The method was tested using parameters such as system suitability,
linearity, accuracy, sensitivity, specificity, and robustness.
System suitability
This test was performed by injecting the replicates of
µg mL−1 each impurity). The system suitability criterion was
established and confirmed through the parameters using tailing
factor, resolution, percentage RSD and theoretical plates. If the
criteria were not specified consider the values as follows, not less than 1.5 for resolution, not more than 2.0% value for RSD, the tailing factor range can be 0.7–1.3 and column efficiency in terms
of theoretical plates should be greater than 3000.
Linearity
The five different levels of concentration ranges between 0.005 to 1.0% of analyte for impurities were prepared
from stock solutions as impurity linearity solutions. The peak
area versus concentration data were subjected to least-squares
linear regression analysis. The calibration curve was developed by plotting impurity areas against the concentration expressed in
µg mL−1. For the Linearity, test solutions were prepared for assay
method from stock solutions at five concentration levels from 50 to 150% of analyte concentration (50, 75, 100, 125 and 150 µg
mL−1). The calibration curve was drawn by plotting DRT peak
areas against the concentrations expressed in µg mL−1.
Accuracy
The accuracy of related substance method was evaluated
in triplicate at 0.005% to 1.0%, of analyte concentration (500 µg
mL−1). The percentage of recovery for all impurities was calculated.
For bulk drugs, assay method accuracy was evaluated in triplicate
at three different levels of concentration from 50 to 150 µg mL−1.
Prepared and injected three sets of solutions in triplicate at each concentration. The percentage of recovery was derived.
Sensitivity
The Limit of detection (LOD) and Limit of quantification (LOQ) for all six impurities were estimated at a signal-to-noise
(S/N) ratio of 3:1 and 10:1 respectively to determine the sensitivity of the developed method. For this study, a series of diluted solutions are injected having known concentration of impurities. Injected six preparations of all six impurities to perform the precision study
at the LOQ level and calculated the percentage relative standard
deviation for the areas of each impurity (Thomas et al., 2012).
Robustness
The experimental conditions were intentionally changed to determine the robustness study of developed method. The system suitability parameter like resolution (Rs) between DRT, Imp1, Imp2, Imp3, Imp4, Imp5 and Imp6 was evaluated. The
actual flow rate for mobile phase was 0.25 mLmin−1. The flow rate
effect on developed method was studied as follows, 0.02 flow units
were changed (i.e. 0.23 and 0.27 mLmin−1). The effect of column
temperature was studied at 20°C and 30°C in place of 25°C for the developed method. The mobile phase components were remained
constant in all of the above-varied conditions.
Specificity
The peak response for the analyte in the presence of its
potential impurities was measured through specificity study. Drug
substance stress testing was carried out to recognize the possible degradation products. This study helps to determine the inherent stability of the molecule and establish its degradation pathways.
Stress degradation studies were performed at an initial
concentration of 100 µg mL−1 of DRT in active pharmaceutical
ingredients to provide the stability-indicating property and specificity
of the method as per ICH guidelines (2003). The degradation studies
were carried out by attempting intentionally for stress conditions as follows: Acid (0.0001 M HCl for 6 hours at room temperature),
Base (0.1 M NaOH for 1 hour at room temperature), Oxidation (6%
peroxide for 24 hours at room temperature), Thermal (Exposed at
105°C for 48 h), Humidity (Exposed to 85°C and 85% RH for 3
days) and photolytic stress (1.2 million lux hours followed by 200
watt-hours per square meter).
RESULTS AND DISCUSSION Method development and optimization
The main aim of this study to develop a new accurate, reproducible, robust and stability indicating, linear method for determination of DRT and its impurities by using RP UPLC, which helps for quality control laboratories routine use and to develop the method which is compatible for LC/MS to perform MS studies both qualitative and quantitatively.
To identify the wavelength maximum absorbance for DRT and its impurities, the individual stock solutions were scanned through photodiode array detector from 200 to 400 nm
range and scrutinized the spectrum of each component at different wavelengths. Then identified and confirmed that DRT and its
impurities are having the maximum absorbance at about 305 nm wavelength. Based on this study, the wavelength at 305 nm was selected for this research work to identify and characterize the DRT and all impurities.
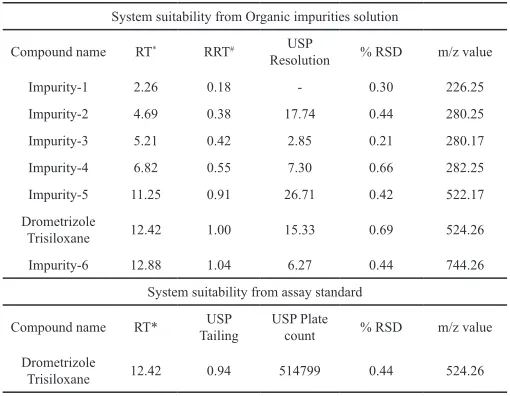
Table 1: System suitability results.
System suitability from Organic impurities solution
Compound name RT* RRT# USP
Resolution % RSD m/z value
Impurity-1 2.26 0.18 - 0.30 226.25
Impurity-2 4.69 0.38 17.74 0.44 280.25
Impurity-3 5.21 0.42 2.85 0.21 280.17
Impurity-4 6.82 0.55 7.30 0.66 282.25
Impurity-5 11.25 0.91 26.71 0.42 522.17
Drometrizole
Trisiloxane 12.42 1.00 15.33 0.69 524.26
Impurity-6 12.88 1.04 6.27 0.44 744.26
System suitability from assay standard
Compound name RT* TailingUSP USP Plate count % RSD m/z value
Drometrizole
Trisiloxane 12.42 0.94 514799 0.44 524.26
*RT: Retention time; #RRT: Relative Retention time.
Table 1 shows DRT and its impurities were scanned in
LC-MS detector and m/z values were identified for known and
unknown impurities. The 1000 µg mL−1 DRT sample preparation
spiked with all the impurities (1 µg mL−1) was used for the
separation by RP-UPLC using different buffers, differences in gradient elution by using different columns. The more desirable
separation was achieved from C8 column compared to other
and identified with UPLC and LC-MS on Agilent SB C8 RRHD
(100 × 2.1) mm with 1.8 µm column. The water was used as mobile phase A and methanol was used as mobile phase B. The
mobile phase flow rate was kept at 0.25 mL min−1. The program for
gradient was set as: time (min)/% solution B: 0/80, 6/80, 10/100,
16/100, 16.2/80 and 18/80. The temperature for the column was kept at 30°C and the wavelength detection was recorded at 305 nm. The 2 µL volume of solution was used for injection and the
used diluent was methanol. The 500 µg mL−1 concentration for
related substances sample and 100 µg mL−1 concentration for
assay method sample were used. The relative retention times (RRT) for Imp1, Imp2, Imp3, Imp4, Imp5 and Imp6 were 0.18,
0.38, 0.42, 0.55, 0.91 and 1.04 respectively (Table 1).
Method Validation
Precision
For Assay method, the Percentage RSD for the peak area responses from DRT was 0.4 from precision and intermediate precision study. For the related substances precision method, the percentage RSD for peak area responses of Imp1, Imp2, Imp3,
Imp4, Imp5, and Imp6 were within 2.0, confirming the good
precision of the developed analytical method (Table 1).
Sensitivity
This study represents the drug concentration that
achieves a signal-to-noise ratio of 3 for LOD and 10 for LOQ.
The drug concentration was found to be 0.03 µg mL−1 and 0.10
µg mL−1, respectively for LOD and LOQ. The percentage RSD
for all impurities was below 2% from the precision study at LOQ
concentration.
To achieve the resolution between Imp-2 and imp-3 peaks
was critical. Resulting, the optimization of the method was done to achieve resolution factor (Rs) above 2.0. The tailing factor was attained less than 1.0. The accuracy was calculated by injecting all
impurities at three different levels of concentration, i.e., 80%, 100% and 120% with respect to target level with triplicate injections for
the developed method. The high recovery percentages averaging
between 98.3–101.6% were achieved through this method. The
linearity of the assay was tested from 0.05 g mL−1 to 0.15 g mL−1
for DRT and six impurities. This developed method demonstrated
good linearity within tested range and the correlation coefficients
(R2) were greater than 0.999 for DRT and its six impurities.
Stress studies and drug degradation behavior
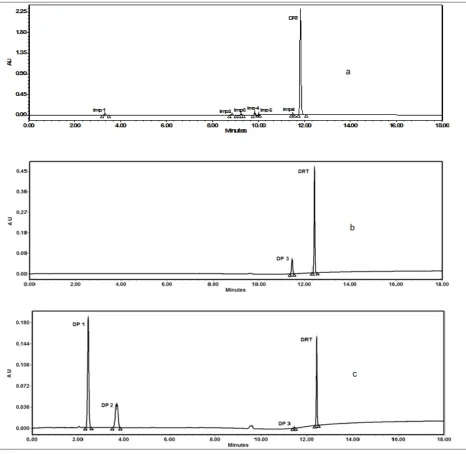
The drug showed extensive degradation in 0.0001 M HCl for 6 hours at room temperature and one degradation product
(DP3) was formed (Figure 1). This drug has shown remarkable
degradation towards 0.1 M NaOH treatment at room temperature
and after 1 hour three degradation products (DP1, DP, and DP3)
were formed (Figure 1).
DRT was stable under oxidation, photolysis, thermal
and humidity conditions. No significant degradation was observed
until the study period.
The Peak purity test results derived from PDA detector
from degradation studies confirm that DRT peak was pure and
homogeneous from all analyzed stress samples. The mass balance values were calculated for all stressed samples and observed all
values were close to 99.6%. This study confirms the developed method by UPLC was found to be specific in the presence of all
impurities and its degradation products and indicates the stability power of this method.
During a study on stress degradation, a total of three DP1, DP2 and DP3 were formed from DRT. Among all the degradation
products (DPs), DP1 and DP2 were formed and identified under alkaline conditions; DP3 was formed and identified in both acidic
and alkaline conditions. The chromatogram shows clear separation
of DRT and all the DPs were shown in Figure 2. The DPs of DRT
are marked as DP1 to DP3 in the sequence of peak appeared from left to right in the chromatogram. From this stress studies, the DRT was found to be more susceptible to both acidic and alkaline studies. The forced degradation study and stress composition
behavior data were shown in Table 2.
Characterization of DRT and its degradation products
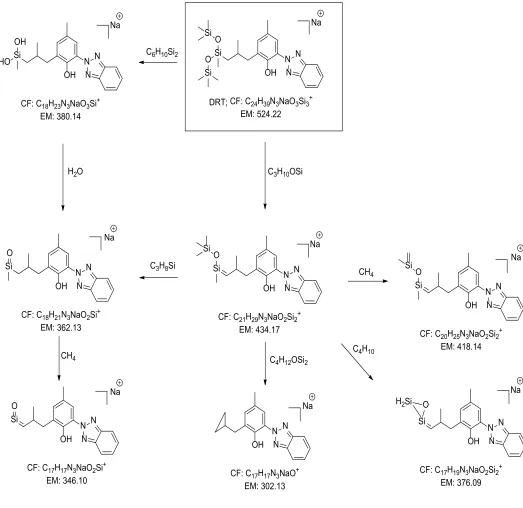
From DRT MS studies, the total of six fragments were
formed and identified. The determination of each fragment origin, a multi-stage (MSn) mass fragmentation study was performed and this
helped to propose the fragmentation pathway of DRT. The molecular ion displays as m/z 524.01 was considered as sodium adduct since the mass was shown ~23 Da higher value than the DRT molecular ion peak (m/z 501.24). To make clear about the degradation patterns
of DRT, ESI-MS Spectrum of DRT molecular ion ([M+Na]+) at m/z
524 was examined. The MS/MS spectrum displays product ions at
m/z 434 (loss of C3H10OSi from m/z 524), m/z 362 (loss of C3H8Si
from m/z 434), m/z 346 (loss of CH4 from m/z 362), 418 (loss of
loss of CH4 from m/z 434), m/z 380 (loss of C6H16Si2 from m/z 524),
m/z 376 (loss of C4H10 from m/z 434). From the data obtained from
LC-MS/MS studies sequence spectra for each degradation product, the final proposed fragmentation pathway of DRT was established.
The proposed pathway of degradation for DRT is shown in Figure 2.
The masses and proposed structures for all the DPs were explained (Ravi et al., 2014).
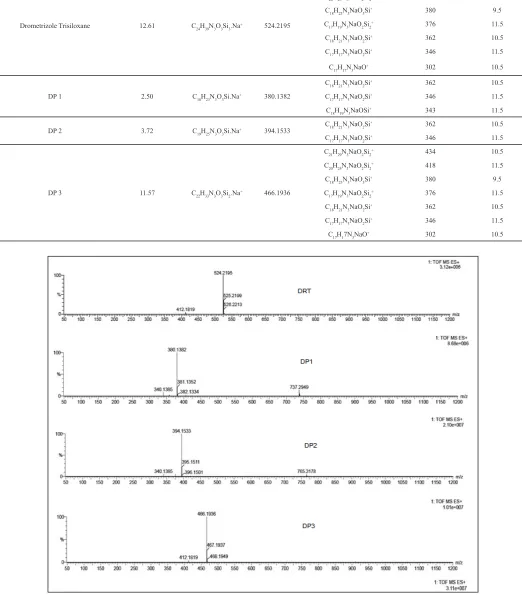
From the LC-ESI-MS spectrum, all three DPs were identified based on [M+H]+ ions observed. Further characterization
for all DPs was performed by selecting molecular ions for MSn
studies. The accurate mass measurement was also conducted to
confirm the molecular formulae of DRT and its DPs. The spectra
from HRMS study for all the DRT and DPs in the positive mode
were shown in Figure 3. The accurate mass data for protonated
molecules was determined and calculated error in parts per million
(ppm) between exact and accurate masses are tabulated in Table
3 and the proposed formulae of fragments are shown in Table 4.
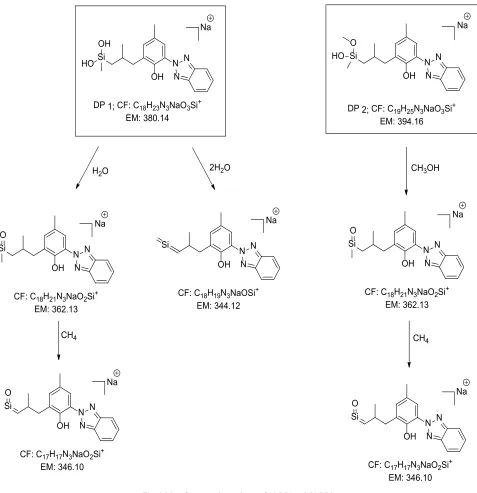
DP1 (m/z 380)
The LC/MS/MS and HRMS data confirm that molecular ions at m/z 380 and 524 are from DP1 and DRT. The significant loss of
C6H16Si2 is due to hydrolysis and loss of two units of trimethylsilanol
in DRT. The spectrum from MS/MS specifies product ions at m/z 362
(loss of H2O from m/z 380), m/z 344 (loss of 2H2O from m/z 380)
and m/z 346 (loss of CH4 from m/z 362). The ESI-QTOF spectrum
showed the molecular formulae of C18H23N3O3SiNa+ with an error
of 5.00 ppm. The molecular ion with m/z 380 was characterized as
(3-(3-(2H-benzo[d][1,2,3]triazol-2-yl)-2-hydroxy-5-methylphenyl)-2-methylpropyl)(methyl)silanediol. The fragmentation pathway of DP1
Fig. 1: Full Chromatograms for (a) organic impurities standard preparation, (b) acid degradation and (c) base degradation.
Table 2: Forced Degradation study data.
Degradation conditions % Degraded, Peak name Purity angle Purity Threshold Mass balance (%)
0.0001 M HCl for 6 hours 18.0, DP 3 0.237 0.341 99.5
0.1 M NaOH bench top at 1 hour at Room temperature
53.0, DP 1 0.215 0.332
99.4
19.5, DP 2 0.247 0.345
1.0, DP 3 0.215 0.327
Stressed with 6% H2O2, 24 hours kept on bench top at Room temperature (No degradation)Main Peak 0.221 0.315 99.6
Thermal at 105°C for t 48 hours (No degradation)Main Peak 0.245 0.352 99.9
Exposed to Visible light for about 1.2 Million Lux-hours and UV light for
about 200 Watt-hours/meter square (No degradation)Main Peak 0.218 0.329 99.8
OH Si
O Si O Si
N N
N Na
OH Si
O Si
N N
N Na
OH Si
O
N N
N Na
OH Si
O H2Si
N N N
Na OH
Si O Si
N N
N Na
OH Si
O
N N
N Na
OH N N
N C3H10OSi
CH4
C3H8Si
CH4 C4H12OSi2 C4H10
Na DRT; CF: C24H39N3NaO3Si3+
EM: 524.22
CF: C18H21N3NaO2Si+
EM: 362.13
CF: C17H17N3NaO+
EM: 302.13 CF: C17H17N3NaO2Si+
EM: 346.10 CF: C17H19N3NaO2Si2
+
EM: 376.09 CF: C20H25N3NaO2Si2+
EM: 418.14 CF: C21H29N3NaO2Si2+
EM: 434.17 OH
HOSi OH
N N
N Na
CF: C18H23N3NaO3Si+
EM: 380.14
H2O
C6H10Si2
Fig. 2: Mass fragmentation pathway of DRT.
Table 3: Mass accuracy table for DRT and its degradation products (DP 1 to DP 3).
Compound Name Retention Time (Min) Molecular formula Calculated m/z Observed m/z Error (mDa)
Drometrizole Trisiloxane 12.61 C24H39N3O3Si3.Na+ 524.2191 524.2195 -0.40
DP 1 2.50 C18H23N3O3Si.Na+ 380.1401 380.1382 1.90
DP 2 3.72 C19H25N3O3Si.Na+ 394.1563 394.1533 3.00
Table 4: MS/MS data of DRT and Degradation products (DP1 to DP3) in ESI positive mode.
Compound name Retention Time (Min) Molecular formula Observed m/z Molecular Formula for Fragment ions (m/z) Fragment Ions (m/z) RDB (Ring Plus Double Bond)
Drometrizole Trisiloxane 12.61 C24H39N3O3Si3.Na+ 524.2195
C21H29N3NaO2Si2+ 434 10.5 C20H25N3NaO2Si2+ 418 11.5
C18H23N3NaO3Si+ 380 9.5
C17H19N3NaO2Si2+ 376 11.5
C18H21N3NaO2Si+ 362 10.5
C17H17N3NaO2Si+ 346 11.5
C17H17N3NaO+ 302 10.5
DP 1 2.50 C18H23N3O3Si.Na+ 380.1382
C18H21N3NaO2Si+ 362 10.5
C17H17N3NaO2Si+ 346 11.5
C18H19N3NaOSi+ 343 11.5
DP 2 3.72 C19H25N3O3Si.Na+ 394.1533
C18H21N3NaO2Si+ 362 10.5
C17H17N3NaO2Si+ 346 11.5
DP 3 11.57 C22H33N3O3Si2.Na+ 466.1936
C21H29N3NaO2Si2+ 434 10.5 C20H25N3NaO2Si2+ 418 11.5
C18H23N3NaO3Si+ 380 9.5
C17H19N3NaO2Si2+ 376 11.5
C18H21N3NaO2Si+ 362 10.5
C17H17N3NaO2Si+ 346 11.5
C17H17N3NaO+ 302 10.5
DP2 (m/z: 394)
The LC/MS/MS and HRMS data confirm that the
molecular ions at m/z 394 and 524 are from DP2 and DRT. The
significant loss of C5H14Si2 is due to water and methanol hydrolysis at two units of trimethylsilanol in DRT. The MS/MS spectrum
specifies product ions at m/z 362 (loss of CH3OH from m/z 394)
and m/z 346 (loss of CH4 from m/z 362). The ESI-QTOF spectrum
showed the molecular formulae of C19H25N3O3SiNa+ with an error
of 7.61 ppm. The molecular ion with m/z 394 was characterized
as (3-(3-(2H-benzo[d][1,2,3]triazol-2-yl)-2-hydroxy-5-methylphenyl)-2-methylpropyl)(methoxy)(methyl)silanol. The
fragmentation pathway of DP2 was shown in Figure 4.
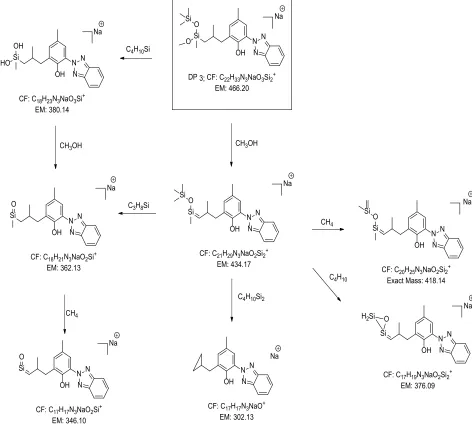
DP3 (m/z: 466)
The LC/MS/MS and HRMS data confirm that the
molecular ions at m/z 466 and 524 are from DP3 and DRT. The
significant loss of C2H6Si is due to methanol hydrolysis and loss of one unit of trimethylsilanol in DRT. The MS/MS Spectrum
specifies product ions at m/z 434 (loss of CH4O), m/z 376 (loss
of C4H10 from m/z 434), m/z 362 (loss of C3H8Si from m/z
434). The ESI-QTOF spectrum showed the molecular formulae
of C22H33N3O3Si2Na+ with an error of 3.65 ppm. The molecular
ion with m/z 394 was characterized as 2-(2H-benzo[d][1,2,3] triazol-2-yl)-6-(3-(1-methoxy-1,3,3,3-tetramethyldiziloxanyl)-2-methylpropyl)-4-methylphenol. The fragmentation pathway of
DP3 was shown in Figure 5.
OH
SiO N N
N Na
OH Si
O
N N
N Na
OH HO Si
OH
N N
N Na
H2O
CH4
2H2O
OH
Si N N
N Na DP 1; CF: C18H23N3NaO3Si+
EM: 380.14
CF: C18H21N3NaO2Si+
EM: 362.13
CF: C18H19N3NaOSi+
EM: 344.12
CF: C17H17N3NaO2Si+
EM: 346.10
OH Si
O
N N
N Na
OH Si
O
N N
N
Na OH
HO Si O
N N
N
CH3OH
CH4
Na
DP 2; CF: C19H25N3NaO3Si+
EM: 394.16
CF: C18H21N3NaO2Si+
EM: 362.13
CF: C17H17N3NaO2Si+
EM: 346.10
OH Si
O Si
N N
N
Na
OH Si
O
N N
N
Na
OH Si
O H2Si
N N N
Na OH
Si O Si
N N
N
Na Na
OH Si
O
N N
N
Na
OH OSi
O Si
N N
N
OH N N
N CH3OH
C3H8Si
CH4
C4H10
C4H10Si2
CH4
Na DP 3; CF: C22H33N3NaO3Si2+
EM: 466.20
CF: C18H21N3NaO2Si+
EM: 362.13
CF: C17H17N3NaO2Si+
EM: 346.10
CF: C21H29N3NaO2Si2+
EM: 434.17
CF: C17H17N3NaO+
EM: 302.13
CF: C20H25N3NaO2Si2+
Exact Mass: 418.14
CF: C17H19N3NaO2Si2+
EM: 376.09 OH
HOSi OH
N N
N Na
CF: C18H23N3NaO3Si+
EM: 380.14
C4H10Si
CH3OH
Fig. 5: Mass fragmentation pathway of DP3.
CONCLUSION
LC-MS compatible stability indicating UPLC method
was developed and validated to describe the stress degradation behavior of DRT under various conditions like hydrolysis (acid, base and neutral), oxidation, photolysis, and thermal. This developed method can be used by the industry for the estimation of DRT in the API, formulations and stability samples. In the
present study, we considered LC/MS/MS and ESI/QTOF/MS/
MS ionization techniques for structural characterization and mass accuracy for the DRT and its three degradation products DP1, DP2 and DP3, respectively formed under acidic and basic conditions. The possibility to synthesize and develop reference standards and
monitor their presence in the stability samples from the identified
degradation products of this study. This developed method to determine and characterization study may be useful for the same class drug analysis.
ACKNOWLEDGMENTS
The authors are thankful for the USP India Private Limited, Hyderabad and Koneru Lakshmaiah Education Foundation, Guntur for arranging required facilities and immense support to publish this research work.
CONFLICTS OF INTEREST
There are no conflicts of interest.
REFERENCES
Abiramasundari A, Sudarsanam V, Kamala KV. Characterization of the degradation products of bambuterol using LCMS-QTOF and NMR. Analytical Methods, 2015; 7:7659-7673.
Chintalapati KR, Jagarlapudi SK, Sanath KG. Isolation and characterization of novel degradation products in cilnidipine by LC-QTOF-MS/MS, LCMSn, 2D-NMR and FTIR. New Journal of Chemistry, 2018;
Drometrizole Trisiloxane, The United States Pharmacopeia, Authorized pending monograph, Version 01, 2011; Rockville, USA [accessed 17 Dec 2013].
Gawande VT, Bothara KG, Marathe AM. Stress Studies and Identification of Degradation Products of Cephalexin Using LC-PDA and LC-MS/MS. Chromatographia, 2017; 80:1545-1552.
Jian W, Fengmei Z, Zhihong Y, Liya H. Separation and Characterization of Unknown Impurities in Amikacin Sulfate by HPLC-MSn. Chromatographia, 2015; 78:1031-1039.
Hughes TM, Martin JA, Lewis VJ, Stone NM. Allergic contact dermatitis to drometrizole trisiloxane in a sunscreen with concomitant sensitivities to other sun screens. Contact Dermatitis, 2005; 52:226–227.
International Conference on Harmonization, ICH Guidelines, Impurities in New Drug Substances, Topic Q3A (R2), Geneva, Switzerland, 2006.
International Conference on Harmonization, ICH Guidelines, Validation of Analytical Procedures: Text and Methodology, Topic Q2 (R1), Geneva, Switzerland, 2005.
International Conference on Harmonization, ICH Guidelines, Stability Testing of New Drug Substances and Products, Topic Q1A (R2), Geneva, Switzerland, 2003.
Krishnam RC, Avadesh KP, Kaushik G, Arunima P, Sanath KG, Mrunal AJ, Sameer NG, Surendranath KV, Isolation and structural characterization of novel photolytic degradation impurities of Deflazacort using Q-TOF, 2D-NMR and FTIR. Journal of Pharmaceutical and Biomedical Analysis, 2017a; 133:82-89.
Krishnam RC, Avadesh KP, Gururaj S, Kaushik G, Arunima P, Sanath KG, Mrunal AJ, Sameer NG. Isolation and characterization of novel degradation products of Doxofylline using HPLC, FTIR, LCMS and NMR. Journal of Pharmaceutical and Biomedical Analysis, 2017b; 140:1-10.
Prasad K, VenkatappaiahV, Pallavi A, Saeed SA, Mukkanti K, Parthasaradhi D. LC-MS/MS characterization of the forced degradation
products of ezetimibe: Development and validation of a stability-indicating UPLC method. Journal of Taibah University for Science, 2016; 10:148–160.
Ravi NT, Nishit S, Vikas B, Anand M. LC, MSn and LC-MS/
MS studies for the characterization of degradation products of amlodipine. Journal of Pharmaceutical Analysis, 2014; 5:33-42.
Roshan MB, Raju B, Srinivasa R, Prashant P, Satheesh SK. Identification and characterization of stressed degradation products of metoprolol using LC/Q-TOF-ESI-MS/MS and MSn experiments.
Biomedical Chromatography, 2012; 26:720-736.
Schakel DJ, Kalsbeek D, Boer K. Determination of sixteen UV filters in suncare formulations by high-performance liquid chromatography. Journal of Chromatography A, 2004; 1049:127-130.
Simultaneous Determination of Thirteen UV filters in Sunscreen Products, Shimadzu Excellence in Science, Application note, 2006, Available at: https://www.ssi.shimadzu.com/sites/ssi.shimadzu.com/ files/Products/literature/Pathfinder/Appl_PF_UV_Filters_06E_en.pdf [Accessed 19 Nov 2016].
Thomas S, Chandra JS, Vir D, Ashutosh A, Raghavendra DR, Sridhar I, Xavier CM, Chandra SM. Identification, characterization and quantification of a new impurity in deferasirox active pharmaceutical ingredient by LC-ESI-QT/MS/MS. Journal of Pharmaceutical and Biomedical Analysis, 2012; 63:112-119.
How to cite this article:
Babu MA, Mohan GVK, Satish J, Kalariya PD, Raju CHK, Mankumare SD. A Sensitive, Stability indicating UPLC method
for the identification and characterization of forced degradation
products for Drometrizole Trisiloxane through MSn studies. J