Evaluation of the Continuous Wavelet Transform for
Detection of Single-Point Rub in Aeroderivative Gas
Turbines with Accelerometers
Alejandro Silva1*ID, Alejandro Zarzo1†, Juan M. Muñoz-Guijosa2and Francesco Miniello3
1 Department of Applied Mathematics, Escuela Técnica Superior de Ingenieros Industriales, Universidad Politécnica de Madrid, Calle de José Gutiérrez Abascal 2, 28006 Madrid, Spain.
2 Department of Mechanical Engineering, Escuela Técnica Superior de Ingenieros Industriales, Universidad Politécnica de Madrid, Calle de José Gutiérrez Abascal 2, 28006 Madrid, Spain.
3 Baker Hughes, a GE Company – Bently Nevada, Calle Josefa Valcárcel 26, 28027 Madrid, Spain. * First author: [email protected]; Phone: +34 687 044 632.
† Corresponding author: [email protected]; Phone: +34 626 517 594
Abstract:A common fault in turbomachinery is rotor–casing rub. Shaft vibration, measured with proximity probes, is the most powerful indicator of rotor-stator rub. However, in machines such as aeroderivative turbines, with increasing industrial relevance in power generation, constructive reasons prevent the use of those sensors, being only acceleration signals at selected casing locations available. This implies several shortcomings in the characterization of the machinery condition, associated with a lower information content about the machine dynamics. In this work we evaluate the performance of the Continuous Wavelet Transform to isolate the accelerometer signal features that characterize rotor–casing rub in an aeroderivative turbine. The evaluation is carried out on a novel rotor model of a rotor-flexible casing system. Due to damped transients and other short-lived features that rub induces in the signals, the Continuous Wavelet Transform proves being more effective than both Fourier and Cepstrum Analysis. This creates the chance for enabling early fault diagnosis of rub before it may cause machine shutdown or damage.
Keywords: machine fault diagnosis; rotordynamics; rub; aeroderivative turbines; accelerometers; early fault detection; fourier analysis; real cepstrum; continuous wavelet transform
1. Introduction
The flawless operation of rotating machinery such as turbomachines plays a key role in many branches of Industry such as electrical power and heat generation, aerospace and naval propulsion, and manufacturing. As their performance levels have risen steadily in the course of time their margins of admissible operation have shrunk. A failure in any of these machines could cause considerable economical or even human losses. So, it becomes convenient to put in place a maintenance program which allows to detect any abnormality in the machinery operation at the early stages, before a fault at an advance stage forced it to be put out of duty.
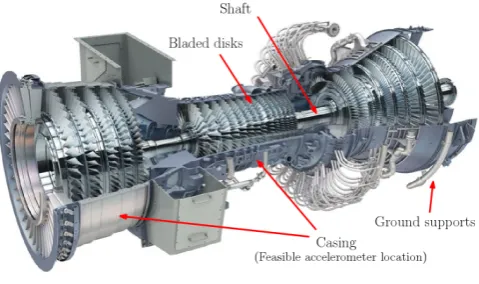
In a turbomachine arotortransmits the mechanical power to or from an external power source or sink. The rotor contains circumferential arrangements ofbladescalleddisksattached to a rotating shaft. Acasingbuilt around the rotor sustains it and channels the working fluid passing through the machine with the aid of disks ofvanes(Figure 1). Optimal thermodynamical efficiency requires, among many other factors, most of the working fluid flow passing through the rotor blades with no leaks. To achieve this the diametrical clearance between the rotor and thesealscontained by the casing must be minimized, but the price to pay is a higher probability of rotor–casing rub. This phenomenon causes, when unnoticed, wear and overheating and, if severe, may be highly destructive. Even if modern industrial equipment counts with machine protection relays that shut the machine down in case of faulty or abnormal duty, a better knowledge of the dynamics of faulty machines—in this case,
rotor–casing rub—and more effective monitoring and protection systems lead to earlier diagnosis, shorter downtimes and lower operation and maintenance costs.
Figure 1.Cutaway of an aeroderivative gas turbine and main parts -fromhttps://www.power-eng. com-.
Rub dynamics, monitorization, detection and diagnosis or rub and other malfunctions have been research topics in the Academia during the last decades and the Industry has large experience on the matter [1,2]. Rotor vibration is the most common indicator of rub available for monitorization. In most gas and steam turbines vibration is measured with proximity sensors mounted between the rotor and stator. In classes of turbomachinery such as in aeroderivative gas turbines—an elementary part of heat and power co-generation processes, combined-cycle power plants, oil and gas processing and marine propulsion—those sensors cannot be fitted for a number of design issues: the very low shaft–bearing relative deformations derived from the use of ball or rolling bearings instead of journal bearings, and the increased difficulty to fulfill the maintenance needs of these sensors. Leveraging on the high casing flexibility of aeroderivative turbines, its operation can instead be monitored by means of indirect vibration measurement techniques such as accelerometers mounted on the casing (Figure 2).
(a)
(b)
Figure 2. (a) GE’s Bently Nevada 330400 Sensor: accelerometer for casing acceleration measurement—from GE Measurement & Control: https://www.gemeasurement.com—. (b) Accelerometer output: acceleration as a function of time—fromhttp://www.realglitch.com/—.
show the results of a series of experimental tests on an experimental aero-engine with a bladed disk and a casing that encloses it. Blades and casing rub with each other when the latter is squeezed onto one of the rotating disk by turning one or several screws. This rub is continuous over some or all of the disc blades in one or several fixed points of the casing. Obviously, if all disk blades rub, the number of impacts per cycle of rotation in each rub point is equal to the number of blades. Casing acceleration is measured on a set of points with accelerometers and spectral analysis is conducted on the data. Raw data and its analysis show periodic rotor–casing impacts taking place with frequency equal to the product of the rotating speed with the number of blades. These impacts have an amplitude-modulated component with frequency equal to rotation speed. Chen [6] contrasts those experimental results with a simulation in a rotor model described in [7]: the shaft is discretized into beam elements, the disk blades are solid—undeformabl—straight beams and the casing is modeled as a two-dimensional curved non-rotating beam with two displacements on the radial plane per node. Wang [8] another experimental rig is used to reproduce the same type of rub than in the previous papers: rub is inflicted by means of a nylon block on the casing that impacts with a number of disc blades as the shaft rotates. The data spectra also highlight the impact-frequency peak and the impact modulation, as well as a rotation-frequency amplitude peak and its super-synchronous multiples, clearly seen in the low-frequency spectrum band.
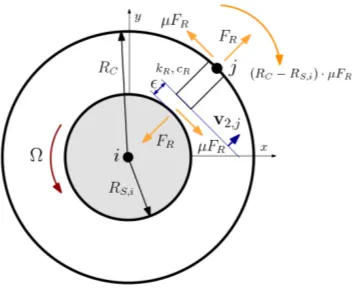
The publications cited in the previous paragraph are centered on the same type of rub: with the infliction of a massive relative rotor–casing mechanical deformation on one or several fixed points, or by fitting an obstacle between rotor and casing, the authors reproduce a rub that extends through all or almost all the circumferential rotor disk blades. There is an interest for the study of lighter and more frequent types of rub such as partial, single-point rub [23]: one rotor spot impacting a single point on the casing (Figure 3). At the same time, there is an opportunity to study the dynamics of longer, flexible casings in medium or heavy-duty turbomachinery and the influence of the axial positions of casing sensors and rub points on the collected signals. The latter could be attained with the construction of larger experimental rotor–casing rigs and their modelization as three-dimensional shells instead of using curved beams on the radial plane. Our research is centered on aeroderivative machines, whose rotating speeds during steady-state regime use to lie between the first and second rotor critical speeds, far lower than the regimes of most aero-engines. In most cases reported by the Industry rotor–casing rub leading to rotor shutdown took over in that regime. This research focuses on the identification of possible rub in the duty range of aeroderivative turbines. Any rub regime in a rotating machine is, in the onset, a light rub whose severity may increase in time if no measure is taken, therefore the best signal processing tools use in the task of diagnosing rub should be well suited to the lightest rub that can be measured and detected. Knowledge of the consequences of the lightest types of rotor–casing rub on machine dynamics and vibration is necessary to be able to detect it and take corrective action as soon as possible. With early diagnosis further damage can be prevented and maintenance programs and operation costs can be optimized.
the computational resources they consume, and by the time necessary to identify rub features on the signals since the onset of a rub condition in the machine. In the presence of rub the time-domain acceleration signals consist of trains of impulses followed by oscillating transients that contain damped rotor and casing vibration. All those features in both low and high-frequency bands may be visible to the Fourier spectra and the cepstra only if the sampling times are large enough, but the Continuous Wavelet Transform proves being able to highlight and localize these features in a short sampling vector containing just a few rotor–casing impacts, confirming the existence of a periodical impact on the casing. This work goes in the direction to find tools that allow for rub diagnosis while its severity it still very small in order to prevent machine damage or fault—early fault diagnosis—.
Figure 3. Single-point rotor–casing rub. One rotor spot impacts one point on the casing at a time. During the contact, normal and friction rub forces—light blue—change the rotor orbit direction—dark blue—and inflict vibration in the system.
2. Materials and Methods
The models, simulations and algorithms described here have been implemented in Matlab 2017a.
2.1. Rotor-casing model
The rotor-flexible casing model that has been developed (Figure 4) comprises a cylindrical shaft—S, blue color—with a number of cylindrical rigid solid disks—D1and D2, red color—attached to it. Together they form the machine rotor, which rotates at a constant speedΩ. The rotor is supported on bearings—B1andB2, violet—that are radially bound to the cylindrical shell that forms the machine casing—C, black—. The bearing-casing joints are modeled as very stiff bar trusses between each bearing and a number of homogeneously-distributed points in the casing—BC1, not represented for simplicity; andBC2, yellow—. All components are modeled under the hypotheses of linear elasticity —with the exception of the rigid solid disks—, homogeneity and small displacements and deformations.
Any of the two shaft extremes may incorporate a linear elastic coupling attached to the ground at the other side—coupl, dark blue—. The casing rests on the ground through linearly elastic supports attached to several points of the casing—CF4, not represented;CF1,CF2andCF3, black—. Thezaxis of the global cartesian reference system—black—follows the rotor axial direction and the axesxandyare contained on a rotor radial plane at one of the shaft extremes. A positive rotor rotation speed follows the shortest path fromxtoy.
Figure 4.The rotor-flexible casing model.
This model can be adapted to any material properties, dimensions and numbers of disks, bearings and supports, as long as the model hypotheses hold. As in Figure 4, our model has been set up with two disks, two rotor bearing supports on both casing sides, a coupling at one of the shaft extremes and four casing-ground supports attached to the casing ends on a plane that splits the casing in two identical halves. Shaft and disks are made of steel. The casing’s material is carbon fiber. Bearing-casing joints are modeled as very rigid elements so that most of the bearing-casing union elasticity rests on the bearings themselves. The most remarkable dimensions and mechanical properties of the model are shown in Table 1. These values of Table 1 are within the range of those appearing in some reduced scale experimental devices typically employed in the literature for model validation [6,12].
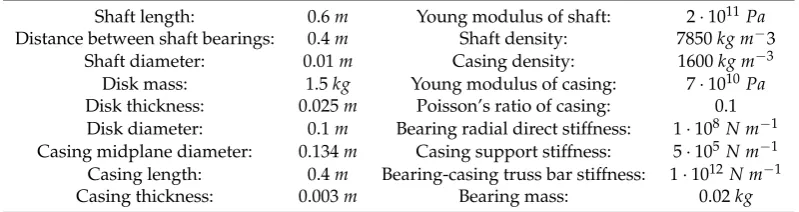
Table 1.Rotor-casing model dimensions and mechanical properties.
Shaft length: 0.6m Young modulus of shaft: 2·1011Pa
Distance between shaft bearings: 0.4m Shaft density: 7850kg m−3 Shaft diameter: 0.01m Casing density: 1600kg m−3
Disk mass: 1.5kg Young modulus of casing: 7·1010Pa
Disk thickness: 0.025m Poisson’s ratio of casing: 0.1 Disk diameter: 0.1m Bearing radial direct stiffness: 1·108N m−1
Casing midplane diameter: 0.134m Casing support stiffness: 5·105N m−1
Casing length: 0.4m Bearing-casing truss bar stiffness: 1·1012N m−1
Casing thickness: 0.003m Bearing mass: 0.02kg
Mu00+ (C+ΩG)u0+Ku=FU(t) +FR(u,u0) (1) M,C,GandKare the mass, viscous damping, gyroscopic and stiffness matrices respectively. These global matrices are assemblies of the local matrices of shaft and disk—S+D—, casing—C—and bearings—B—:
M=
MS+D MC
MB
G=
GS+D 0 0
C=
CS+D CC
CB
K=
KS+D KC
KB
.
u, u0 and u00 are the vector of node displacements and its time derivatives: velocity and acceleration. Analogously to the matrices, these vectors are assemblies of local vectors of shaft, casing and bearing displacements, each with its own degrees of freedom:
u= (uS+D|uC|uB)T= (u1u2...uN)T.
Simulations were carried out with a mesh of 19 shaft nodes—18 shaft beam elements—, two bearing nodes and 5490 casing nodes—2700 casing shell elements—. The first step was a modal analysis of the free undamped system withΩ=0. The first rotor and casing modes of vibration and their corresponding undamped natural frequencies are shown on Figure 5.
(a) (b)
(e) (f)
Figure 5.Lowest shaft and casing natural modes. (a) Rotor bending mode with one antinode. (b) Rotor bending mode with two antinodes (c) Casing rigid solid mode with shaft deflection. (d) Lowest casing longitudinal mode. (e) and (f) Lowest casing flexural modes.
Following [7], the system has been hypothesized to have a Rayleigh damping: the global viscous damping matrixCas a linear combination of the mass and stiffness matrix:
C=CMM+CKK.
The two constantsCMandCKare the result of solving a two-variable system of equations given
two system natural frequenciesωN,1andωN,2with known damping factorsξd,1andξd,2:
ξd,i= 1
2
CM ωN,i
+CKωN,i
, i=1, 2.
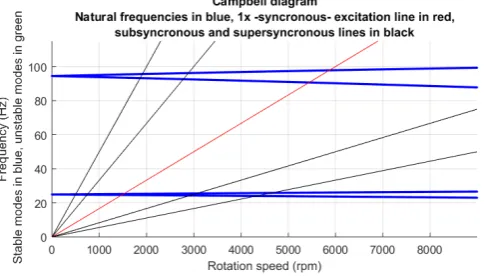
The variation of natural frequencies with rotation speed in the damped free rotor-flexible casing due to the speed-variable damping term of equation1is represented on theCampbell diagramshown in Figure 6.
2.1.1. Rotor unbalance
The most common source of excitation in a rotating machine is an unbalance force in the rotor [16]. The unbalance force vector in shaft nodeiis:
FU,i= MU,iΩ2rU,i(cos(Ωt−ψU,i) sin(Ωt−ψU,i)0 0 0)T,
whereMU,iis an unbalance mass,rU,iis the distance between the unbalance mass and the rotation
axis andψU,i is a phase angle that defines the angular position of the unbalance mass with respect
to a reference point on the rotor—in rotating machines this reference may be thekeyphasormark, see [17]—-.
2.1.2. Rub forces
A number of rotor–casing rubs can be defined, each between a casing node and a rotor node (Figure 7). An obstacle with stiffness and damping coefficientskRandcRis fitted on the casing nodej.
This obstacle may impact the rotor on nodei. When the system is at rest the clearance between rotor and obstacle ise. If the rotor–casing relative deformation becomes larger thanetwo forces appear in
the system: a normal, viscoelastic forceFRand a tangential friction force proportional to the normal rub
force by a friction coefficientµthat has been considered constant for any relative rub velocity between
rotor and obstacle. If the obstacle contact surface is flat and parallel to the casing at the attachment nodejits normal unitary vector equals the casing unitary normal vector atj,v2,j.
Figure 7.Rub model and forces on shaft and casing nodes.
The relative displacementdR between rotor and obstacle and the relative velocityd0R can be
expressed as:
dR=h(ux,j−ux,iuy,j−uy,i), v2,ji −e
d0R=h(u0x,j−u0x,iu0y,j−u0y,i), v2,ji,
beingux,j,uy,j,uy,iandux,ithe radial displacements of the casing and rotor nodes respectively.
u0x,j,u0x,i,uy0,jandu0y,iare node velocities. h., .iis the notation for the inner product of two vectors. The rub normal force results from the product of relative displacements and velocities with stiffness and damping contact coefficientskRandcRand a Heaviside function that equals one when
the relative deformation is larger than the clearancee, and zero otherwise:
The direction of the rub friction vector depends on the direction of relative displacement between the rotor and the rubbing obstacle. This is given by the sign of the relative rotor–casing rub velocity, defined as:
vRC=Rs,i·Ω+h(u0x,j−u0x,iu0y,j−u0y,i), (sinγ −cosγ)Ti+uΦ0 ξ,j·(Rc−Rs,i),
whereγis the angle ofv2,jwith respect tox, andu0θ
ξ,j is the casingz-axis bending velocity at node
j.
Since the rub spot stands at a distanceRc−Rs,iof the casing node, the friction force on the rub
spot inflicts, by balance of forces, a bending moment on the casing around thezaxis. Normal and friction rub forces on rotor and casing are projected on the global coordinate axes, resulting in the following local rub vectors of rotor—nodei—and casing—nodej—:
FR,i(u,u0) =FR
−cosγ
−sinγ
0 0 0
+µ·sign(vRC)·FR
sinγ
−cosγ
0 0 0
FR,j(u,u0) =FR
cosγ sinγ 0 0 0
+µ·sign(vRC)·FR
−sinγ
cosγ
0
−(Rc−Rs,i)
0 .
2.2. Model reduction and integration
2.2.1. The Craig-Bampton method
The model mesh counts with a total of 27551 degrees of freedom, making a numerical integration of model equation1too complicated for the limited speed and storage available and the large size of the integration output. Before its numerical integration the system should be reduced in size. This can be attained with the Craig-Bampton method [18]. Asboundarydegrees of freedom we choose those of the shaft, casing degrees of freedom affected by rub and degrees of freedom selected as data source for the measurement of casing acceleration. The remaining degrees of freedom, known asinteriordegrees of freedom, are projected on a subspace whose basis is formed by the first 200 normal modes of a system with constrained boundary degrees of freedom.
The resulting system, with reduced matrices and force vectorsMCB,CCB,GCB,KCB,FCB,U,FCB,R andFCB,M, has only 300 degrees of freedom, a size a modern desktop computer can cope with in terms of storage and speed.
2.2.2. The Newmark-βmethbd
For the numerical integration of the reduced system of equations we chose the implicit Newmark-β
method [19]. This method uses, in an iterative fashion, a implicit finite-difference expression to calculate the velocities and displacements of time stepi+1 from the displacements, velocities and accelerations of the former stepiand the accelerations of the current stepi+1. The Newmark-βmethod is for
the state vector(u,u0)of the rub force term for the displacements and velocities calculated in the previousith step:
FR,CB(ui+1,u0i+1)≈FR,CB(ui,u0i).
2.3. Signal extraction and processing
2.3.1. Fourier Analysis
A vectorxof periodical discrete signal samples with lengthNcan be decomposed into a Fourier sum series with sinusoidal terms calledharmonics. The Ncoefficients X(n)of the decomposition form the signalspectrumand are calculated with theDiscrete Fourier Transform—DFT, more in [20]—. The sampling vectorxcontains, in this work, the radial acceleration of a casing node measured with respect to time, beingTsits sampling period. Before the spectrum calculation the signal is periodizised
multiplying it element-wise with a Hamming window vector. IfNis a power of two theFast Fourier Algorithm—FFT, see [21]— is applicable, allowing for a much faster computation of the spectrum. 2.3.2. Real Cepstrum
Thecepstrum[9], also known as thespectrum of the spectrumis a popular diagnosis tool in machinery condition monitoring. Generally, it is the inverse Fourier transform of the logarithm of a spectrum. In the case of theReal Cepstrumits mathematical definition is:
c(t) =F−1(log|F(x(t))|).
First, the complex phase information of the signalx(t)is removed with the calculation of the module of its spectrum,|F(x(t))|. Then the logarithm evens out the amplitude of any sidebands or impulse trains contained in the spectrum with the amplitudes of the main spectral components. After the application of the inverse Fourier transform, impulse trains and amplitude or frequency-modulated components contained in the original signal are highlighted in the resulting cepstrum and shown as periodical pulses calledrahmonicswith a time-dimensional periodicity calledquefrency, measured in seconds.
2.3.3. Continuous Wavelet Transform
Analogously to the Continuous Fourier Transform—see [10]—the Continuous Wavelet Transform—CWT—is the inner product of a functionx(t)and a dilated and translated basis function
Ψ∗(t−b
a )calledmother wavelet:
W(a,b) =hx(t), Ψa,b(t)i= p1 |a|
Z
∞−∞x(t)·Ψ
∗
(t−b
a )dt,
3. Results
The simulated rotor–casing model comprises two disks symmetrically attached to the shaft. The second disk contains an unbalance massMUof 1.5·10−3kg at a distancerUof 3.75·10−2m from the
rotation axis with zero phase angleψU. The viscous damping matrix has been estimated considering
a damping factor of 0.04 and 0.06 at the critical speeds of 1500 and 5700 rpm respectively. A rub condition affects a shaft node close to one of the disks and one of the casing nodes in the same radial plane, withkR=7.4·106N m−1—two orders of magnitude larger than the shaft bending stiffness—,
cR=0—no impact damping—andµ=0.2—Steel-to-steel rub—. The equation1is integrated with
a time step of 2−17 s. Casing radial acceleration of a casing node close to one of the casing ends is extracted into a vector of 218samples at a rate of one sample per integration step, the sampling time of the collected acceleration data ortime recordbeing 2 s. The radial acceleration of casing nodej,u00j, as a casing accelerometer measures it is defined by its acceleration in thexandydegrees of freedom as
q
u00x,j+u00y,j.
It is common practice to integrate the accelerometer signals, monitoring velocity instead of acceleration with respect to time. The purpose is to attenuate the high-frequency noise contained in the accelerometer signal and to highlight the low-frequency band of the spectrum, which is the source of information that is most commonly used for protection purposes in rotating machinery [22]. Therefore a second sampling vector containing radial casing velocity,u0j, is constructed from the simulation data. Rotor displacement orbits in the radial plane where is rubs the casing are also of interest because in conventional turbomachines rotor orbits are the preferred monitorization tool. Rotor orbits bring us confirmation of the existence of a rub in the simulated rotor-flexible casing model.
From the Campbell diagram (Figure 6) the first three rotor critical speeds are approximately 1500 rpm—corresponding to the rotor bending mode with one antinode—, 5400 and 5900 rpm—the bending mode with two antinodes—. The model has been simulated at a speedΩof 3600 rpm—60 Hz—, between the first and the second critical speeds: the working range of a real aeroderivative machine. The purpose of selecting this rotation speed is to reproduce a rub condition that is observed very often in conventional turbomachines working at speeds above twice the first rotor critical speed: a single-point rub with one impact every two rotation cycles -see [23]-.
In Figures 8 and 9 we represent the rotor orbits, the full spectra of the rotor orbits [31] and casing acceleration and velocity plots of a rotor–casing model in steady-state regime under two conditions: no rub and light single-point rub. If there is no rub (Figure 8) the acceleration and velocity signals are dominated by a synchronous sinusoid resulting from the unbalance force excitation. If the clearancee
is small enough a stable single-point rotor–casing sets off, its intensity being of such magnitude so that the unbalance-related sinusoidal vibration is masked by new signal features resulting from the rub condition.
(a)
(b)
(c) (d)
Figure 8. (a) Rotor orbit—shaft displacement on the radial plane—. (b) Full spectrum of the rotor orbit. (c) and (d) Acceleration versus rotor cycle—i.e. versus time—and velocity versus rotor cycle—’acceleration time plot’ and ’velocity time plot’ hereafter—measured on selected casing node at 3600 rpm. No rub. The shaft rotates in the anticlockwise direction.
(a)
(c) (d)
Figure 9.(a) Rotor orbit, with the orbit segment where the rotor rubs the casing marked in red. (b) Full spectrum of the rotor orbit. (c) Acceleration time plot. (d) Velocity time plot. 3600 rpm. Light single-point rub (e=2.5·10−4m). The shaft rotates in the anticlockwise direction.
A single-point rub regime is easy to identify on the Full Spectrum plots 9(b): it manifests itself as a pair of harmonics—forward and backward—with frequency half the rotation speed and equal or almost equal amplitude. This harmonic with half the rotation speed is a staple in the spectra of rubbing rotating machinery operating at speeds slightly above twice the first critical speed [23]. The construction of full spectra of rotor orbits requires the relative displacements between rotor and stator on at least one rotor radial plane. Unfortunately, that information cannot be collected in an aeroderivative turbine because of the technical challenge that means to fit proximity sensors in aeroderivative gas turbines.
In the following sections, the signal processing methods described above will be applied to the casing signals from the rotor with light rub (Figure 9) in order to isolate the signal features that allow for rub diagnosis.
3.0.1. Fourier Analysis
(a)
(b)
Figure 10.Periodograms of the steady-state casing signals. Light single-point rub. Low-band details. (a) Casing acceleration. (b) Casing velocity. For simplicity only the low-band side of the spectra—between zero and 600 Hz—is shown.
3.0.2. Real Cepstrum
(a)
(b)
Figure 11.Real cepstra of the accelerometer signals. Light single-point rub. (a) Acceleration signal. (b) Velocity signal.
3.0.3. Continuous Wavelet Transform
(a)
(b)
Figure 12.Details of the CWT scalograms of the steady-state casing signals with the Morlet wavelet. Light single-point rub. (a) Casing acceleration. (b) Casing velocity.
The scalograms of the acceleration and velocity records clearly highlight the excitation of the 200 Hz free vibration mode after the rub event; but most importantly, they disclose the short-lived free vibration transients of the high-frequency rotor and casing vibration, in the 0.3–4 kHz band, excited at the beginning and end of each rotor–casing contact, features that the Fourier-based methods failed to target. The velocity sampling vector contains more information of the low-frequency band of the spectrum, including the 30 Hz rotor–casing impact fundamental frequency and some of its harmonics, with the exception of the syncronous—60 Hz—unbalance-related harmonic, which lies buried under the rub features. Most of the high-frequency information in the acceleration data vanishes when this is time-integrated and downsampled but some of is still distinguishable.
4. Discussion
In this work we have presented a model of an aeroderivative gas turbine for the simulation of abnormal duty. In particular, it succeeds in reproducing a common type of rub encountered in conventional turbomachinery, the partial single-point rub [23].
of rotor and casing vibration modes, the most notorous of them being the rigid solid casing mode: the lowest of all the casing natural modes (Figure 5c). Those oscillations would fade in the course of time as a result of damping.
The Fourier spectra of the signals are mainly comprised of impulse trains with fundamental frequency equal to the impact frequency: half the rotor rotation speed (Figure 10). The highest impulse harmonics in the spectra are the 30 Hz harmonic—in the velocity spectrum—and the harmonics closest to the 200 Hz casing mode. The periodicity of the rub-related impulse train is evidenced by the cepstra as another train of impulses (Figure 11).
The Fourier spectra and the cepstra in Figures 10 and 11, due to the small frequency resolution—0.5 Hz—, fail to make visible the high-band rotor and casing transient modes excited by the rub perturbation. This elements can instead be identified and precisely localized in time with the application of the Continuous Wavelet Transform on the signals (Figure 12). Because of the very large time resolution of the CWT at high frequencies, the analysis of a short vector of acceleration samples containing just one of the rotor–casing impacts suffices to confirm the presence of those high-frequency and brief vibration transients and to localize them at the two ends of each rotor–casing contact, confirming the existence of rotor–casing rub. The CWT scalograms of the velocity data are better suited to visualize the low-frequency features of the rotor–casing rub, including the fundamental rub frequency band some of its low-band multiples.
The visualization of the evidences of rotor–casing rub on a Fourier spectrum would require to collect very large sampling vectors with large time intervals between the first and the last sample—to improve frequency resolution as much as needed without worsening the spectrum frequency range—. Such data recollection consumes great computational resources and necessitates a time span in which many impacts between rotor and stator may take place before its final detection. On the other hand, the Continuous Wavelet Transform has the potential to identify rotor–casing rub with the analysis of only one impact in a very short time span, thus enabling the early detection of this malfunction.
Conflicts of Interest:The authors declare no conflict of interest. Despite the technical support brought by GE this research received no sponsoring.
References
1. Muszynska, A.Rotordynamics; CRC Press: Boca Ratón, Florida, USA, 2003; ISBN 9780824723996.
2. Bently, D. E.; Hatch, C. T.Fundamentals of Rotating Machinery Diagnostics; Bently Pressurized Bearing Press: Minden, Nevada, USA, 2002; ISBN 978-0971408104.
3. Chen, G. Characteristics analysis of blade-casing rubbing based on casing vibration acceleration.Journal of Mechanical Science and Technology2015,29(4), 1513-1526.
4. Chen, G. Study on the recognition of aero-engine blade-casing rubbing fault based on the casing vibration acceleration.Measurement2015,65, 71-80.
5. Yu, M.; Jiang, G.; & Wang, W. Aero-engine rotor-static rubbing characteristic analysis based on casing acceleration signal.Journal of Vibroengineering2015,17(8), 4180-4192.
6. Chen, G. Simulation of casing vibration resulting from blade-casing rubbing and its verifications.
Measurement2016,361, 190-209.
7. Chen, G. Vibration modelling and verifications for whole aero-engine.Journal of Sound and Vibration2015,
349, 163-176.
8. Wang, N. F.; Jiang, D. X.; & Han, T. Dynamic characteristics of rotor system and rub-impact fault feature research based on casing acceleration.Journal of Vibroengineering2016,18(3), 1525-1539.
9. Randall, R. B. A history of cepstrum analysis and its application to mechanical problems.Mechanical Systems and Signal Processing2017,97, 3-19.
10. Kovacevic, J.; Goyal, V. K.; & Vetterli, M. (2013) Fourier and Wavelet Signal Processing. Chapter 6, section 5. Available online:http://www.fourierandwavelets.org/(accessed on 28 December 2017).
11. Yan, R; Gao, R. X.; & Chen, X. Wavelets for fault diagnosis of rotary machines: A review with applications.
12. Yang, Y.; Cao, D.; Yu, T.; Wang, D.; & Li, C. Prediction of dynamic characteristics of a dual-rotor system with fixed point rubbing—theoretical analysis and experimental study.International Journal of Mechanical Sciences 2016,115, 253-261.
13. Jones, S. Finite elements for the analysis of rotor-dynamic systems that include gyroscopic systems.Doctoral dissertation, Brunel University2005.
14. Muszynska, A.Rotordynamics; CRC Press: Boca Ratón, Florida, USA, 2003; Chapter 3, section 6.1, ISBN 9780824723996.
15. Ahmad, S.; Irons, B. M.; & Zienkiewicz, O. C. Analysis of thick and thin shell structures by curved finite elements.International Journal for Numerical Methods in Engineering1970,2(3), 419-451.
16. Bently, D. E.; Hatch, C. T.Fundamentals of Rotating Machinery Diagnostics; Bently Pressurized Bearing Press: Minden, Nevada, USA, 2002; Chapter 18, ISBN 978-0971408104.
17. Bently, D. E.; Hatch, C. T.Fundamentals of Rotating Machinery Diagnostics; Bently Pressurized Bearing Press: Minden, Nevada, USA, 2002; Chapter 2, ISBN 978-0971408104.
18. Craig, R.; & Bampton, M. Coupling of substructures for dynamic analyses.AIAA journal1968,6(7), 1313-1319. 19. Newmark, N. M. A method of computation for structural mechanics. Journal of the engineering mechanics
division1959,85(3), 67-94.
20. Vetterli, M.; Kovaˇcevi´c, J.; & Goyal, V. K.Foundations of Signal Processing; Cambridge University Press: Cambridge, UK, 2014; Chapter 3, section 4, ISBN 978-1107038608.
21. Cooley, J. W.; & Tukey, J. W. An algorithm for the machine calculation of complex Fourier series.Mathematics of Computation1965,19(3), 297-301.
22. Littrell, N. Selecting the right sensors for your machineOrbit Magazine2013,33(1), 46-53.
23. Bently, D. E.; Hatch, C. T.Fundamentals of Rotating Machinery Diagnostics; Bently Pressurized Bearing Press: Minden, Nevada, USA, 2002; Chapter 2, ISBN 978-0971408104.
24. Lin, J.; & Qu, L. Feature extraction based on Morlet wavelet and its application for mechanical fault diagnosis.
Journal of sound and vibration2000,234(1), 135-148.
25. Zheng, H.; Li, Z.; & Chen, X. Gear fault diagnosis based on continuous wavelet transform.Mechanical systems and signal processing2002,16(2-3), 447-457.
26. Wu, J. D.; & Chen, J. C. Continuous wavelet transform technique for fault signal diagnosis of internal combustion engines.NDT & E International2006,39(4), 304-311.
27. Rafiee, J.; Rafiee, M. A.; & Tse, P. W. Application of mother wavelet functions for automatic gear and bearing fault diagnosis.Expert Systems with Applications2010,37(6), 4568-4579.
28. Su, W.; Wang, F.; Zhu, H.; Zhang, Z.; & Guo, Z. Rolling element bearing faults diagnosis based on optimal Morlet wavelet filter and autocorrelation enhancement.Mechanical systems and signal processing2010,25(5), 1458-1472.
29. Tang, B.; Liu, W.; & Song, T. Wind turbine fault diagnosis based on Morlet wavelet transformation and Wigner-Ville distribution.Renewable Energy2010,35(12), 2862-2866.
30. Kankar, P. K.; Sharma, S. C.; & Harsha, S. P. Fault diagnosis of ball bearings using continuous wavelet transform.Applied Soft Computing2011,11(2), 2300-2312.
31. Bently, D. E.; Hatch, C. T.Fundamentals of Rotating Machinery Diagnostics; Bently Pressurized Bearing Press: Minden, Nevada, USA, 2002; Chapter 8, ISBN 978-0971408104.