Exploiting the Capture Effect to Enhance RACH
Performance in Cellular-Based M2M
Communications
Jonghun Kim1, and Jaiyong Lee1,*
1 Ubiquitous Network Laboratory, School of Electrical and Electronic Engineering, Yonsei university, 50
Yonsei-ro, Seodaemun-Gu, Seoul, Republic of Korea; [email protected] (J. Kim); [email protected] (J, Lee)
* Correspondence: [email protected]; Tel.: +82-2-2123-7715
Abstract: Cellular-based machine-to-machine (M2M) communication is expected to facilitate services for the Internet of Things (IoT). However, because cellular networks are designed for human users, they have some limitations. Random access channel (RACH) congestion caused by massive access from M2M devices is one of the biggest factors hindering cellular-based M2M services because the RACH congestion causes random access (RA) throughput degradation and connection failures to the devices. In this paper, we show the possibility exploiting the capture effects, which have been known to have a positive impact on the wireless network system, on RA procedure for improving the RA performance of M2M devices. For this purpose, we analyze an RA procedure using a capture model. Through this analysis, we examine the effects of capture on RA performance and propose a Msg3 power-ramping (Msg3 PR) scheme to increase the capture probability (thereby increasing the RA success probability) even when severe RACH congestion problem occurs. The proposed analysis models are validated using simulations. The results show that the proposed scheme, with proper parameters, further improves the RA throughput and reduces the connection failure probability, by slightly increasing the energy consumption. Finally, we demonstrate the effects of coexistence with other RA-related scheme through simulation result.
Keywords: M2M communications; Machine-type communications (MTC); Internt of things (IoT); Cellular network; Random access channel (RACH); congestion
1. Introduction
Supporting Internet of Things (IoT) services is emerging as one of the most important problem problems facing communication systems [1,2]. There are many applications, such as public safety, e-health, fleet management, and smart metering [1] that will use machine-to-machine (M2M) communication technology, which ensures connectivity to the devices without human interaction
Cellular networks are expected to play a major role in enabling M2M communications because they can provide seamless coverage over a large area, support mobility, and offer security. However, there are several problems with enabling M2M communications over cellular networks because these networks are optimized for human-to-human (H2H) communications and the characteristics of M2M communications are different from those of conventional H2H communications. For example, M2M communications are triggered by events, time-controlled, involve the transmission of small amounts of data, and are energy-limited [3]. The 3rd Generation Partnership Project (3GPP) has studied the issues facing M2M services in cellular networks. In [1], the 3GPP studied potential system improvements for M2M communications; the authors organized the architectural considerations and defined the expected problems for M2M communications. One of the most critical problems is congestion due to the massive access by M2M devices. The control plane at the radio-access-network (RAN) level suffers during massive access by M2M devices due to their characteristics. M2M devices try to establish a connection with an evolved node B (eNB) when they have data to transmit, causing a severe random access channel (RACH) congestion problem. The 3GPP suggested some solutions
[1], including an access class barring (ACB) scheme, a separate RACH resource-allocation scheme, a dynamic RACH resource-allocation scheme, and an M2M-specific back-off scheme.
Because RACH congestion due to massive access causes the degradation of RA throughput, increasing the RA throughput has become a major research target. The ACB method efficiently solves the RA throughput problem by controlling the access probabilities of separate access classes. In [4], the authors suggested dynamic-ACB (D-ACB) to not only overcome the RACH congestion problem due to bursts of M2M traffic but also to reduce the total service time. The D-ACB determines the accurate ACB factor without backlog information. In [5], a cooperative ACB (C-ACB) scheme was proposed to reduce the congestion in multi-cell cases. In this study, the ACB factors of each eNB were used for the eNB selection by M2M devices. Furthermore, the ACB factors were jointly determined among the neighboring eNBs. The access load could be distributed using the cooperative method. In [6], timing-advance (TA) information was used to reduce the RA collision probability, because the propagation delay between a stationary M2M device and the eNB is a constant. Hence, the authors assumed that the TA values in a random access response (Msg2) could be used as an identifier; therefore, some preamble collisions could be solved. Based on this, they proposed a TA-based ACB scheme for increasing RA throughput. In [7], ACB scheme for delay-sensitive devices is proposed. the authors consider the scenario where delay-sensitive and delay-tolerant services coexist. And, priority-based ACB scheme adjusts dynamically the access probability and the number of preambles to satisfy requirement of delay-sensitive services. Also, delay-tolerant services also be highly utilized based-on preamble allocation.
A preamble-separation method has also been proposed to increase the RA throughput. In [8], two preamble-allocation methods for M2M/H2H services were studied. One method split the preambles into disjointed sets for M2M and H2H separately, while the other split them into an H2H-only set and an H2H/M2M-hybrid set. The authors modeled these methods and analyzed them in terms of throughput. In [9], the authors analyzed the non-overlapping preamble separation, proposing the use of a load-adaptive throughput-maximizing preamble-allocation procedure, which automatically adjusted the preamble allocation to the priority classes, based on the access load. Both studies showed that the preamble-separation scheme increased the RA throughput, especially when the access load was heavy.
The energy consumption of M2M devices is also a very important issue because most M2M devices are vulnerable to energy consumption. Therefore, many studies have been conducted on the energy consumption of the RA process. In [10], further improvement of traffic scattering for the group paging (FI-TSFGP) scheme was proposed to achieve high channel-access probability for M2M services. They also provided analysis of the scheme in terms of access latency and power consumption. Consequently, they argued that the FI-TSFGP scheme led to the reduction of both the channel access latency and the power consumption. In [11], group-based access control was studied in terms of the energy consumption of M2M devices. The authors introduced a coordinator to reduce massive access. Also, they proposed a joint massive access control and resource allocation scheme that minimized total energy consumption.
In this paper, we provide novel solution to reslove RACH congestion probelm due to massive access of M2M devics by exploiting the capture effect: Msg3 PR scheme. The main contributions of this paper are summarized as follows:
1. We formulated analysis models of the RA procedure considering the capture effect. Previous studies [4–6,12–14] adopted the collision model to analyze the RA procedure and assumed that the RA performance degradation due to the collisions of the preambles (Msg 1) could not be prevented. However, we provide an RA analysis model that considers the capture effect. Therefore, we consider RA performance improvements due to the capture effect of the physical layer, even if the collision occurs. We provide an RA performance analysis model, in terms of the RA throughput, the connection failure probability, and the average energy consumption of the devices.
2. Exploiting the capture effect to improve the RA performances, we propose the Msg3 PR scheme. This scheme causes a difference in the received power of messages at the eNB, so that the capture effect occurs frequently. Also, it is easy to apply, because the proposed scheme adopts the power ramping scheme that has already been used in the cellular system. Moreover, by applying this new technique, a device that has performed many retransmissions would have a higher RA success probability; thus, the connection failure probability could be reduced.
3. In the simulation, we demonstrate the accuracy of proposed analysis and the advantages of the Msg3 PR scheme. Also, the effects of various network parameters on the performance of the technology are demonstrated. Moreover, we discuss the beneficial points of the proposed scheme when used with other RA-related schemes.
The rest of the paper is organized as follows. In Section2, we introduce our system model. The motivation of this study and an introduction to the Msg3 PR scheme are presented in Section3. In Section4, we derive the analysis models for the RA procedure, considering the capture effect, and provide the performance of the proposed scheme, in terms of several performance metrics. In Section
5, the simulation results demonstrate the performance of the Msg3 PR scheme and the accuracy of the proposed analysis. Finally, Section6presents the conclusions.
2. System Model
2.1. Random access procedure
An M2M device in the radio-resource-control (RRC) idle mode performs an RA procedure to set up a connection with an eNB before data transmission. There are two types of RA procedures: contention-free and contention-based. In this study, we focus on the contention-based RA procedure. Before beginning the RA, the device listens to the system information block (SIB) messages broadcasted periodically by the eNB. The SIB messages contain information about the RA, such as the physical random access channel (PRACH) configuration index and the frequency offset, which inform what resource blocks are reserved for the subsequent RA. Furthermore, information about which preambles are reserved for groups and about power control is included in the SIB messages. The contention-based RA procedure includes four steps messages exchanging [17]; the RA procedure modeled in this study is as follows:
1. Msg1. Preamble transmission
2. Msg2. RAR
When the eNB detects a preamble transmission, it sends a Msg2 for the corresponding preambles through the physical-downlink control channel (PDCCH). This Msg2 contains the radio-network temporary identifier (RA-RNTI), the timing-advance (TA) information, and the uplink grant. The RA-RNTI identifies the corresponding preamble, the TA information is used to adjust the synchronization of the corresponding device, and the uplink grant is used to schedule the transmission of Msg3. Because the eNB cannot distinguish betweensingletonand collided preambles, it sends Msg2 for either preamble. Therefore, multiple devices that select the same preamble during Msg1 transmission receive the same Msg2, which only indicates the corresponding preamble. If a device does not receive a Msg2 within the RAR window, it realizes that the current RA has failed.
3. Msg3. RRC-connection request
After sending Msg1, the device observes the PDCCH for the RAR window. If it finds the corresponding Msg2, it sends the Msg3, containing its identifier, by using a physical-uplink shared channel (PUSCH) informed by the uplink grant in the Msg2. Devices that send Msg3 set the contention-resolution time. Devices that choose the same preamble (i.e.,collided preamble) also send a Msg3 containing their own identifier by using the same uplink grant, and therefore, a Msg3 collision can occur.
4. Msg4. RRC-connection setup
the eNB transmits the Msg4 using the PDCCH to inform the device that an RRC connection has been set up. Because the Msg4 contains the device identifier received from successfully received Msg3, an RA collision can be resolved if a specific Msg3 is decoded by capture effect.
If any of the four steps fails, an RA failure occurs. In this study, we assume that RA failure only occurs when the devices fail to receive a Msg 4. If a device does not receive a Msg 4 within the contention-resolution time, it performs a random back-off and re-attempts the RA, if the trial number does not exceed the maximum trial number, Nmax. If the trial number exceeds Nmax, a connection failureoccurs. Note that the trial number can be from 1 to Nmax. If the RA procedure is successful within Nmax RA trials, the device successfully connects to the eNB. We do not consider the hybrid automatic repeat request (HARQ) procedure for Msg3 or Msg4, nor do we consider the PDCCH resource constraint.
2.2. Power capture effect
Due to the characteristics of wireless communications, a specific signal can be decoded when multiple signals are received at different powers, causing the capture effect. This phenomenon occurs when the strongest signal power received from a specific device is sufficiently large. In other words, the capture effect occurs when the signal-to-interference ratio (SIR1) of the strongest signal is larger
than a specific threshold [15,16]. IfPidenotes the signal power received from deviceiat the eNB, the probability that the signal from deviceiis captured, i.e.,Ppc,i, is defined as follows:
Ppc,i =P Pi>β
∑
j6=i Pj
!
(1)
whereβisthe capture-threshold.
1 In [16], the signal-to-interference-plus-noise-ratio (SINR) is used. However, we use SIR to model the capture effect as [15]
2.3. Uplink power control
In [19], the Msg1 transmission adopted a power-ramping scheme to increase the probability of preamble detection, which was not considered in this study. When a device re-attempts the RA procedure after back-off, it increases its Msg1 transmission power through a power-ramping. Let Pmsg1denote the Msg1 transmission power,Pmsg1can be defined as follows [10,17]:
Pmsg1=min(PCmax,PRTP+PL) (2)
wherePCmax[dBm] is the maximum transmission power,PL[dB] is the path loss; andPRTP[dBm] isthe preamble received target power, which is defined as follows:
PRTP=PIRT+delta+ (r−1)PRS (3)
Here,PIRTisthe power initial received target,deltaisthe offset valuedepending upon the preamble format, andr isthe ramping number that is associated with the trial number of the device. Using open- and closed-loop power control [19], a device can estimate thePLand therefore, can adjust its transmission power to meet the target received power at the eNB. In this study, we assume that the power control is performed perfectly, such that the received signal power depends only upon the ramping number.
The Msg3 transmission power follows the PUSCH power control policy [18]. The Msg3 transmission power is affected by the modulation and coding scheme (MCS), resource blocks, and other factors. For the case of M2M communications, the data required is quite small, and the MCS is also low due to the low complexity. Hence, it is reasonable that the transmission power of Msg3 is identical for M2M devices. Consequently, we assume, for simplicity, that
Pmsg3=min(PCmax,Ptarget+PL) (4) wherePtarget = 10 logM+P0+deltaMCS+f(i)is assumed to be a constant value. Here,Mis
the number of assigned resource blocks,deltaMCSis the change in value related to MCS, and the other values are defined by the high-layer.
3. Motivation and proposed scheme
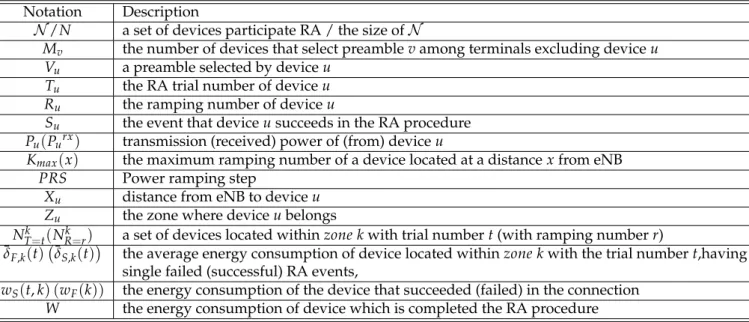
Table 1.NOTATION SUMMARY
Notation Description
N/N a set of devices participate RA / the size ofN
Mv the number of devices that select preamblevamong terminals excluding deviceu Vu a preamble selected by deviceu
Tu the RA trial number of deviceu Ru the ramping number of deviceu
Su the event that deviceusucceeds in the RA procedure Pu(Purx) transmission (received) power of (from) deviceu
Kmax(x) the maximum ramping number of a device located at a distancexfrom eNB PRS Power ramping step
Xu distance from eNB to deviceu Zu the zone where deviceubelongs
NTk=t(NRk=r) a set of devices located withinzone kwith trial numbert(with ramping numberr) ¯
δF,k(t) δ¯S,k(t) the average energy consumption of device located withinzone kwith the trial numbert,having single failed (successful) RA events,
wS(t,k) (wF(k)) the energy consumption of the device that succeeded (failed) in the connection W the energy consumption of device which is completed the RA procedure
failure. Because the proposed scheme uses a power-ramping scheme, the Msg3 transmission power can be reformulated as follows:
Pmsg3=min(PCmax,Ptarget+PL+ (r−1)PRS) (5) As a result, the received power can be differentiated based on the ramping number (r) of the device.
4. Analysis Model
Intuitively, the Msg3 PR will have a positive effect on the probability of RA success because it helps the eNB capture the Msg3, even in a collision situation. However, it is necessary to analyze how the proposed scheme is affected by the network parameters and to analyze negative aspects of the scheme, such as the increased energy consumption of the devices. In this section, we propose an RA procedure analysis model that considers the capture effect in the Msg3 reception. For mathematical tractability, we assume that network is in a steady-state2. We provide an analytic model for three performance metrics: RA throughput, connection failure probability, and average energy consumption. The RA throughput and connection failure probability demonstrate the positive effect of the proposed Msg3 PR scheme, while the average energy consumption is a potential negative effect of the proposed scheme. Table1summarizes the notations used in this analysis.
4.1. System Model
We consider a single cell with radiusXcell. LetN andNdenote the set of devices sending Msg1 to participate in RA at the same RA slot, and the size ofN, respectively. Devices inN are uniformly distributed in a cell, hence,Xu = xwhich denotes the distance between the eNB andu, follows a uniform distribution. A deviceu ∈ N, which failed the RA procedure(t−1)times and participate in thetthRA at this RA slot has a trial numberTu=t. Similarly,Ru =rdenotes the ramping number
2 In [4,10,14], a heavily congested network reaches a steady-state. In other words, the number of arrivals of retransmitted
1
𝒛(𝑵𝒎𝒂𝒙) 𝒛(𝑵𝒎𝒂𝒙− 𝟏)
𝒛(𝟏)
0 𝒃𝑵𝒎𝒂𝒙 𝒃𝑵𝒎𝒂𝒙−𝟏 … 𝒃𝟐 𝒃𝟏
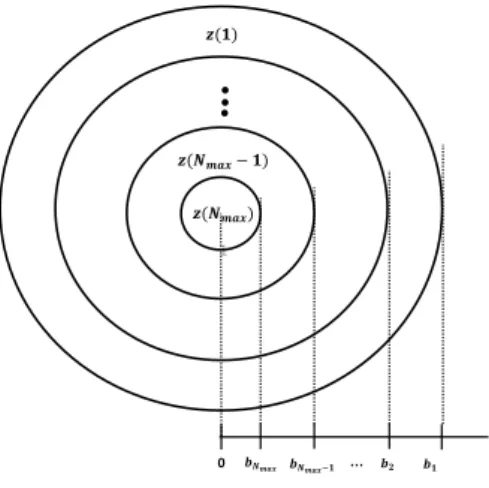
Figure 1.Definition of ’zone’.
of a device defined by Equation (5) at current RA slot. As seen in Equation (5), the Msg3 transmission power ofuis upper-bounded byPCmax asPtarget+ (r−1)PRS+PL≤ PCmax. Note thatPLis related to x. For simplicity, PL can be defined using the log-distance path loss model without fading as PL(x) = PL0+10αlog(xx
0)wherePL0andx0are the reference-path loss and distance, respectively.
From the upper-bound condition and the path-loss model, the upper-bound of the ramping number of the device located at a distancexfrom the eNB is as follows:
r≤max
1,
PCmax−PL(x)−Ptarget
PRS +1
=Kmax(x) (6)
Definition 1. Kmax(x) is the maximum allowable ramping number of a device located at a distancexfrom the eNB. Then, the ramping number ofu,Ru, can be defined as follows
Ru=min(Kmax(xu),Tu) (7)
However, Equation (7) is hard to deal with. Hence, we introduce the concept of zones for tractability as shown in Figure1.
Definition 2. Zone kis the area in which devices withKmax =kare located. AndZuis thezonein which deviceubelongs. Thus,Zu =kmeans that a deviceuis inzone k(also,ucan only increase its ramping number up tok). Therefore,zone Nmaxis the closet to the eNB, whereaszone1 is the farthest from the eNB.
If the distribution ofXu is known (i.e., the distribution of devices in a cell), the probability that deviceubelongs tozone k,P(Zu =k), is (See Figure1)
P(Zu =k) =
Z bk
bk+1
P(Xu =x)dx ,k∈[1,Nmax] (8)
Note thatKmax(x)is a decreasing function for x. Therefore, there exists a boundary distance bk=Kmax−1 (k), k=1, ..,NmaxwherebNmax+1=0.
Definition 3. E[NTk=t]is the expected number of devices having a trial numbertthat are located inzone kfort∈[1,Nmax]andk∈[1,Nmax]. Then,∑k∑tE[NTk=t] =Nholds.
IfE[Nk
T=t]for∀t,kare given, we can define the distribution of the ramping number.
Definition 4. P(Ru = r,Zu = k | N)is the probability that a device has a ramping numberr
E[NRk=r]can be derived fromE[NTk=t]. Because the devices belonging tozone kcan only increase their ramping numbers tok, NRk=r = 0 forr > k. Hence,E[NRk=r] can be defined usingE[NTk=t]as follows:
E[NRk=r] =
E[NTk=r] 1≤r<k ∑Nmax
t=k E[NTk=t] r=k ,r∈[1,Nmax]
0 k<r≤Nmax
(9)
Finally, the following two equations are derived.
P(Ru,Zu =k|N) = E
[Nk R=r] N
P(Ru|N) =
Nmax
∑
k=1
P(Ru,Zu =k|N) (10)
= E[nR=r]
N ,r∈[1,Nmax]
whereP(Ru|N)is the distribution of the ramping number when the number of accesses isN.
4.2. RA Throughput
In this sub-section, we provide an analysis model for the RA throughput. First, we provide a one-shot model when Nand E[NTk=t] for∀t,kare given. Then, we demonstrate a steady-state RA throughput using the one-shot model, becauseE[Nk
T=t]is affected by the RA success probability, as determined by the RA throughput.
4.2.1. One-shot RA throughput analysis
Devices inN send a Msg1 that is randomly selected fromVpreambles. Focusing on a certain device,u∈ N withTu =tandZu=k, and therefore,Ru =r=min(t,k). LetVudenote the preamble selected by deviceu, andMvdenote the number of devices that select preamblevamongN excluding deviceu. Then, the probability that deviceu andmdevices in setN \{u}select preamble vcan be expressed as follows:
P(Mv=m,Vu=v|N) = 1
V
N−1 m
1 V
m
1− 1
V
N−m−1
,m∈[0,N−1],v∈[1,V] (11)
Next, we derive the probability that device u succeeds in a RA (i.e., the Msg3 from u is successfully decoded by the eNB), which we denote as the eventSu. Let the random variable Pirx denote the received signal power from devicei at the eNB. Then, the event(Su)occurs, even if u collides withmdevices, whenPurxmeets the capture condition defined in Equation (1). Hence, the conditional probability of (Su) is
P(Su |N,Mv=m,Vu=v,Purx= p) =P β
∑
i∈Mv
Pirx≤p
N,m,v,Purx= p !
(12)
(PDF) ofPirxfollows the distribution of the ramping number(Ri)of the RA-participating devices as Equation (10). In other words, the PDF ofPirxis
P(Pirx=Prx(r)|N) =P(Ri =r|N) (13)
Hence, the conditional probability in Equation (12) is redefined asRu.
P(Su|N,Mv=m,Vu =v,Purx=Prx(r)) =P(Su|N,Mv=m,Vu=v,Ru =r)
=P β
∑
i∈Mv
Pirx≤Prx(r)
N,m,Ru =r !
(14)
=CPN,m,r
whereCPN,m,ris the Msg3 capture probability, which means the probability that deviceuwhose ramping number isris captured by the eNB whenmdevices amongNdevices collide withu. Note thatCPN,0,ris the capture probability whenuselectsthe singleton preamble, and therefore,CPN,0,r =1 for anyNandr. Because the PDF of Pirxis defined, and is independent and identically distributed, i.i.d., Equation (14) can be solved usingthe m-fold convolutionof the PDF ofPirx for given values of N,m, andr[16].
Then, the following conditional probability can be obtained from Equation (14), (10), (8) andthe chain rule.
P(Su,Ru=r,Zu=k|N,Mv=m,Vu=v)
=P(Su|N,Mv=m,Vu=v,Ru =r,Zu =k)P(Ru =r|N,Mv=m,Vu=v,Zu=k)
P(Zu=k|N,Mv=m,Vu=v) (15)
=CPN,m,rP(Ru=r|N,Zu =k)P(Zu =k) ,r∈[1,Nmax],k∈[1,Nmax]
Note that (a) Su is dependent of Ru, not Zu, (b) Ru is independent of Vu and Mv, and (c)Zu is independent ofN,Mv, andVu, so Equation (15) holds.
From Equation (11) and (15), we have
P(Su,Mv=m,Vu =v,Ru =r,Zu=k|N) (16)
=P(Mv=m,Vu =v|N)P(Su,Ru=r,Zu=k|N,Mv=m,Vu=v)
m∈[0,N−1],v∈[1,V],r∈[1,Nmax],k∈[1,Nmax]
P(Su|N) =
V
∑
v=1
N−1
∑
m=0
Nmax
∑
r=1
Nmax
∑
k=1
P(Su,Mv=m,Vu=v,Ru =r,Zu =k|N)
= N−1
∑
m=0
N−1 m
1 V
m
1− 1
V
N−m−1Nmax
∑
r=1
P(Su|N,Mv=m,Ru =r)
Nmax
∑
k=1
P(Ru =r|N,Zu=k)P(Zu=k) (17)
= N−1
∑
m=0
N−1 m
1 V
m
1− 1
V
N−m−1Nmax
∑
r=1
CPN,m,rP(Ru =r|N =N)
= N−1
∑
m=0
N−1 m
1 V
m
1− 1
V
N−m−1
CPN,m
whereCPN,m = ∑Nr=max1 CPN,m,rP(Ru = r|N)which denotes the capture probability of a device
when it collides withmdevices amongNdevices.
Consequently, we can obtain the one-shot RA throughput whenNdevices participate in RA as
E[S|N] =NP(Su|N)
=N N−1
∑
m=0
N−1 m
1 V
m
1− 1
V
N−m−1
CPN,m (18)
4.2.2. Steady-state RA throughput analysis model
As seen in Equation (14), the capture probability,CPN,m,r, is affected by the distribution of the ramping numberP(Ru|N), which is determined byE[NTk=t]as in Equation (9). Therefore, E[NTk=t] must first be obtained. Let us assume that network is in a steady-state with stable number of RA accessesNat each RA slot, then, with a slight abuse of notation, we can still representNandNTk=tas steady-state values. Then, the following condition holds.
Nmax
∑
t=1
Nmax
∑
k=1
E[NTk=t] =N (19)
Note that E[NT=1] = ∑kE[NTk=1] denotes the number of new arrivals. Now, we introduce a
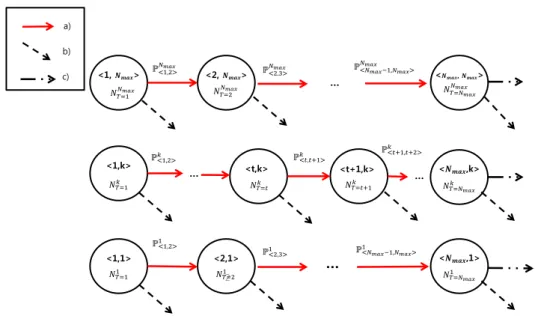
Markov chain model to determine the state of the devices, where state<t,k>presents those devices with a trial numbertand are located inzone k. If we assume that the M2M devices have no mobility, a state transition only occurs when a device a) fails in RA and retries (from<t,k>to< t+1,k>), b) succeeds in RA, or c) fails in its connection set up. Figure2presents this Markov chanin model. Then,Pk<t,t+1>can be derived as follows:
Pk<t,t+1>=1−P(Su|N,Tu=t,Zu=k)
=1−P(Su|N,Ru =min(t,k)) (20)
2
<1,1> <2,1> <𝑵𝒎𝒂𝒙,1>
<𝑵𝒎𝒂𝒙, 𝑵𝒎𝒂𝒙>
<t+1,k> <t,k> ℙ<𝑡,𝑡+1>
𝑘
<1,k> <1, 𝑵𝒎𝒂𝒙>
ℙ<1,2>1
ℙ<1,2>𝑘
ℙ<1,2>𝑁𝑚𝑎𝑥 ℙ<𝑁𝑁𝑚𝑎𝑥𝑚𝑎𝑥−1,𝑁𝑚𝑎𝑥>
ℙ1<𝑁𝑚𝑎𝑥−1,𝑁𝑚𝑎𝑥> <2, 𝑵𝒎𝒂𝒙>
ℙ<𝑡+1,𝑡+2>𝑘
…
…
…
ℙ<2,3>𝑁𝑚𝑎𝑥
ℙ<2,3>1
𝑁𝑇=11
𝑁𝑇=1𝑘
𝑁𝑇=1𝑁𝑚𝑎𝑥 𝑁𝑇=2𝑁𝑚𝑎𝑥 𝑁𝑇=𝑁𝑚𝑎𝑥
𝑁𝑚𝑎𝑥
𝑁𝑇=21 𝑁𝑇=𝑁1 𝑚𝑎𝑥
𝑁𝑇=𝑡𝑘 𝑁𝑇=𝑡+1𝑘
a)
b)
c)
<𝑵𝒎𝒂𝒙,k>
𝑁𝑇=𝑁𝑘 𝑚𝑎𝑥
…
Figure 2.Markov chain model of the devices. State<t,k>indicates that the devices with the trial numberTu =tandZu =k. Note that state transitions occur when a) RA failure, b) RA success, and c) connection failure occurs, respectively.
Ubiquitous Network Laboratory 3
One-shot Model (for fixed 𝑁)
Eq.(11) – (18) Initialization
𝑁
Initial {𝐸 𝑁𝑇=𝑡𝑘 } that holds eq.(19)
• RA throughput 𝐸[𝑆|𝑁] as eq.(18)
• RA success prob. for given 𝑟 ℙ[𝑆𝑢|𝑁, 𝑅𝑢= 𝑟] as eq.(21)
• State transition prob. ℙ<𝑡,𝑡+1>𝑘 as eq.(20)
• Expected value of 𝑁𝑇=𝑡𝑘
𝐸[𝑁𝑇=𝑡𝑘 ] as eq.(22) and eq.(19)
Figure 3.Summary for the iterative derivation of the steady state RA throughput
P(Su|N,Ru =r) = P(Su,Ru =r|N)
P(Ru =r|N) (21)
= N−1
∑
m=0
N−1
m
1
V
m
1− 1
V
N−m−1
CPN,m,r
Finally, we can obtain the steady-state valueE[NTk=t]using balance equation property.
E[nkT=t+1] =
(
P(Zu=k)E[NT=1] , t=1
Pk<t,t+1>E[nkT=t] , 1<t≤Nmax−1
(22)
4.3. Connection failure probability
Connection failure probability is defined as the probability that a device fails to acquire connectivity by failing the RA process Nmax times. LetPCS,T=t|N,Z=k and PCF,T=t|N,Z=k denote the conditional connection success and connection failure probabilities, respectively, of a device with a trial numbertfor givenzone kand total arrivalN, respectively. Therefore,PCS,T=t|N,Z=kis equal to the probability that the device fails at RA(t−1)times, and finally succeeds in thetthRA trial. Then,
PCS,T=t|N,Z=k =
(
PS|N,R=r∏ti=−11(1−PS|N,R=i), ift≤k
PS|N,R=k(1−PS|N,R=k)t −k
∏k−1
i=1(1−PS|N,R=i), if,t > k
(23)
wherePS|N,R=ris the simple notation ofP(Su|N,Ru =r), as defined in Equation (21). Then, the connection failure event is same as the complementary event of the connection success cases. Thus,
PCF|N,Z=kcan be derived as follows:
PCF|N,Z=k =1− Nmax
∑
t=1
PCS,T=t|N,Z=k (24)
=1−
k
∑
r=1
PS|N,R=r r−1
∏
i=1
(1−PS|N,R=i)−PS|N,R=k
k−1
∏
i=1
(1−PS|N,R=i) Nmax
∑
t=k+1
(1−PS|N,R=k)t−k
Finally, the connection failure probability,PCF|N, can be derived using Equation (8) as follows:
PCF|N= Nmax
∑
k=1
PCF|N,Z=kP(Zu =k) (25)
4.4. Average Energy consumption
4.4.1. Energy consumption model
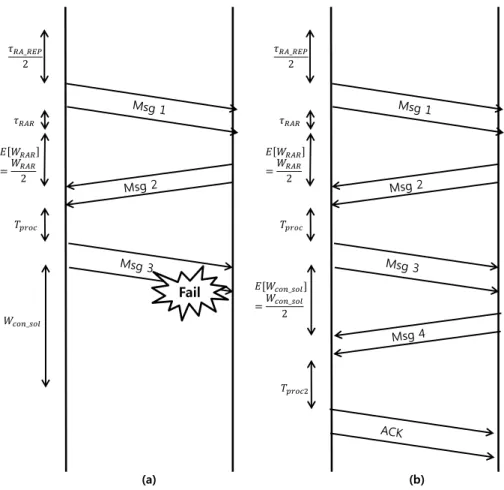
An average energy consumption model for the devices needs to be defined to analyze the energy consumption of the proposed scheme. For the energy-consumption parameters, we have partially referenced the model used in [10]. In [10], the authors assumed that an RA collision is detected by the eNB during the Msg1 reception, whereas we assumed that a collision is detected when the eNB cannot decode Msg3. Therefore, we refer to and modify the energy consumption model defined in [10]. In this study, the description of how parameters are defined is omitted. See [10] for a detailed description of the parameters. Instead, we provide simplified description in Figure4. LetP1,P2, and
P3denote the power consumption for waiting RA slot and performing back-off, receiving messages
from the eNB, and transmission respectively. Here, for analytic convenience, we assume that all transmission powers are equal, i.e.,P3 =Pmsg1 =Pmsg3as in Equation (5). Then, the average energy
consumption for failed RA and successful RA events can be modeled as follows.
1. The energy consumed during a failed RA event is equal to that consumed in the following steps: waiting for the first RA slots((τRA_REP/2)P1), transmitting Msg1 (P3), waiting for the RAR
window (τRARP1), wating for the Msg2 ((WRAR/2)P2), receiving the Msg2 (τmsg2P2), processing
time for Msg3 (TprocP2), transmitting Msg3 (P3), and expiring the contention-resolution timer
(Wcon_solP2).
2. The energy consumed during a successful RA event is equal to that consumed during the following steps. From transmitting Msg1 to receiving Msg2, the power consumed by the successful RA follows that consumed by the failed RA procedure and equals((τRA_REP/2)P1+
𝐸 𝑊𝑅𝐴𝑅
=𝑊𝑅𝐴𝑅
2 𝜏𝑅𝐴𝑅
𝑇𝑝𝑟𝑜𝑐
𝑊𝑐𝑜𝑛_𝑠𝑜𝑙
Fail 𝜏𝑅𝐴_𝑅𝐸𝑃
2
𝐸 𝑊𝑅𝐴𝑅
=𝑊𝑅𝐴𝑅
2 𝜏𝑅𝐴𝑅
𝑇𝑝𝑟𝑜𝑐
𝐸[𝑊𝑐𝑜𝑛_𝑠𝑜𝑙]
=𝑊𝑐𝑜𝑛_𝑠𝑜𝑙
2 𝜏𝑅𝐴_𝑅𝐸𝑃
2
𝑇𝑝𝑟𝑜𝑐2
(a) (b)
Msg4 ((Wcon_sol/2)P2), the power consumed when receiving Msg4 (τmsg4P2), processing time for
ACK (Tproc2P2), and the power consumed by transmitting the ACK of Msg4 (P3).
Note that 1/2 terms denote the average time values. Parameter values in the above model are described in Table2.
4.4.2. Average energy consumption
δFandδSdenote the energy consumption for single failed and successful RA event, respectively. Note that δF and δS are random variables because P3 is the random variable that is determined
by the trial number and the path-loss of device as in Equation (5) and (7). Therefore, P3 can be
expressed asP3(t,x)[mW] =P(r)P(x)Pc, whereP(r)is the ramping component;r=min(t,Kmax(x))
,P(x) is the path-loss component, andPc is the target power, which is a constant value. From the previously-described power consumption model,δFandδScan be simply expressed as follows:
δF=θ1P3(t,x) +θ2 (26)
δS=θ3P3(t,x) +θ4
where θ1,θ2,θ3, and θ4 are constants defined by the consumption model. In the previous section,
because the analysis was performed based onZu = k rather than Xu = x, Equation (26) can be reformulated as follows:
¯
δF,k(t) =θ1P¯3,k(t) +θ2 (27)
¯
δS,k(t) =θ3P¯3,k(t) +θ4
where ¯δF,k(t)and ¯δS,k(t)denote the average energy consumption of device, that is located within zone kwith the trial number t,having single failed and successful RA events, respectively. Here,
¯
P3,k(t)can be calculated using the average path-loss of the devices withinzone k. Therefore, ¯P3,k(t) = P(r)P¯(k)PcwhereP(r)is the ramping component wherer=min(t,k), ¯P(k)is the average path-loss of devices inzone k.
The energy consumption of a device located within zone k that succeeds in acquiring a connection after a numbertof RA trials is denoted bywS(t,k). Moreover,wF(k)denotes the energy consumption of a device located withinzone kthat fails to acquire a connection. Then,wS(t,k)and wF(k)can be derived as follows:
wS(t,k) = Kt,k−1
∑
t=1
¯
δF,k(t) + (t−Kt,k)δ¯F,k(Kt,k) +δ¯S,k(Kt,k) (28)
wF(k) = Kt,k
∑
t=1
¯
δF,k(t) + (Nmax−Kt,k)δ¯F,k(Kt,k)
whereKt,k=min(t,k), which denotes the maximum ramping number of the device withTu=t andZu = kas defined in Equation (7). Then, the average energy consumption of a device located withinzone kwhen the total arrival isN, i.e.,E[W|N,Zu = k], is calculated using Equation (23) and (24) as follows:
E[W|N,Zu =k] = Nmax
∑
t=1
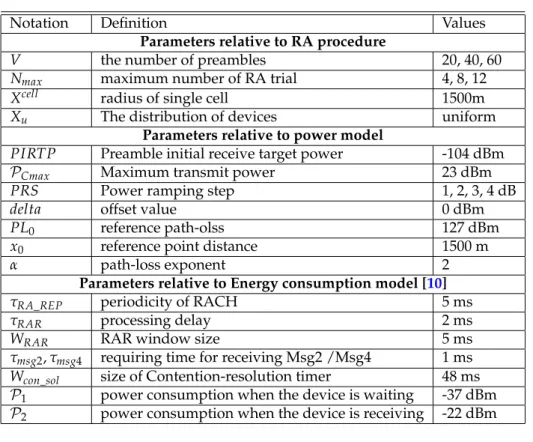
Table 2.Simulation Parameters
Notation Definition Values
Parameters relative to RA procedure
V the number of preambles 20, 40, 60
Nmax maximum number of RA trial 4, 8, 12
Xcell radius of single cell 1500m
Xu The distribution of devices uniform
Parameters relative to power model
PIRTP Preamble initial receive target power -104 dBm
PCmax Maximum transmit power 23 dBm
PRS Power ramping step 1, 2, 3, 4 dB
delta offset value 0 dBm
PL0 reference path-olss 127 dBm
x0 reference point distance 1500 m
α path-loss exponent 2
Parameters relative to Energy consumption model [10]
τRA_REP periodicity of RACH 5 ms
τRAR processing delay 2 ms
WRAR RAR window size 5 ms
τmsg2,τmsg4 requiring time for receiving Msg2 /Msg4 1 ms
Wcon_sol size of Contention-resolution timer 48 ms
P1 power consumption when the device is waiting -37 dBm
P2 power consumption when the device is receiving -22 dBm
Finally,E[W|N =N]is
E[W|N] = Nmax
∑
k=1
E[W|N,Zu =k]P(Zu =k) (30)
5. Simulation Results
In this section, the simulation results are provided to show the performance of the proposed Msg3 PR scheme. A discrete event simulator is built to analyze the performance of the RA procedure and the effect of the capture. The simulator implements the RA procedure defined in Section2.1, and also implements the capture effects by adjusting the capture condition as Equation (1). Table2
summarizes the commonly used simulation parameters in Section5.1and Section5.1.
Through the analysis results defined in section 4 and the simulation results, the steady-state performances in terms of the RA throughput, the connection failure probability and the average energy consumption are presented in Section5.1. In Section5.2, the possibility of coexistence of the Msg3 PR scheme with other typical RA-related schemes is presented by showing simulation result.
5.1. Performance of the Msg3 PR scheme
In this subsection, we present the analysis (Anal.) and simulation (Sim.) results of the Msg3 PR scheme when the network is in a steady-state. Because the steady-state analysis model defined in Section4can be obtained when N is determined, the simulations also performed with fixedN. Therefore, we generate static new arrival at each RACH to converge the total arrival toN. Moreover, the locations of newly arrived devices are determined by the uniform distribution.
. The simulation model assumes a steady-state condition. In other words, the number of arrivals and the distribution of the trial and the ramping number of devices converge.
Table 3.P(Su|N=60,Ru=r)(%)
PRS\Ru 1 2 3 4 5 6 7 8
1dB 4.9 4.9 4.9 9.8 13.3 15.8 20.0 28.4 2dB 4.9 4.9 12.0 21.3 36.6 59.1 81.8 95.7 3dB 4.9 14.0 26.3 50.6 81.2 97.6 99.9 99.9 4dB 4.9 15.3 45.0 82.7 98.9 99.9 99.9 99.9
consumption analysis according to PRS change are additionally performed to further analyze the performance of Msg3 PR scheme. The performance metrics used in the study are defined as follows.
The RA throughput performance is evaluated in terms of PRS, Nmax, and the number of preambles in a RACH,V. Furthermore, analyses of the connection failure probability and the average energy consumption according to PRS change are additionally performed to further analyze the performance of the Msg3 PR scheme. Note that we use the same parameters relative to energy consumption model as in Table 2 on the simulation. The performance metrics used in the study are defined as follows.
• RA throughput
(Anal.) - Equation (18).
(Sim.)
E[S|N] = Total#o f RA Success Devices N×SimNumber • Connection failure probability
(Anal.) - Equation (25).
(Sim.)
PCF|N=
Total#o f Connection Failed Devices Total#o f RA Completed Devices • Average energy consumption
(Anal.) - Equation (30).
(Sim.)
E[W|N] = Total E.C o f RA Completed Devices Total#o f RA Completed Devices
In each figure, the analysis results are displayed as lines, and the simulation results are displayed as markings if we performed both an analysis and a simulation.
5.1.1. The consequences of the capture effect and its properties
Before discussing the performance metrics of the Msg3 PR scheme, we describe the consequences of the capture effect and its properties. Table3shows the RA success probability for given ramping numbers defined as in Equation (21), when the number of accesses is high, i.e.,P(Su|N=60,Ru=r).
As seen in Table3,P(Su|N = 60,Ru = r)increases asrincreases. For example,P(Su|N =60,Ru =
1) = 4.9% whereasP(Su|N = 60,Ru = 8) = 28.4 % whenPRS = 1dB. And,P(Su|N = 60,Ru =
1) = 4.9 % whereas P(Su|N = 60,Ru = 8) = 99.9 % when PRS = 4 dB. In other words, the
probability of RA success for a device withRu = 8 is 5.7 times that of a device with Ru = 1 when PRS = 1 dB. Furthermore, in the case ofPRS = 4 dB, the difference in the success probability is further increased to approximately 20.4 times. From Table3, the RA success probability increases as the Msg3 PR scheme uses higherPRSvalues.
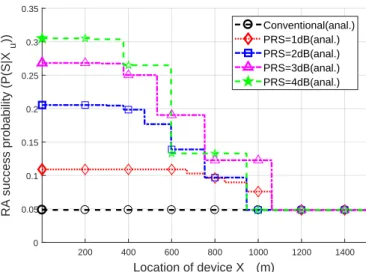
200 400 600 800 1000 1200 1400 Location of device X
u (m)
0 0.05 0.1 0.15 0.2 0.25 0.3 0.35
RA success probability (P(S|X
u
))
Conventional(anal.) PRS=1dB(anal.) PRS=2dB(anal.) PRS=3dB(anal.) PRS=4dB(anal.)
Figure 5.RA success probability according to the location of the device withN =60. i.e.,P(Su|N= 60,Xu=x).
5 10 15 20 25 30 35 40 45 50 55 60
The number of arrival (N) 0
5 10 15
Throughput
Conventional (anal.& sim.) PRS=1dB(anal.& sim.) PRS=2dB(anal.& sim.) PRS=3dB(anal.& sim.) PRS=4dB(anal.& sim.)
Figure 6.Steady-state RA throughput in terms ofPRS
RA success probability decreases as the device moves away from the eNB. This is becauseKmax(x) defined in Equation (6), decreases as x increases, and thus, the capture probability declines. One interesting point in Figure5is that the RA success probability is not necessarily high when thePRS is high; in other words, trend noted in Table3 is not always true. Based on the distance, the RA success probability whenPRS=4dBis often less than the RA success probability withPRS=3dB. Moreover, even whenxis between approximately 600 m and 700 m, the RA success probability for a PRS=4dBis lower than that with aPRS=2dB. The reason is that having too large of aPRSvalue in certain areas lowers the maximum ramping number, as seen in Equation (6), and therefore, the RA success probability can be decreased. As a result, as thePRSincreases, the devices close to the eNB have a higher probability of being captured, while the devices further from the eNB cannot perform power ramping well due to their lowerKmax. Hence, we can make an inference about performance : an increase inPRSdoes not necessarily lead to an increase in RA performance.
5.1.2. The RA throughput
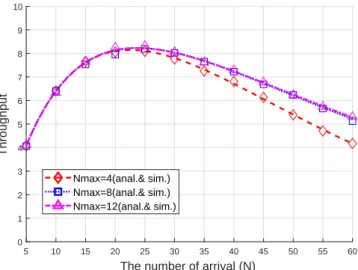
5 10 15 20 25 30 35 40 45 50 55 60
The number of arrival (N) 0
1 2 3 4 5 6 7 8 9 10
Throughput
Nmax=4(anal.& sim.) Nmax=8(anal.& sim.) Nmax=12(anal.& sim.)
Figure 7.Steady-state RA throughput in terms ofNmax
10 20 30 40 50 60 70 80 90 100 110 120
The number of arrival (n)
0 5 10 15 20 25 30 35 40
Throughput
V=20(anal.& sim.) V=40(anal.& sim.) V=60(anal.& sim.)
effect of Msg3 (i.e.,E[Su,Mv = 0|N]) [4,5,9,14]. The RA throughput is clearly improved using the Msg3 PR scheme; particularly when heavy congestion occurs (i.e.,N=3V=60), the RA throughput forPRS = 1 dB, 2dB, 3dB, and 4dBis improved by approximately 48 %, 80 %, 137 %, and 105 %, respectively, as compared to the conventional case. This is because fact that the capture effect may occur among the devices that suffer from collisions that reduce the RA throughput, and the Msg3 PR can increase the capture probability. Note that the increase in PRSdoes not necessarily lead to an increase in RA throughput, as previously mentioned. In particular, the RA throughput in the case of 4 dBis lower than that in the case of 3dBbecause the RA success probability of 4 dB-case is lower, as seen in Figure5. Therefore, it is important to choose a properPRSvalue. For example, choosing PRS=3dBwould be preferred in terms of the RA throughput.
Figure7illustrates the effect of changes inNmax on the RA throughput whenPRS = 2 dBand V =20. Comparing the RA throughputs in the cases whenNmax = 4 andNmax = 8, a throughput difference is observed when the number of accesses is large because, if the congestion level is not severe (N ≤ 25), retransmissions are not likely to occur more than four times. Hence, There is no throughput difference between these two cases. However, if the congestion level becomes severe, the trial number of most devices will reach toNmax due to severe collisions. Therefore, in this case, the probability of capture increasesNmax is larger. However, this observation does not apply to the Nmax = 12 case; the performance difference between the cases withNmax = 8 and 12 is negligible. This is because of the following reasons: 1) most devices (except the devices near the eNB) could not increase their ramping number enough due to the ramping number limitation,Kmax, and 2) the devices near the eNB are often captured before the ramping number is significantly increased. As a result, ifNmaxbecomes sufficiently large, the overall throughput is no longer affected.
In Figure8, we also show the RA throughput varying with the size of the preamble set,V, where PRS=2dBandNmax =8. As analyzed in other studies [5,6,8,12] (or, the conventional case in shown Figure6), the RA throughput is maximized when the number of accesses is same as the preamble size, i.e.,n=V. However, if the Msg3 PR is used, the number of throughput-maximizing arrivals increases significantly. This result further demonstrates that, because of the capture effect on the RA procedure, optimization is needed if diverse RACH congestion-control schemes, such as ACB or M2M-specific back-off, are used.
5.1.3. The connection failure probability
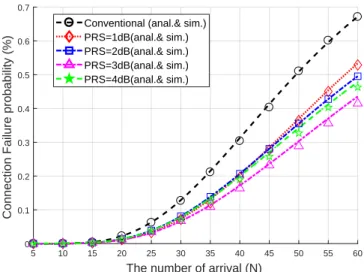
5 10 15 20 25 30 35 40 45 50 55 60
The number of arrival (N) 0
0.1 0.2 0.3 0.4 0.5 0.6 0.7
Connection Failure probability (%)
Conventional (anal.& sim.) PRS=1dB(anal.& sim.) PRS=2dB(anal.& sim.) PRS=3dB(anal.& sim.) PRS=4dB(anal.& sim.)
Figure 9.Connection failure probability (Nmax=8,V=20).
connection failure probability increases due to severe collisions. In the conventioal case, almost 70 % of devices experience a connection failure when the number of arrivals surges (N = 60). The Msg3 PR scheme reduces the connection failure probability significantly. For example, under heavy access load (N = 60), the connection failure probability could be reduced by approximately 42 % when Msg3 PR withPRS = 3 dBis used, as compared with the conventional case. Also, the connection failure probability of the 3dB-case is lower than that of 4dB-case.
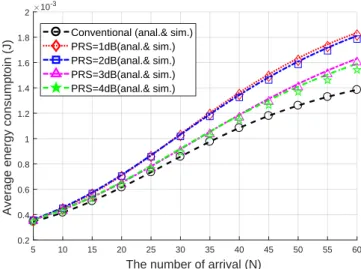
5.1.4. The average energy consumption
5 10 15 20 25 30 35 40 45 50 55 60
The number of arrival (N) 0.2
0.4 0.6 0.8 1 1.2 1.4 1.6 1.8 2
Average energy consumptoin (J)
10-3
Conventional (anal.& sim.) PRS=1dB(anal.& sim.) PRS=2dB(anal.& sim.) PRS=3dB(anal.& sim.) PRS=4dB(anal.& sim.)
Figure 10. Average energy consumption of devices that completed the RA procedure (Nmax = 8,
V=20).
Figure10presents the average energy consumption of the devices that completed the RA. We plot the performance whenV = 20 andNmax =8. The average energy consumption of the devices increases with increasing numbers of accesses; this is because the RA success probability decreases due to the congestion. Since most energy consumption occurs during transmission, the Msg3 PR scheme consumes more energy than the conventioal case. However, increasing the PRS does not necessarily increase the energy consumption. Surprisingly, the Msg3 PR withPRS = 3 dBor 4 dB consumes less energy than the Msg3 PR with PRS = 1 dB or 2 dB. For example, the Msg3 PR consumes approximately 13 % more energy than the conventional case whenPRS = 3 dBor 4 dB, while it consumes approximately 30 % more energy than the conventional case whenPRS = 1 dB orPRS = 2 dB. From this observation, we can argue that the energy consumption reductions due to the increase in the RA success probability are greater than the increased energy consumption due to increased transmission power results fromPRSincrement. In conclusion, choosing proper values ofPRSandNmaxfor the Msg3 PR scheme can improve the RA throughput and lower the connection failure probability with relatively little additional energy consumption.
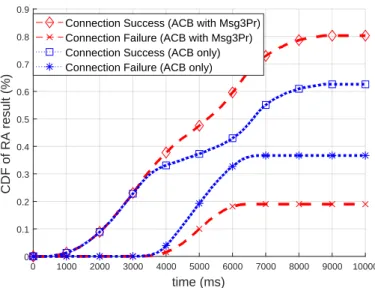
5.2. Coexistence with other schemes
Because the Msg3 PR scheme only controls the Msg3 transmission power, it can easily coexist with other RA-related schemes. In this sub-section, we discuss the possibility of coexistence of the Msg3 PR scheme with other typical RA-related schemes through simulation result.
0 1000 2000 3000 4000 5000 6000 7000 8000 9000 10000
time (ms) 0
0.1 0.2 0.3 0.4 0.5 0.6 0.7 0.8 0.9
CDF of RA result (%)
Connection Success (ACB with Msg3Pr) Connection Failure (ACB with Msg3Pr) Connection Success (ACB only) Connection Failure (ACB only)
Figure 11.CDF of RA results when optimal ACB is used.
g(τ) = τ
a−1(T
A−τ)b−1
TAa+b−2Beta(a,b), 0≤τ≤TA (31) whereBeta(a,b)is the beta-function,TA is the activation time which denotes the period during which all devices are activated, anda = 3,b = 4 for bursty-M2M traffic. In this simulation, 10000 devices are uniformly distributed in a cell, and each device generates traffic only once. That is, when a device experiences connection failure / success, it does not participate in the RA again. The activation time,TA, is 10 seconds. Optimal ACB is assumed in this simulation, and the barring time and back-off window size are 200ms and 20ms, respectively.
Figure11illustrates the cumulative distribution function (CDF) of the RA results over time when the optimal ACB is used. The ACB scheme controls the number of participants, so that the efficiency of the RACH could be maximized. Therefore, if severe congestion is predicted, it protects the RACH efficiency by blocking accesses of devices, but it does not improve RA throughput itself. As seen in Figure11, the number of connection failed-devices is increased due to bursty arrivals if only the ACB is used. However, when using the ACB with the Msg3 PR, the number of devices experiencing connection failure is much smaller than in the case of using the ACB only. Because the Msg3 PR scheme improves the RA throughput, approximately 20 % of devices (almost 2000 devices) are more successful in acquiring connections by using the Msg3 PR together. Furthermore, this performance is the result when the ACB is performed without considering the RA efficiency improvement due to the Msg3 PR scheme. Therefore, although it is not the scope of this study, a larger performance improvement can be expected if ACB optimization is performed considering Msg3 PR.
6. Conclusion
RACH congestion problems resulting from massive access by the M2M devices cause severe performance degradation on both the eNB and M2M devices. For examples, wasting the uplink resources such as RACH and PUSCH, and increasing the connection failure probability hindering the M2M communications.
A steady-state analysis model was provided to show the performance of the proposed scheme in terms of the RA throughput, the connection failure probability, and the average energy consumption. Numerical results of analysis and simulation results showed that the Msg3 PR scheme with proper parameters increases the RA throughput (also increased the PUSCH efficiency), even under heavy access loads. Moreover, the proposed scheme reduced the connection failure probability which disturbs the M2M communications, by slightly increasing the average energy consumption.
Moreover, by conducting additional simulation, we discussed the benefits of using the proposed scheme and the effects of coexistence with other RA-related technologies. The simulation results show that the proposed algorithm can be combined with other technologies to achieve a larger performance improvement. In future work, further optimization could be performed for RA-related technologies using the Msg3 PR scheme is used.
Acknowledgments: This work was supported by the ICT R&D program of MSIP/IITP, Republic of Korea. [B0101-17-1276, Access Network Control Techniques for Various IoT Services]
Author Contributions:“J.Kim. conceived of study, proposed idea and analysis model, designed the simulations, and wrote the paper; J.Lee. participated in the coordination of the research, corrected the manuscript. and searched for funding to support the work.”
The sponsor had no role in the design of the study; in the collection, analyses, or interpretation of data; in the writing of the manuscript, and in the decision to publish the results.
Bibliography
1. 3GPP. Service Requirements for Machine-Type Communications.3GPP TS 22.368 V13.1.02014.
2. 3GPP. Study on RAN Improvements for Machine-Type Communications. 3GPP TR 37.868 V11.0.02011, Sophia, Antipolis, France.
3. Kim, J., Lee, J., Kim, J., Yun, J. M2M Service Platforms: Survey, Issues, and Enabling Technologies. IEEE
Commun. Surveys, Tutorials2014,16, 142-149, DOI:10.1109/SURV.2013.100713.00203.
4. Duan, S., Shah-Mansouri, V., Wang, Z., Wong, V. W. D-ACB: Adaptive Congestion Control Algorithm for Bursty M2M Traffic in LTE Networks. IEEE Trans. Veh. Technol. 2016, 65, 9847-9861, DOI: 10.1109/TVT.2016.2527601.
5. S.-Y. Lien, T.-H. Liau, C.-Y. Kao, and K.-C. Chen. Cooperative access class barring for machine-to-machine communications.IEEE Trans. Wireless Commun.2012,11, 27-32, DOI: 10.1109/TWC.2011.111611.110350 6. Z. Wang and V. W. S. Wong. Optimal Access Class Barring for Stationary Machine Type Communication
Devices With Timing Advance Information. IEEE Trans. Wireless Commun. 2015, 14, 5374-5387, DOI: 10.1109/TWC.2015.2437872
7. Li, Ning, Chao Cao, and Cong Wang. Dynamic Resource Allocation and Access Class Barring Scheme for Delay-Sensitive Devices in Machine to Machin (M2M) Communnications. Sensors 2017, 17, 1407, doi:10.3390/s17061407
8. K. D. Lee, S. Kim and B. Yi. Throughput comparison of random access methods for M2M service over LTE networks.Proc. IEEE GC Wkshps2011, 373-377, DOI: 10.1109/GLOCOMW.2011.6162474
9. M. Vilgelm; M. Guersu; W. Kellerer; M. Reisslein. LATMAPA: Load-Adaptive Throughput-MAximizing Preamble Allocation for Prioritization in 5G Random Access. IEEE Access. 2017, 5, 1103-1116, DOI: 10.1109/ACCESS.2017.2651170
10. O. Arouk, A. Ksentini and T. Taleb. Group Paging-Based Energy Saving for Massive MTC Accesses in LTE and Beyond Networks.IEEE J. Sel. Areas Commun.2016,34, 1086-1102, DOI: 10.1109/JSAC.2016.2520222 11. C. Y. Ho and C. Y. Huang. Energy-Saving Massive Access Control and Resource Allocation Schemes for
M2M Communications in OFDMA Cellular Networks.IEEE Wireless Commun. Lett. 2012,1, 209-212, DOI: 10.1109/WCL.2012.031912.110278
13. D. Niyato, P. Wang and D. I. Kim. Performance Modeling and Analysis of Heterogeneous Machine Type Communications. IEEE Trans. Wireless Commun. 2014, 13, 2836-2849, DOI: 10.1109/TWC.2014.040714.131583
14. G. Y. Lin, S. R. Chang and H. Y. Wei. Estimation and Adaptation for Bursty LTE Random Access. IEEE
Trans. Veh. Technol.2016,1, 2560-2577, DOI: 10.1109/TVT.2015.2418811
15. W. Yue. The effect of capture on performance of multichannel slotted ALOHA systems. IEEE Trans.
Commun.1991,39, 818-822, DOI: 10.1109/26.87169
16. A. Zanella and M. Zorzi. Theoretical Analysis of the Capture Probability in Wireless Systems with Multiple Packet Reception Capabilities. IEEE Trans. Commun. 2012, 60, 1058-1071, DOI: 10.1109/TCOMM.2012.021712.100782
17. 3GPP. Medium Access Control (MAC) protocol specication.3GPP TS 36.321 V10.2.02011, Sophia Antipolis Cedex.
18. 3GPP. Evolved Universal Terrestrial Radio Access (E-UTRA); Physical layer procedures. 3GPP TS 36.213
V14.3.02017.
19. L. Song and J. Shen. Evolved Cellular Network Planning and Optimization for UMTS and LTE. CRC press. 2010.