Multidimensional Open Government Data
Efthimios Tambouris
University of Macedonia, Egnatia 156, Thessaloniki, Greece, [email protected]
Abstract: A large amount of open government data concerns official and unofficial statistics. These data can be represented as multidimensional data. In this paper, we commence by presenting data fragmentation, an important challenge when exploiting open data. We thereafter introduce multidimensional data as a possible solution to overcome data fragmentation. More specifically, we outline the data cube model and linked open data technologies. In addition, we present a process for multidimensional linked open data publication and reuse. We also present several software tools that have been developed to manage multidimensional linked open data. We finally summarize the benefits and some of the main obstacles.
Keywords: open data, statistics, RDF qb.
Acknowledgement: This paper outlines the contents of a keynote presentation given in CEDEM 2016. The author would like to acknowledge that the ideas presented in this paper are the result of team work at the University of Macedonia and CERTH/ITI. The examples presented in section 2 were developed by students of the University of Macedonia. This work is funded by the European Commission within the H2020 OpenGovIntelligence project.
1.
Introduction
During the last decade, many countries across the world adopted open data policies suggesting that data produced by the public sector are freeely available to anyone for reuse. It has been assumed that opening up data can, amongst others, increase transparency and boost economic growth. As a result, an increasing number of governments, public authorities, organisations and companies are launching open data portals.
Delving into social data, we proposed a framework to better understand and exploit the predictive power of social data (Kalampokis et al., 2013).
Studies, however, reveal that publishing open data does not automatically provide benefits (Janssen et al., 2012). More insight is clearly needed into what works, what does not work and under what conditions. Targeted research is also needed thus avoiding the simplified approach of one-fits-all. The research path reported in this paper commenced with the examination of data in open government portals.
This paper presents the results of on-going research into exploiting the benefits of multidimensional open data. The starting point of this research is the observation that most datasets within open government portals contain numerical data and concern statistics in a broad sense. This suggested that data can be explicitly modeled as multidimensional data, hence exploiting the excessive body of knowledge in data warehouses and business intelligence.
The rest of this paper is organized as follows. Section 2 introduces statistical open data. Sections 3 and 4 summarize the main relevant literature, namely the data cube model proposed for modeling multidimensional data and linked open data technologies proposed to link data residing in disperse data stores. Sections 5 and 6 outline a process and tools for exploiting statistical open data respectively.
2.
Statistical Open Data
More than 180 open data portals around the globe provide data that can be freely used, reused and redistributed by anyone. A big part of open data concerns statistics, such as demographics, economic and social data. For example, in May 2016, 6,238 out of 8,610 datasets of the EU Open Data Portal (open-data.europa.eu) were statistical data. The role of statistical data is also recognized in policy documents and reports, e.g., European Commission (2014).
The uses of open statistical data are multifaceted. For example, we can visualize data to improve our understanding of the phenomenon under investigation. In addition, we can perform several statistical analyses. We can also develop value-added applications as data are highly structured. In the context of an Open Government Data (OGD) portals ecosystem, the novelty comes from employing multiple datasets coming from one or multiple data portals.
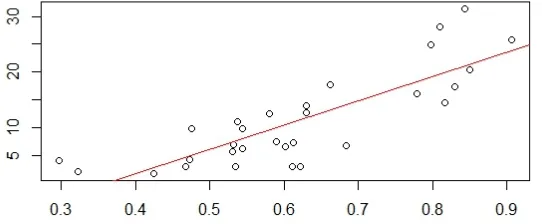
Figure 1: Internet Usage (Digital Agenda) Versus Individuals’ Level of Internet Skills (Eurostat)
Furthermore, Figure 2 presents data on lifelong learning versus Internet usage. The first dataset was obtained from Eurostat, while the second dataset was obtained from the Digital Agenda. More specifically, the Y axis presents, in a scale of 0 to 100, lifelong learning as the number of persons aged 25 to 64 who stated that they received education or training in the four weeks preceding the survey while the X axis presents, in a scale of 0 to 1, internet usage as the percentage of households that have daily access to the Internet at home (ages 16-74).
Figure 2: Lifelong Learning (Eurostat) Versus Internet Usage (Digital Agenda)
When trying to use data from one or multiple OGD portals the problem of data fragmentation is evident. As a result, combining data about a single measure from an OGD portal becomes a non-trivial exercise. As an example, if one tries to search data.gov.uk using the single keyword unemployment they would eventually need to open more than 2,000 different files coming from nine different portals. All these files and contained data need to be manually extracted and processed. It is therefore evident that a better alternative is needed.
The situation is much worse when we need to exploit data from multiple portals. Therefore, it seems that we are building open data silos. There is, therefore, a clear need to integrate statistical data silos thus resolving the data fragmentation obstacle.
3.
Multidimensional Data - The Data Cube Model
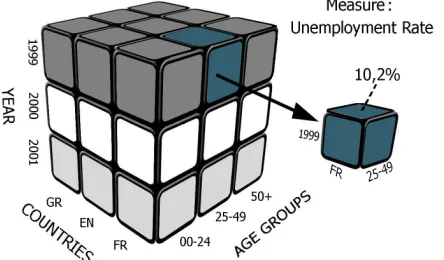
Figure 3 presents an example where the measure is unemployment rate, the dimensions are Year, Country and Age group, while the unit of measurement is the percentage. In this specific example, when year is 1999 and country is France and age group is 25-49 then the unemployment rate is 10.2%. Dimensions sometimes contain hierarchies. For example, a time hierarchy may include years, quarters and months.
Figure 3: Example of Unemployment Data Organised in a Data Cube Structure
Multidimensional data is not a new concept. Data cubes are essential in data mining and business intelligence amongst other areas. In the literature, the main Online Analytical Processing (OLAP) operations that are usually performed on top of data cubes include (Codd et al., 1993):
• Roll up (or drill up): summarize by climbing up a hierarchy or by dimension reduction, e.g., unemployment at EU level.
• Drill down (or roll down): going down a hierarchy or dimension introduction, e.g., unemployment at the regional level or introducing sex as a fourth dimension. • Dice: select, e.g., only data for France and Greece and for 2000 and 2001, are shown. • Slice: project data, e.g., only 2000 data, are shown.
• Pivot: rotate the cube for visualization purposes.
All this knowledge can be exploited in the case of statistical open data. However, data fragmentation is apparent in data cubes as well. Open statistical data integration is now a problem of combining “compatible” cubes. The relevant OLAP operation is called drill across and there are many ways to perform it.
Figure 4: Expanding a Cube with Data from other Cubes
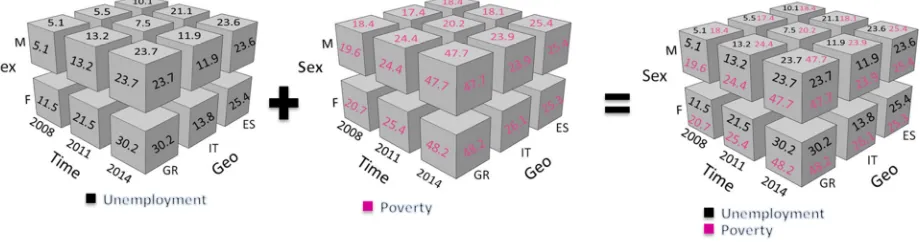
Another example is presented in figure 5 where two cubes with the same dimensions but with different measures (unemployment and poverty) are joined. The resulted cube contains two measures along the same dimensions.
Figure 5: Expanding a Cube with Data from other Cubes
With multidimensional data, several opportunities for further research exist. For example, the study of statistical analysis methods and techniques in the context of data cubes and the definition of specific requirements that would enable automated and massive analyses is a promising area for further research. Also, besides opening data, opening and connecting statistical analyses methods and models will enable gathering, understanding and comparing different statistical methods and/or data proposed for the same phenomenon.
4.
Linked Open Data Technologies
Figure 6: The 5-Star Model (from http://5stardata.info/en/)
LOD is based on the Resource Description Framework (RDF), which suggests that data are organized in triples. RDF data are stored in databases often called RDF stores. The largest LOD single collection is dbpedia, which is the LOD version of Wikipedia. Data in RDF can be processed by applications thus, they are machine understandable. RDF access can be performed using a query language, called SPARQL. For example, using SPARQL we can select from dbpedia the population and area of all European countries. Using LOD facilitates developing applications, visualizing data, and performing statistical or other analyses.
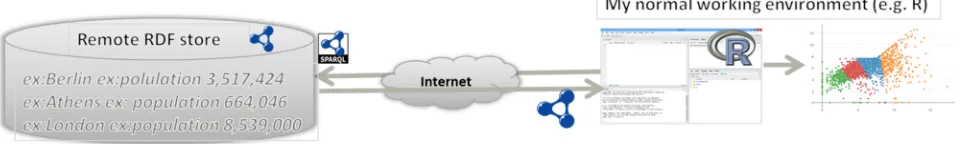
Many programming languages and even applications (e.g., R) have modules to easily handle SPARQL and RDF. Figure 7 suggests that within our normal working application (which can be the R environment for performing statistical analyses) we can use SPARQL to access remote RDF stores. The results are transferred back in RDF but can be easily transformed to any format needed for further analysis.
Figure 7: Accessing an RDF Store from within R Environment
Figure 8: Accessing Multiple RDF Stores from within R Environment
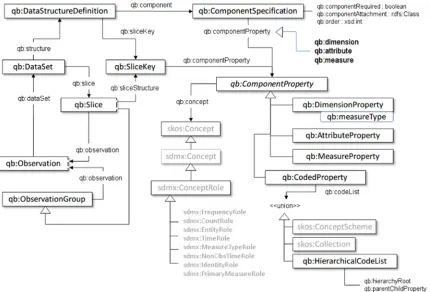
To facilitate modelling multidimensional data as RDF graphs, W3C has proposed the RDF Data Cube Vocabulary (in short RDF qb) presented in Figure 9 (Cyganiak & Reynolds, 2013). Following this standard enables structuring linked open data in data cubes.
Figure 9: The W3C RDF qb Vocabulary
5.
Multidimensional Linked Open Data Process
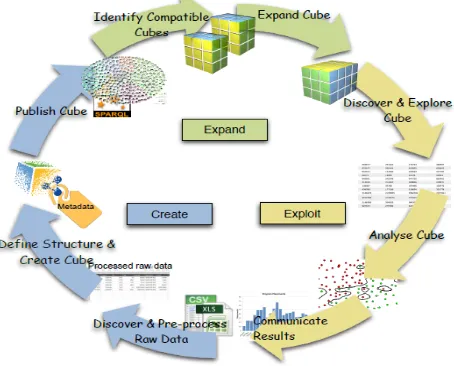
process that is divided into three phases: create, expand and exploit (or consume) (E. Tambouris et al., 2015b). The process prescribes the steps that raw data should go through in order to create value.
Figure 10: Statistical Open Data Process (from E. Tambouris et al., 2015b)
Following this process, data producers can transform their raw data into RDF data cubes. In addition, they need to link their concepts (e.g., measures) with the same concepts in other OGD portals or elsewhere. In addition, data consumers can now more easily find, visualize, merge and analyze data. It is however acknowledged that this process provides a first only step towards institutionalizing the use of multidimensional linked open data. Current processes used in statistical offices and other publishers need to be thoroughly examined and understood. In addition, relevant policies need to be established and implemented.
6.
Multidimensional Linked Open Data Tools
During the last decade a small number of research projects investigated linked open statistical data. As a result, a number of relevant tools have been developed. These include tools for both publishing and consuming multidimensional linked open data (e.g., Kalampokis et al., 2016). In this section, we present some of the tools developed within the research project OpenCube (opencube-project.eu), which was funded by the European Commission under the 7th Framework Programme (E. Tambouris et al., 2015a). These tools are currently further elaborated within the research project OpenGovIntelligence (www.opengovintelligence.eu) also funded by the European Commission under the Horizon 2020 research programme.
Figure 11: OLAP Browser for Consuming Multidimensional Linked Open Data
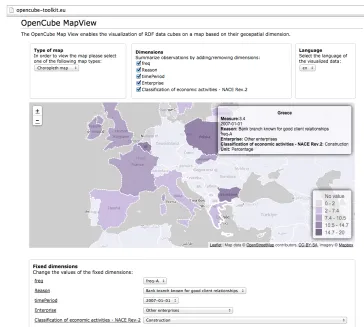
Figure 12 presents the OpenCube MapView tool that can be used for exploiting data. More specifically, MapView enables the visualization of multidimensional linked open data cubes on a map. MapView supports Markers, Bubble and Choropleth maps.
Despite the progress however there are still many technical challenges for exploiting the full potential of linked open data for publishing and reusing statistical open data. Additional work is needed in areas such as metadata for data discovery, vocabularies, code lists, concept schemes and classifications, typed links (e.g., olws:sameAs) between dimensions definitions, values of dimensions and categories of measure.
7.
Conclusions
A large number of organizations provide open data for free reuse. However, obtaining benefits from open data is not straightforward. In this paper, we concentrate on numerical open data that concern statistics in a broad sense (i.e., not only official statistics).
We claim that statistical data can be modeled using the data cube model. In addition, we suggest that linked open data technologies can provide the necessary technological infrastructure to overcome the data fragmentation challenge and thus achieve seamless data integration.
In this context, we outline a process that can be used for publishing, expanding and consuming statistical open data. We further present some tools that have been developed to facilitate data visualization and analysis. These tools capitalize on the data cube model and linked open data technologies. We claim that the use of these technologies can provide significant benefits. At the same time, we acknowledge that there are many challenges including technological, organizational and strategic ones. Further research is needed in all these areas and several relevant research projects are currently under way, such as the Horizon2020 OpenGovIntelligence project. In this project, frameworks and technologies will be developed. In addition, pilots are planned in six countries where government authorities will co-provide innovative, data-driven public services to citizens, businesses and public authorities by exploiting multidimensional linked open data.
References
Agrawal, R., & Gupta A., & Sarawagi, S., (1977) Modeling Multidimensional Databases, Proc. 13th Int’l Conf. Data Eng. , 232–243.
Attard, J., & Orlandi, F., & Scerri, S., & Auer, S., (2015) A systematic review of open government data initiatives. Government Information Quarterly, 32(4), 399-418.
Codd, E., & Codd, S., & Salley, C., (1993) Providing OLAP (On-line Analytical Processing) to
User-analysts: An IT Mandate. Codd & Associates.
Cyganiak, R., & Reynolds, D., (2013) The RDF Data Cube vocabulary, Available at http://www.w3.org/TR/vocab-data-cube/
European Commission, (2014) Guidelines on Recommended Standard Licenses, Datasets and Charging for the Reuse
of Documents, C240/1.
Kalampokis, Ε., & Tambouris, Ε., & Karamanou, A., & Tarabanis, Κ., (2016). Open Statistics: The Rise of a new
Era for Open Data?, In: J. Scholl et al. (Eds): EGOV2016, LNCS 9820, 31-43.
Kalampokis, Ε., & Tambouris, Ε., & Tarabanis, Κ., (2011a) A Classification Scheme for Open Government Data:
Towards Linking Decentralized Data, International Journal of Web Engineering and Technology, 6 (3),
266-285.
Kalampokis, Ε., & Tambouris, Ε., & Tarabanis, Κ., (2011b) Open Government Data: A Stage Model, M. Janssen et al. (Eds): EGOV2011, LNCS 6846, 235-246
Kalampokis, Ε., & Tambouris, Ε., & Tarabanis, Κ., (2013) Understanding the Predictive Power of Social Media, Internet Research, 23 (5), pp. 544-559.
Kalampokis, Ε., & Tambouris, Ε., & Tarabanis, Κ., (2016) Linked Open Cube Analytics Systems: Potential and
Challenges, IEEE Intelligent Systems, 31 (5), 89-92
Janssen, M., & Charalabidis, Y., & Zuiderwijk, A. (2012) Benefits, Adoption Barriers and Myths of Open
Data and Open Government, Information Systems Management, 29 (4), 258-268.
Tambouris, Ε., & Kalampokis, Ε., & Tarabanis, Κ., (2015a) ICT Tools for statistical linked open data: The
OpenCube toolkit, Proc. of the New Techniques and Technologies for Statistics Conference (NTTS2015).
Proceedings available from http://ec.europa.eu/eurostat/cros/content/ntts-2015-proceedings.
Tambouris, Ε., & Kalampokis, Ε., & Tarabanis, Κ., (2015b) Processing Linked Open Data Cubes, E. Tambouris, M. Janssen, H. J. Scholl, M. Wimmer, K. Tarabanis, M. Gascó, B. Klievink, I. Lindgren, and P. Parycek (Eds.): EGOV2015, LNCS 9248, pp.130-143.
About the Author
Efthimios Tambouris