Introduction
Corn (Zea mays L.) is the main energy source in diets for intensively reared avian species (broilers and ducks), therefore accurate information on its effective energy content is of importance to nutritionists. A number of studies have been conducted to estimate the metabolizable energy (ME) content of corn based on its physical characteristics and chemical composition
(e.g.Leeson et al., 1993; Zhao et al., 2008). The energy content of feedstuffs depends strongly on their chemical composition. Nutritionists are interested in using models that predict the nutritive value of poultry feedstuffs accurately. Recently, artif icial neural network (ANN) models have received attention among poultry nutritionists, e.g. for estimating the ME of poultry offal meal (Ahmadi et al., 2008) and sorghum grain (Sedghi et al., 2011) based on their chemical
Predicting the metabolizable energy content of corn for ducks:
a comparison of support vector regression with other methods
A. Faridi
1*, A. Golian
1, M. Mottaghitalab
2, S. López
3and J. France
41Centre of Excellence in the Animal Sciences Department. Ferdowsi University of Mashhad. Mashhad, 91775-1163 Iran
2Department of Animal Science. Faculty of Agricultural Science. University of Guilan. P.O. Box 41635-1314. Rasht, Iran
3Instituto de Ganadería de Montaña (CSIC-ULE). Departamento de Producción Animal. Universidad de León. 24071 León, Spain
4Centre for Nutrition Modelling. Department of Animal & Poultry Science. University of Guelph. Ontario N1G 2W1, Canada
Abstract
Support vector regression (SVR) is used in this study to develop models to estimate apparent metabolizable energy (AME), AME corrected for nitrogen (AMEn), true metabolizable energy (TME), and TME corrected for nitrogen
(TMEn) contents of corn fed to ducks based on its chemical composition. Performance of the SVR models was assessed
by comparing their results with those of artificial neural network (ANN) and multiple linear regression (MLR) models. The input variables to estimate metabolizable energy content (MJ kg–1) of corn were crude protein, ether extract, crude
fibre, and ash (g kg–1). Goodness of fit of the models was examined using R2, mean square error, and bias. Based on
these indices, the predictive performance of the SVR, ANN, and MLR models was acceptable. Comparison of models indicated that performance of SVR (in terms of R2) on the full data set (0.937 for AME, 0.954 for AME
n, 0.860 for
TME, and 0.937 for TMEn) was better than that of ANN (0.907 for AME, 0.922 for AMEn, 0.744 for TME, and 0.920
for TMEn) and MLR (0.887 for AME, 0.903 for AMEn, 0.704 for TME, and 0.902 for TMEn). Similar findings were
observed with the calibration and testing data sets. These results suggest SVR models are a promising tool for modelling the relationship between chemical composition and metabolizable energy of feedstuffs for poultry. Although from the present results the application of SVR models seems encouraging, the use of such models in other areas of animal nutrition needs to be evaluated.
Additional key words: maize; poultry; nutritive value; chemical composition; artificial neural network; multiple
linear regression.
* Corresponding author: [email protected] Received: 20-03-13. Accepted: 12-11-13
Abbreviations used: AME (apparent metabolizable energy); AMEn(apparent metabolizable energy corrected for nitrogen); ANN
(artificial neural network); CF (crude fibre); CP (crude protein); EE (ether extract); ME (metabolizable energy); MLR (multiple linear regression); SVM (support vector machine); SVR (support vector regression); TME (true metabolizable energy); TMEn(true
composition. However, despite the ability of ANN models to handle complex nonlinear problems (Faridi et al., 2012a), this approach is not necessarily simple and may provide an apparently good fit to the data-set from which predictive equations are derived, but a poor predictive performance on newly introduced data.
Support vector machines (SVM), i.e.supervised learning models with associated learning algorithms, can be used for classification, regression or other tasks (Cortes & Vapnik, 1995; Vapnik et al., 1997). In recent years, they have been introduced as a new technique for solving a variety of learning, classif ication and prediction problems (Cristianini & Shawe-Taylor, 2000). Support vector regression (SVR), the regression version of SVM, was developed to estimate regression functions (Drucker et al., 1997) and similar to SVM, it is capable of solving non-linear problems (Nandi et al., 2004). SVR models have been successfully applied across a broad range of areas in engineering, science and economics (e.g.Kara et al., 2011) but, to our knowledge, application to animal nutrition studies has not been investigated. Therefore, the objectives of this study were 1) to test the ability of SVR models to estimate apparent ME (AME), apparent ME corrected for nitrogen (AMEn), true ME (TME), and true ME corrected for nitrogen (TMEn) of corn for ducks based on its chemical composition, and 2) to compare the predictive performance of SVR to that of ANN and multiple linear regression (MLR) models.
Material and methods
Data sources
Data used to develop the SVR and ANN models for AME, AMEn, and TMEnwere taken from Zhao et al. (2008), and information reported by Zhao et al.(2008) and Zhou et al.(2010) was used to develop the TME prediction models. There were 36 records of observations for AME, AMEnand TMEnand 42 for TME. For AME, AMEn, and TMEn, the models investigated (SVR, ANN, and MLR) used 27 randomly selected observations for calibration, and the remainder (n= 9) as the testing data set, whereas for TME, 29 and 13 randomly selected records were used for calibration and testing, respectively. Ranges on the data used to develop the SVR and ANN models for AME, AMEn, TME, and TMEnare presented in Table 1. Quantitative examination of the predictions pro-duced was made using R2(amount of variance of the dependent variable explained or accounted for by the model), mean square error, and bias.
Support vector regression model
development
As SVM is a non-parametric statistical learning technique, no assumptions about the underlying data
Table 1. Ranges of the data used to develop support vector regression, artificial neural network, and multiple linear regression
models to estimate metabolizable energy (AME: apparent metabolizable energy, AMEn: apparent ME corrected for nitrogen,
TME: true ME, TMEn: true ME corrected for nitrogen) of corn for ducks
Model
Input variable (g kg–1)
Output
Crude protein Ether extract Crude fibre Ash (MJ kg–1)
AME (n= 36) Range 81-130 23-53 11-37 8-22 13.4-16.1 Mean (SD) 100.2 (11.6) 38.7 (6.8) 24.8 (7.6) 12.4 (2.3) 14.8 (0.68) AMEn(n= 36) Range 81-130 23-53 11-37 8-22 13.2-15.8 Mean (SD) 100.2 (11.6) 38.7 (6.8) 24.8 (7.6) 12.4 (2.3) 14.5 (0.69) TME (n= 42) Range 81-130 33-53 11-37 8-22 14.6-17.2 Mean (SD) 98.4 (11.7) 39.6 (6.8) 24.0 (7.4) 12.9 (2.6) 15.9 (0.67) TMEn(n= 36) Range 81-130 23-53 11-37 8-22 13.9-16.5 Mean (SD) 100.2 (11.6) 38.7 (6.8) 24.8 (7.6) 12.4 (2.3) 15.2 (0.68)
distribution are required (Cristianini & Shawe-Taylor, 2000). The SVM formulation, which follows the principle of structural risk minimization, has been demonstrated to be superior to the empirical risk minimization principle employed by conventional ANN models (Yang & Shieh, 2010). Structural risk minimization minimizes the upper bound on the expected error whereas ANN minimizes the error on the calibration data set. This difference gives SVM greater ability to generalize, which is the goal of statistical learning (Vapnik, 1995). The basic idea in SVR is to map the input data onto a higher dimensional plane via nonlinear mapping. A linear regression problem is then obtained and solved in this space (Scholkopf & Smola, 2002). A kernel function is introduced to make the support vector algorithm nonlinear. The algorithm performs the regression estimation by risk minimization where risk is measured by a loss function (for details see Vapnik et al., 1997). Before calibrating the SVR models, the type of kernel function needs to be chosen and three parameters (υ, C, and ε) need to be determined. The
υ is the kernel parameter, C is the regularization parameter, and εis the radius of a tube within which the regression function must lie after the successful learning. Parameter εis the accepted deviation (error) between observed and predicted values in the ε -insensitive loss function. If the predicted value is within the ε-tube, the loss is zero. If the predicted value is outside the tube, the loss equals the magnitude of the difference between the predicted value and the radius ε of the tube. Therefore, ε is a precision parameter representing the radius of the tube located around the regression function, and the region enclosed by the tube is known as ε-intensive zone (Lahiri & Ghanta, 2008). These three parameters may be set empirically by the user. A detailed explanation of kernel functions and parameters can be found in Cheng et al.(2011).
To use all the data for calibration and testing, a subset-swapping method is commonly applied (Cristianini & Shawe-Taylor, 2000). This technique is known as cross-validation, the statistical practice of partitioning a data sample into subsets such that the analysis is initially performed on a single subset, while the other subset(s) are retained for subsequent use in conf irming and validating the initial analysis. The technique estimates the generalization error of a given model and uses all the data to construct and test the model (Witten et al.,2011). In this study, we used a
10-fold cross-validation algorithm to f ind the best value of the SVR free parameters. The 10-fold cross validation procedure splits the calibration data set equally into 10 smaller subsets. During each fold of the calibration stage, every subset is used as the testing data set once and the remaining sets are used for calibration. The total number of misclassified samples is accumulated to compute f inal accuracy. This algorithm is provided in the software Statistica (StatSoft, 2009). There are several kernels that can be used for SVM model construction including linear, polynomial, radial basis function and sigmoid. Radial basis function is by far the most popular choice of kernel type (StatSoft, 2009). Since SVR only deals with one output at a time, one prediction model must be constructed for each objective. In this study, therefore, four SVR models were constructed to estimate the AME, AMEn, TME, and TMEn(MJ kg–1) of corn fed to ducks. The variables of interest for constructing the models were crude protein (CP), ether extract (EE), crude fibre (CF), and ash (g kg–1). Two different random data groups (calibration and testing sets) were used to develop the models. Statistica Machine Learning version 8.0 was used to construct, calibrate and validate the SVR models (StatSoft, 2009). The conf iguration of each SVR model developed is summarized in Table 2.
Artificial neural network model development
In this study, feed-forward multilayer perceptron models (the most common type of ANN model) were constructed to estimate AME, AMEn, TME, and TMEn (a separate model for each variable). The configuration of all the models developed consisted of one hidden layer, and the hyperbolic tangent and identity were employed as activation functions in hidden and output units, respectively. The quasi-Newton method with 400 cycles was used as the calibration algorithm while the hidden and output weight decays were set at default values of 0.001 and 0.0001, respectively. The number of hidden neurons was determined using a trial and error method to achieve best predictive performance in both the calibration and testing sets. The network randomization was set to normal with mean and variance of 0 and 0.1, respectively. This option specifies how the weights should be initialized at the beginning of the calibration process (Faridi et al., 2012b). Statistica Neural Networks version 8.0
software was used to construct and calibrate the ANN models (StatSoft, 2009). The calibration and testing data sets used for the ANN models were the same as those used to develop the SVR models.
Multiple linear regression model
development
MLR models were constructed to estimate AME, AMEn, TME, and TMEnand compared with the SVR and ANN models. The data investigated were subjected to MLR analysis using the REG procedure of SAS (2003). All the input variables (CP, EE, CF, and ash) were considered in developing the MLR models. The models were developed on the same calibration data set used for the SVR and ANN models, and the testing data were used to evaluate their performance.
Results and discussion
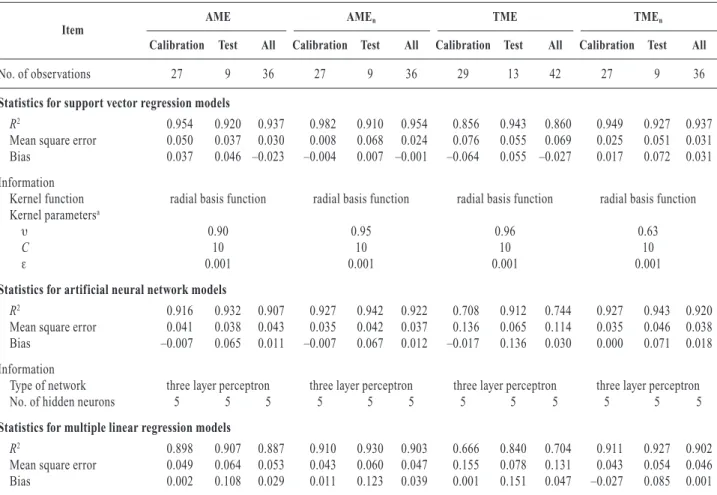
Predictive ability of the SVR models and their conf iguration (kernel function and parameters) are summarized in Table 2. Results for the ANN and MLR models are also shown in Table 2. R2values for the SVR models ranged from 0.856 to 0.982 compared with 0.708 to 0.943 and 0.666 to 0.930 for the ANN and MLR models, respectively. The MLR equations to estimate metabolizable energy from chemical compo-sition (CF, CP, EE and ash) are shown in Table 3. The parameter estimates and variance inflation factor (VIF) for the MLR models are summarized in Table 3. VIF is a common measure of multi-collinearity. Observed, predicted, and residual values for TME of the mo-dels investigated are shown in Table 4. Only results for the TME models are reported owing to limitations of space.
Table 2. Statistics and information on support vector regression, artificial neural network, and multiple linear regression
models developed to estimate metabolizable energy (AME: apparent metabolizable energy, AMEn: apparent ME corrected
for nitrogen, TME: true ME, TMEn: true ME corrected for nitrogen) of corn for ducks
Item
AME
I AMEn I TME I TMEn
Calibration Test All Calibration Test All Calibration Test All Calibration Test All
No. of observations 27 9 36 27 9 36 29 13 42 27 9 36
Statistics for support vector regression models
R2 0.954 0.920 0.937 0.982 0.910 0.954 0.856 0.943 0.860 0.949 0.927 0.937
Mean square error 0.050 0.037 0.030 0.008 0.068 0.024 0.076 0.055 0.069 0.025 0.051 0.031 Bias 0.037 0.046 –0.023 –0.004 0.007 –0.001 –0.064 0.055 –0.027 0.017 0.072 0.031 Information
Kernel function radial basis function radial basis function radial basis function radial basis function Kernel parametersa
υ 0.90 0.95 0.96 0.63
C 10 10 10 10
ε 0.001 0.001 0.001 0.001
Statistics for artificial neural network models
R2 0.916 0.932 0.907 0.927 0.942 0.922 0.708 0.912 0.744 0.927 0.943 0.920
Mean square error 0.041 0.038 0.043 0.035 0.042 0.037 0.136 0.065 0.114 0.035 0.046 0.038 Bias –0.007 0.065 0.011 –0.007 0.067 0.012 –0.017 0.136 0.030 0.000 0.071 0.018 Information
Type of network three layer perceptron three layer perceptron three layer perceptron three layer perceptron No. of hidden neurons 5 5 5 5 5 5 5 5 5 5 5 5
Statistics for multiple linear regression models
R2 0.898 0.907 0.887 0.910 0.930 0.903 0.666 0.840 0.704 0.911 0.927 0.902
Mean square error 0.049 0.064 0.053 0.043 0.060 0.047 0.155 0.078 0.131 0.043 0.054 0.046 Bias 0.002 0.108 0.029 0.011 0.123 0.039 0.001 0.151 0.047 –0.027 0.085 0.001
In this paper, the machine learning approach SVR is introduced and used to develop models for estimating the ME of corn for ducks based on its chemical composition. The motivation for this study is threefold. First, SVR is not so well-known as other alternatives (e.g.conventional statistical methods of MLR and ANN) in the field of animal nutrition. Se-cond, its performance seems well-suited to problems in poultry nutrition yet no reference information is available in the literature. Third, determination of ME of poultry feedstuffs can be an expensive and time-consuming task. Therefore, developing flexible efficient models to estimate the ME of feedstuffs is of primary interest to nutritionists.
Although SVR models have shown excellent generalization performance, a problem that faces the user of the technique is how to choose a kernel and specify its parameters. In our study, radial basis function was used as the kernel function as it tends to
give better performance. In order to conduct the present study, four SVR, four ANN, and four MLR models were developed to estimate the AME, AMEn, TME, and TMEnof corn for ducks. Model performance was assessed after generating output by the models. Previous studies have shown the ability of ANN to estimate the TMEnof poultry feedstuffs based on their chemical composition (Ahmadi et al., 2008; Sedghi et al., 2011). The results of our study reveal that the SVR approach offers a competitive alternative to existing powerful ANN models. Comparison of the predictive ability of SVR, ANN and MLR showed that the performance of SVR (in terms of R2) on the whole data set was greater than that of both ANN and MLR. The same f indings were obtained for the calibra-tion data set, where the goodness-of-fit attained with SVR was greater than that with ANN and MLR. However, the results were different for the testing set. Predictive ability of SVR was less than (AMEn, AME,
Table 3.Variable estimates and variance inflation factor of multiple linear regression models developed
to estimate metabolizable energy (AME: apparent metabolizable energy, AMEn: apparent ME corrected
for nitrogen, TME: true ME, TMEn: true ME corrected for nitrogen) of corn for ducks
Entitya Estimate SEb t-value p-value Tolerance VIFc
AME Intercept 16.608 0.649 25.57 <0.001 — 0,000 CF –0.935 0.084 –11.11 <0.001 0.576 1.734 CP 0.015 0.054 0.29 <0.773 0.737 1.357 EE 0.0101 0.098 1.03 <0.314 0.581 1.721 Ash –0.064 0.246 –0.30 <0.767 0.581 1.722 AMEn Intercept 16.547 0.606 27.28 <0.001 — 0,000 CF –0.918 0.078 –11.68 <0.001 0.576 1.734 CP –0.014 0.049 –0.29 <0.773 0.737 1.357 EE 0.101 0.091 1.11 <0.281 0.581 1.721 Ash –0.030 0.230 –0.13 <0.896 0.581 1.722 TME Intercept 17.215 0.990 17.39 <0.001 — 0,000 CF –0.779 0.163 –4.77 <0.001 0.433 2.307 CP 0.064 0.079 0.82 <0.422 0.630 1.586 EE –0.052 0.183 –0.28 <0.780 0.477 2.097 Ash 0.051 0.448 0.11 <0.910 0.408 2.448 TMEn Intercept 17.293 0.605 28.55 <0.001 — 0,000 CF –0.916 0.078 –11.66 <0.001 0.576 1.734 CP –0.016 0.049 –0.32 <0.752 0.737 1.357 EE 0.102 0.091 1.12 <0.277 0.581 1.721 Ash –0.400 0.229 –0.18 <0.862 0.581 1.722
and TMEn), or greater than (TME) that of ANN. Accu-racy of SVR for the testing set was less than (AMEn), close to (TMEn) or greater than (AME and TME) that of MLR.
These results reveal that SVR models are a promising tool for estimating the ME of corn. In this study VIF was calculated to determine the level of correlation among the variables. Usually, values larger
Table 4. Observed, predicted, and residual values of true metabolizable energy (TME, MJ kg–1) based on support
vector regression (SVR), artificial neural network (ANN), and multiple linear regression (MLR) models
Model
Group Observed SVR
I ANN I MLR
Predicted Residual Predicted Residual Predicted Residual
Calibration 16.212 16.213 0.000 16.333 –0.121 16.352 –0.139 Calibration 15.400 15.401 0.000 15.333 0.067 15.418 –0.018 Calibration 14.965 15.181 –0.216 15.148 –0.183 15.104 –0.139 Calibration 15.417 15.417 0.000 15.271 0.146 15.398 0.018 Calibration 17.209 17.209 0.000 17.290 –0.082 16.863 0.345 Calibration 14.555 15.059 –0.504 15.143 –0.588 14.949 –0.394 Calibration 15.794 15.877 –0.083 15.880 –0.086 15.996 –0.202 Calibration 15.668 15.668 0.000 15.662 0.007 15.770 –0.102 Calibration 14.714 15.295 –0.581 15.174 –0.460 15.041 –0.327 Calibration 15.651 15.571 0.081 15.543 0.109 15.592 0.059 Calibration 15.400 15.400 0.000 15.386 0.015 15.148 0.251 Calibration 15.610 15.609 0.001 15.531 0.078 15.590 0.019 Calibration 15.651 15.651 0.000 15.909 –0.258 15.943 –0.292 Calibration 16.024 16.024 0.000 15.736 0.288 15.687 0.336 Calibration 15.409 15.164 0.245 15.208 0.201 15.074 0.334 Calibration 15.744 15.695 0.048 15.616 0.127 15.586 0.157 Calibration 15.497 15.497 0.000 15.549 –0.052 15.479 0.017 Calibration 15.564 15.273 0.290 15.198 0.365 15.147 0.416 Calibration 15.806 15.807 –0.001 15.731 0.076 15.812 –0.006 Calibration 15.430 15.676 –0.246 15.688 –0.258 15.781 –0.352 Calibration 16.648 16.647 0.001 16.415 0.232 16.447 0.200 Calibration 16.417 16.417 0.001 16.359 0.058 16.426 –0.009 Calibration 17.104 16.895 0.209 16.671 0.433 16.666 0.437 Calibration 16.870 16.870 0.000 16.576 0.294 16.593 0.276 Calibration 17.083 17.083 0.000 16.925 0.158 16.754 0.328 Calibration 16.078 16.156 –0.078 16.163 –0.084 16.222 –0.144 Calibration 16.309 16.191 0.117 15.577 0.732 15.495 0.813 Calibration 15.869 15.869 0.000 16.220 –0.351 16.291 –0.422 Calibration 14.818 15.948 –1.129 16.181 –1.363 16.253 –1.435 Test 15.991 15.959 0.031 15.925 0.066 16.046 –0.055 Test 14.793 15.107 –0.314 15.011 –0.218 14.795 –0.002 Test 15.522 15.601 –0.080 15.181 0.340 14.994 0.527 Test 15.982 15.850 0.132 15.865 0.117 15.924 0.057 Test 15.584 15.762 –0.178 15.733 –0.149 15.857 –0.273 Test 15.769 15.722 0.046 15.702 0.067 15.516 0.252 Test 15.442 15.793 –0.350 15.638 –0.196 15.612 –0.170 Test 15.991 15.953 0.038 15.856 0.135 15.822 0.168 Test 16.459 16.170 0.290 16.145 0.315 16.151 0.308 Test 16.489 16.240 0.249 16.369 0.120 16.422 0.066 Test 17.146 16.782 0.364 16.650 0.495 16.620 0.525 Test 16.535 16.159 0.376 16.237 0.298 16.309 0.225 Test 16.480 16.367 0.113 16.106 0.374 16.151 0.328
than 10 suggest that multi-collinearity might be causing estimation problems (Chatterjee et al., 2000). Variables with VIF > 10 should be eliminated or utilized in separate models or both. However, in this study, severe multi-collinearity was not observed among the variables (Table 3). Our results indicated that, in the MLR models, crude fibre was negatively correlated with AME, AMEn, TME, and TMEn, while regression coefficients for CP, EE, and ash were not statistically significant (Table 3). The same findings were reported by Zhao et al.(2008). SVR models are known as universal approximations of any function to a desired degree of accuracy (Kecman, 2005). SVM and SVR models are particularly appealing due to their ability to handle small data sets successfully, often producing better classification or predictive accuracy than traditional methods (Mantero et al., 2005). However, it is worth pointing out that SVR like ANN are highly data-based models, and therefore the use of different data sets is required to prove the effectiveness of SVR in poultry and animal nutrition generally.
In summary, metabolizable energy content of corn for ducks can be predicted from chemical composition with a high degree of accuracy using SVR models, with a statistical performance comparable to or better than that attained with other approaches (ANN or MLR). The SVR approach offers a promising alternative to ANN and MLR in poultry nutrition to predict the energy value of feedstuffs from chemical composition. Although the application of SVR in this study was promising, further evaluation of this methodology in other areas of animal nutrition is suggested.
Acknowledgements
Funding, in part, was provided by the Canada Re-search Chairs program.
References
Ahmadi H, Golian A, Mottaghitalab M, Narimanzadeh N, 2008. Prediction model for true metabolizable energy of feather meal and poultry offal meal using group method of data handling-type neural network. Poultry Sci 87: 1909-1912.
Chatterjee S, Hadi AS, Price B, 2000. Regression analysis by example, 3rded. John Wiley & Sons Inc, NY, USA.
Cheng CS, Chen PW, Huang KK, 2011. Estimating the shift size in the process mean with support vector regression
and neural networks. Expert Syst Appl 38: 10624-10630. Cortes C, Vapnik V, 1995. Support vector networks. Mach
Learn 20: 273-297.
Cristianini N, Shawe-Taylor J, 2000. Introduction to support vector machines and other kernel-based learning methods. Cambridge Univ Press, Cambridge, UK.
Drucker H, Burges CJC, Kaufman L, Smola A, Vapnik V, 1997. Support vector regression machines. In: Advances in neural information processing systems, vol. 9 (Mozer MC, Jordan MI, Petsche T, eds). MIT Press, Cambridge, MA, USA. pp: 155-161.
Faridi A, Mottaghitalab M, Ahmadi A, 2012a. Sensitivity analysis of an early egg production predictive model in broiler breeders based on dietary nutrient intake. J Agric Sci 150: 87-93.
Faridi A, Golian A, Ahmadi A, 2012b. Comparison of responses to dietary protein and lysine in broiler chicks reared before and after 2000 via neural network models. J Agric Sci 150: 775-786.
Kara Y, Boyacioglu MA, Baykan ÖK, 2011. Predicting direction of stock price index movement using artificial neural networks and support vector machines: the sample of the Istanbul Stock Exchange. Expert Syst Appl 38: 5311-5319. Kecman V, 2005. Support vector machines – an introduction. In: Support vector machines: theory and applications (Wang L, ed). Springer-Verlag, Berlin-Heidelberg-NY. pp: 1-48.
Lahiri SK, Ghanta KC, 2008. Prediction of pressure drop of slurry flow in pipeline by hybrid support vector regression and genetic algorithm model. Chinese J Chem Eng 16: 841-848.
Leeson S, Yersin A, Volker L, 1993. Nutritive value of the 1992 corn crop. J Appl Poultry Res 2: 208-213.
Mantero P, Moser G, Serpico SB, 2005. Partially supervised classif ication of remote sensing images through SVM-based probability density estimation. IEEE T Geosci Remote Sens 43: 559-570.
Nandi S, Badhe Y, Lonari J, Sridevi U, Rao BS, Tambe SS, Kulkarni BD, 2004. Hybrid process modeling and opti-mization strategies integrating neural networks/support vector regression and genetic algorithms: study of ben-zene isopropylation on Hbeta catalyst. Chem Eng J 97: 115-129.
SAS, 2003. SAS/STAT software, version 9. SAS Institute Inc, Cary, NC, USA.
Scholkopf B, Smola AJ, 2002. Learning with kernels. MIT Press, Boston, MA, USA.
Sedghi M, Ebadi MR, Golian A, Ahmadi H, 2011. Estimation and modeling true metabolizable energy of sorghum grain for poultry. Poultry Sci 90: 1138-1143.
StatSoft, 2009. Statistica data analysis software system, vers 7.1. StatSoft Inc, Tulsa, OK, USA.
Vapnik VN, 1995. The nature of statistical learning theory. Springer, NY, USA.
Vapnik VN, Golowich S, Smola A, 1997. Support vector method for function approximation, regression estima-tion and signal processing. In: Advance in neural information processing system, vol. 9 (Mozer M, Jordan
M, Petsche, T. eds). MIT Press, Cambridge, MA, USA. pp: 281-287.
Witten IH, Frank E, Hall MA, 2011. Data mining, practical machine learning tools and techniques, 3rded. Morgan
Kaufmann, San Francisco, CA, USA.
Yang CC, Shieh MD, 2010. A support vector regression based prediction model of affective responses for product form design. Comput Ind Eng 59: 682-689.
Zhao F, Zhang HF, Hou SS, Zhang ZY, 2008. Predicting metabolizable energy of normal corn from its chemical composition in adult Pekin ducks. Poultry Sci 87: 1603-1608.
Zhou Z, Wan HF, Li Y, Chen W, Qi ZL, Peng P, Peng J, 2010. The influence of the amylopectin/amylose ratio in samples of corn on the true metabolizable energy value for ducks. Anim Feed Sci Technol 157: 99-103.