www.tinyurl.com/ajeee-adbu | ISSN: 2582-0257 Page | 20
Smart Vehicle System using Arduino
Parveen Kaur
1, Animesh Das
2, Manash P. Borah
3, Smriti Dey
41,2,3,4 Department of Electrical and Electronics Engineering, School of Technology, Assam Don Bosco University Airport Road, Azara, Guwahati-781017, Assam, INDIA
1
[email protected], [email protected], [email protected], [email protected]*
Abstract: Transportation is a basic need of society and with the increasing population; indirectly there is an increase in the vehicle density, which may lead to many road accidents resulting in injuries and sometimes lead to death. To prevent this particularly, a system has been designed for accident location detection, accident prevention due to the upper issue of the dipper and anti-collision system. In this system, the shock sensor, ultrasonic sensor and temperature sensor are used as an input to the system along with GPS and GSM for real-time analysis and corresponding responses are analyzed; if any hazard occurs, the processing unit (Arduino) will take the appropriate action.
Keywords: Arduino; GSM; GPS; Shock sensor; Temperature sensor; Ultrasonic sensor.
1.
Introduction
In the proposed project, accident location detection system, anti-collision system and accident prevention due to the upper issue are incorporated. In the accident location detection system, if any hazard occurs, a message containing the location of the accident is sent to the reference contact who can take necessary steps to control the situation. The execution of the system is simple as it makes use of GSM and GPS technologies. GPS takes the coordinates of the site of the accident and GSM sends the coordinates to the reference contact. All the controls are made using Arduino as it is the main control unit of the system.
The Arduino-based collision detection system is a kind of system that is the fastest growing safety feature in the automotive industries. Such a system enables vehicles to identify the chances of collision and give visual and audio warning to the driver so that the driver can take necessary action to avoid a collision. For the implementation of this system, the ultrasonic sensor is used to provide the estimation of the distance between two vehicles.
While driving it is always recommended to use the dipper more often, and the upper should be used only if necessary. The reason is that while driving at night, visibility is low on roads without streetlights and to counter these, the drivers tend to use upper, which also means high beam. The car headlight bulb has two modes high beam and low beam, also known as upper and lower. On low beam, the reach of the light is less and the
brightness is also low, but sufficient to drive with. Whereas, in upper or high beam, the light is much more intense and the reach is much better as the light is projected at a higher height, which affects the car drivers coming from the opposite direction. This can cause them to have poor visibility because of the excess light hitting their eyes. This generally leads to too many road accidents, in order to eliminate this problem accident prevent due to upper issue is designed.
2.
System Design
2.1 Block Diagram
The block diagram of the system can be represented as:
Figure 1: Block Diagram
The input block comprises of the vibration sensor, temperature sensor, ultrasonic sensor and GPS, which provides the digital input to the Arduino. The vibration sensor i.e. SW420 is used for detecting the shock whose sensitivity can be adjusted using the potentiometer on the board, the temperature sensor is used for keeping track of temperature, and the ultrasonic sensor is used to sense the distance between the vehicles. The GPS provides the input location to Arduino in latitudes and longitudes to track the real-time location. Open Access. Copyright ©Authors(s) and AJEEE. Distributed under Creative Commons Attribution 4.0 International License (CC-BY). Article history: Received: 1 March 2019 and Accepted: 10 April 2019.
Kaur et al., AJEEE, ISSN: 2582-0257, Vol. 3, Issue 1, May 2019, pp. 20-25 | Page | 21 The processing block comprises of
Arduino, which acts as the main brain to the system. It accepts the input, i.e. from the vibration sensor, temperature sensor, ultrasonic sensor and GPS and processes the data according to the requirements and provides the necessary action. The output block comprises of the LCD, buzzer, GSM. Depending upon the output received from the Arduino, the different units of the output block will be triggered.
2.2 Circuit Operation
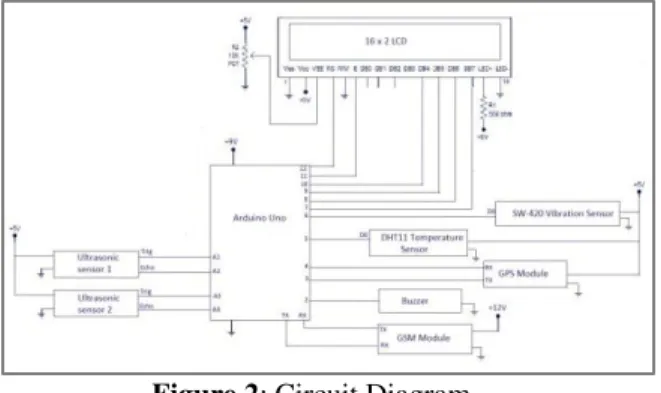
The circuit diagram shown is the feasible diagram for this project.
Figure 2: Circuit Diagram
Here the digital output pin of the vibration sensor and temperature sensor is connected to the digital input pin-6 and pin-5 respectively of the Arduino. The Vcc of the sensor is connected to +5V supply from the Arduino and ground pin common with Arduino. The RX (receiver) pin and TX (transmitter) pin of the GPS module is connected to pin 4 and 3 of the Arduino respectively. The GPS is power by +5V supply from the Arduino. The RX and TX pin of the GSM module is connected to the TX and RX pin of the Arduino. The GSM module requires a power supply of +12V, which will be provided by using the adaptor. The buzzer is connected to A1 pin of the Arduino. The RS pin of the LCD module is connected to digital pin 12 of the Arduino. R/W pin of the LCD is grounded. Enable pin of the LCD module is connected to digital pin 11 of the Arduino.
In this project, theLCD module and Arduino are interfaced in the 4-bit mode. This means only four of the digital input lines (DB4 to DB7) of the LCD are used. Digital lines DB4, DB5, DB6 and DB7 are interfaced to digital pins 10, 9, 8 and 7 of the Arduino. The 10K potentiometer is used for adjusting the contrast of the display. 560 ohm resistor R1 limits the current through the backlight LED. The Arduino can be powered through the external power jack provided on the board. A +5V supply required in some other parts of the circuit can be tapped from the 5V
source on the Arduino board. The ultrasonic sensor is powered using +5V supply from Arduino, have a common ground. The Trig and Echo pins of the ultrasonic sensor are connected to the pins, as shown in the circuit diagram. The Arduino can also be powered from the PC through the USB port.
2.3 List of Components
We have designed a system using the given components listed below. The system was designed to keep the cost at a bare minimum as well as efficient in performance. Here we tried to design the system, which is simple yet compact.
Table1: List of components
Sl. No.
Components Specification Quantity
1. Arduino Board Uno 1
2. GPS --- 1 3. GSM 800 1 4. Vibration Sensor SW420 1 5. Temperature Sensor DHT11 1 6. Ultrasonic Sensor --- 2 7. Buzzer ---- 1
8. LEDs Yellow, Red, Blue 1(each) 9. Resistor 470Ω, 1K (pot) 1(each) 10. Adaptor 12V 1 2.4 Flow Charts
2.4.1 Flow Chart for Accident Location Detection System
The flow chart for the accident location Detection system is shown below in Figure 3(a).
Kaur et al., AJEEE, ISSN: 2582-0257, Vol. 3, Issue 1, May 2019, pp. 20-25 | Page | 22 According to the flow chart, the code
instructions will be as follows:
1. We will initialise the input pins, output pins and the variables that will be used to store data at different intermediate steps.
2. After the initialization phase is over, there will be a message displayed on the LCD (System ready).
3. Then the system starts reading data from the sensors. The data reading from the sensors is done using the polling technique.
4. After fetching the input from the vibration sensor, the value is first compared with the threshold value of the vibration sensor, if the condition is true, i.e. vibration sensor reading is greater than the threshold value then it will go to next step or else it will go to step 8.
5. It will display “Are you safe?” on the LCD for a certain period of time, if the driver is under the condition to take action by themselves then he/she can press the reset button within the appropriate time delay, the system will reboot, and no action will be taken.
6. If the driver fails to press the reset button within the appropriate delay, then after the delay automatically the buzzer and GSM will be triggered.
7. To stop the buzzer, the system has to be rebooted by pressing the reset button.
8. If the value of the vibration sensor is within the limit, the system then compares the input value of the temperature sensor with the threshold value. If the value of the temperature is higher than the threshold, the buzzer is triggered automatically, and if the value lies below the limit, then it goes back to step 3.
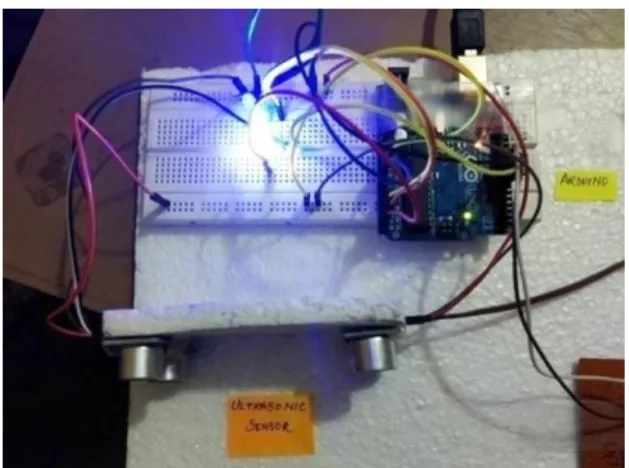
Figure 3(b): Implemented Circuit of Accident Location Detection System
2.4.2 Flow Chart for Anti-collision and Upper Issue of Dipper System
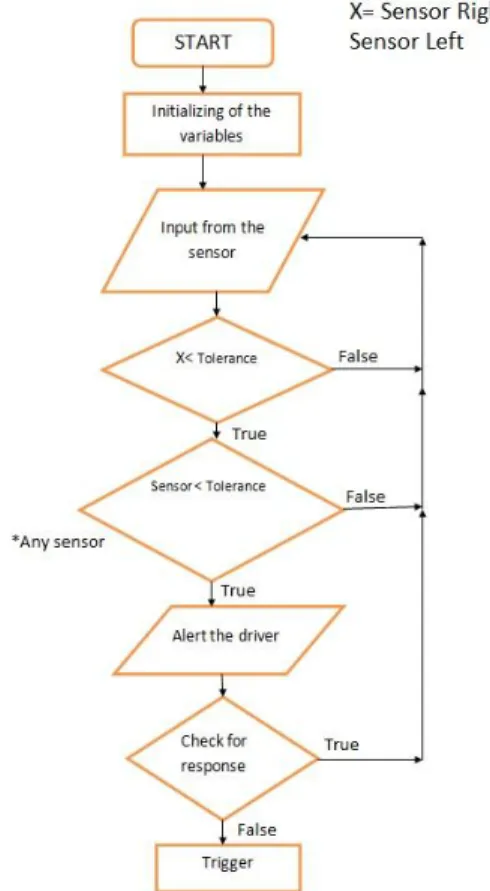
The flow chart for the anti-collision system and the upper issue of the dipper system is shown below in Figure 4(a).
Figure 4(a): Anti-Collision and Upper Issue Flow Chart
According to the flow chart, the code instructions will be as follows:
1. We will initialise the input pins, output pins and the variables that will be used to store data at different intermediate steps.
2. Then the system starts reading data from the sensors. The data reading from the sensors is done using the polling technique.
3. Then the system will compute the difference between the two sensors, which is stored in the variable ‘x’. If the value of ‘x’ is greater than the tolerance value, it will go back to step 2 or else it will go to the next step.
4. If the sensor reading is less than the tolerance, then it will go to the next step, or else, it will go to step 2.
5. The buzzer will beep to alert the driver that the safe distance limit is being exceeded. The system will check for a response from the driver, if the driver doesn’t want the system to take any action, he/she can reset the system by pressing the reset button within the proper delay. If the drive fails to do so in the given time, the system will trigger the speed control circuit.
Kaur et al., AJEEE, ISSN: 2582-0257, Vol. 3, Issue 1, May 2019, pp. 20-25 | Page | 23
Figure 4(b): Anti-Collision and Upper Issue of Dipper Implemented circuit
3. Results and Analysis
The output reading of the vibration module is as follows:
Table2: VIBRATION MODULE
Sl. No Vibration Sensor Reading (mV) LED Triggering 1 < 1000 Yellow (ON) --- 2 ≥ 1000 Red (ON) GSM, Buzzer
The normal vibration in a car varies from (2000- 3000) mV. But, for analysis purpose, the threshold value is set to 1000mV. In a practical situation, the vibration that will be observed in the case of an accident will be much higher.
Under normal conditions, the sensor reading is less than 1000 mV, which is indicated by the yellow LED, which represents the normal functioning. Under critical circumstances, the value of the vibration sensor is equal to or greater than 1000mV, which is represented by the red LED. In addition, GSM and Buzzer are triggered depending on the conditions specified in the code.
The output reading of the temperature module is as follows:
Table 3: TEMPERATURE SENSOR
Sl. No Temperature Reading( ͦ C) LED Triggering 1 <30 Yellow (ON) --- 2 ≥30 Red (ON) GSM, Buzzer
The temperature sensor module is used to monitor the temperature of the system installed since excessive heat produced in the vehicle can damage the system. The threshold of the
temperature sensor from the analysis is taken as 30 degrees Celcius.
Under normal situation, the yellow LED is ON representing that the temperature is below 30 degrees, whereas under the abnormal condition the red LED is turned ON representing that the temperature of the system has exceeded the threshold value and the buzzer and GSM is triggered respectively.
The output reading of the ultrasonic sensor is as follows:
Table 3: ULTRASONIC SENSOR
Sl. No Ultrasonic Reading (cm) LED Triggering 1 x<40, Sensor reading<40 Green (OFF) System Controller 2 x>40 Red (ON) Intensity controller
The Ultrasonic sensor is used to detect the vehicle. The ‘x’ in the table represents the difference between the two sensor readings. If the sensor reading is less than 40 (threshold value), and the difference between the sensor reading is also less than 40, then it represents that there is a vehicle is in front of the system, and the distance between both the vehicle is less than the specified safety distance. As a result, the system will initialize the system controller to avoid a collision.
Again, if the difference between the readings of the sensor is greater than the specified value, it represents that the vehicle is coming from the opposite direction, and it will initialize the intensity controller circuit if the light is at high beam, to control the intensity of light for a specific period of time. After that, it will return to the original value once the required time delay is over.
4.
Conclusion
The main objective of the proposed system is to design a smart vehicle system using Arduino. Here a prototype of the smart vehicle is developed which can be integrated to form an application for installing in smart vehicles in future. This system will help people receive emergency services on time and will reduce the causes of road accidents.
Since smart India is the new trend, every working system is being upgraded to an automatic or smart system, then why not a smart vehicle system. In the proposed project we have taken up only three parameters, the system can further be modified by addition of more sophisticated designs. Some of such sophisticated designs that can be added in future are:
Kaur et al., AJEEE, ISSN: 2582-0257, Vol. 3, Issue 1, May 2019, pp. 20-25 | Page | 24 (i) Speed controller system
(ii) Pollution control (iii)Ignition Control
(iv)Audio Controllable system etc.
References
[1] G. Kiruthikamani, B. Abinayaa, B. Saranya, P. Devi and R.Gayathri, “Smart Vehicle Safety System Using Arduino”, International Journal of Trend in Research and Development, Vol. 3, Issue 6, November-December 2016. Retrieved from www.researchgate.net/publication/31203184 0_Smart_Vehicle_Safety_System_Using_Ar duino
[2] P. Shindalkar, A. F. Shaikh and C. Mate, “Arduino Based Vehicle Accident Detection System”, International Journal of Innovative Research in Computer and Communication Engineering, Vol. 4, Issue 5, April 2017.
Retrieved from
www.ijircce.com/upload/2017/april/329_Ar duino.pdf
[3] S. Warankar, S. Nawale, T. Bardeskar and A. Mhatre, “Arduino based Car Security System”, International Journal of Engineering Technology Science and Research, Vol. 4, Issue 4, April 2017.
Retrieved from
www.ijetsr.com/images/short_pdf/14918204 62_dmce820_venue_ijetsr.pdf
[4] H. Alshamsi, V. Këpuska and H. Alshamsi, “Time Vehicle Tracking Using Arduino Mega”, International Journal of Science and Technology, Vol. 5, Issue 12, December,
2016. Retrieved from
www.researchgate.net/publication/31934518 8_Real_Time_Vehicle_Tracking_Using_Ar duino_Mega
[5] B. Patil, H. Amrite, K. Gaikwad, J. Dighe and S. Hirleka, “Smart Car Monitoring System Using Arduino”, International Research Journal of Engineering and Technology, Vol. 5, Issue 3, March 2018.
Retrieved from
www.irjet.net/archives/V5/i3/IRJET-V5I3347.pdf
[6] A. S. Murthy and T. Ravindra, “Accident Location Detection Using Vehicle Tracking System”, International Journal of Advanced Research in Education Technology, Vol. 2, Issue 3, July-September 2015. Retrieved
from
http://ijaret.com/wp-content/themes/felicity/issues/vol2issue3/ad dala.pdf
[7] H. M. Ali and Z. S. Alwan, “Car Accident Detection and Notification System Using Smartphone”, International Journal of Computer Science and Mobile Computing, Vol. 4, Issue 4, April 2015. Retrieved from https://ijcsmc.com/docs/papers/April2015/V 4I4201599a40.pdf
[8] R. K. Moje, A. Kumbhar, R. Shinde and S. Korke, “Automatic Ambulance Rescue System”, International Journal Of Innovative Research In Electrical, Electronics, Instrumentation And Control Engineering, Vol. 4, Issue 4, April 2016.
Retrieved from
https://www.ijireeice.com/upload/2016/april -16/IJIREEICE%2078.pdf
[9] P. Javale, S. Gadgil, C. Bhargave, Y. Kharwandikar and V. Nandedkar “Accident Detection and Surveillance System using Wireless Technologies”, IOSR Journal of Computer Engineering (IOSR-JCE), Vol. 16, Issue 2, March-April 2014. Retrieved from http://www.iosrjournals.org/iosr-
jce/papers/Vol16-issue2/Version-10/G0162103843.pdf
[10] A. Kumar, A. Jaiswal, N. Jaiswal and R. Sharma, “Vehicles Anti-collision System”, International Journal of Computer Applications, Volume 99, Issue 19, August
2014. Retrieved from
https://pdfs.semanticscholar.org/545b/0e292 bd2b32ea5b22be8f6bb37cb3818b042.pdf
Authors
’
Profiles
Ms. Smriti Dey, is working as an Assistant Professor in the department of Electrical and Electronics Engineering, School of Technology, Assam Don Bosco University, India. She is
currently pursuing Ph.D. from Gauhati University. Her areas of research interest are Power & Energy Management and FACTS Networking Pricing, Power Quality.
Animesh Das, is Pursuing B.Tech degree (8th semester) in the department of Electrical and Electronics Engineering, School of Technology, Assam
Kaur et al., AJEEE, ISSN: 2582-0257, Vol. 3, Issue 1, May 2019, pp. 20-25 | Page | 25 Don Bosco University, Guwahati, India.
Parveen Kaur, is pursuing B.Tech degree (8th semester) in the department of Electrical and Electronics Engineering, School of Technology, Assam Don Bosco University, Guwahati, India.
Manash Pratim Borah, is pursuing B.Tech degree (8th semester) in the department of Electrical and Electronics Engineering, School of Technology, Assam Don Bosco University, Guwahati, India.