Gomes, Manuel (2012) Statistical methods for cost-effectiveness anal-ysis that use cluster-randomised trials. PhD thesis, London School of
Hygiene & Tropical Medicine. DOI: https://doi.org/10.17037/PUBS.04646546 Downloaded from: http://researchonline.lshtm.ac.uk/4646546/
DOI:10.17037/PUBS.04646546
Usage Guidelines
Please refer to usage guidelines at http://researchonline.lshtm.ac.uk/policies.html or alterna-tively [email protected].
Statistical methods for cost-effectiveness
analysis that use cluster randomised trials
Manuel Gomes
Thesis submitted to the University of London for the Doctor
of Philosophy degree
London School of Hygiene and Tropical Medicine
February 2012
I, Manuel Ant6nio de Oliveira Gomes, confirm that the work presented in this thesis is
my own.
Where information has been derived from other sources, I confirm that this has been
indicated in the thesis.
Signat(lre:
Date:
1!/o'/2()11.
Abstract
This thesis considers alternative statistical methods for cost-effectiveness analysis (CEA) that use cluster randomised trials (CRTs). The thesis has four objectives: firstly to develop criteria for identifying appropriate methods for CEA that use CRTs; secondly to critically appraise the methods used in applied CEAs that use CRTs; thirdly to assess the performance of alternative methods for CEA that use CRTs in settings where baseline covariates are balanced; fourthly to compare statistical methods that adjust for systematic covariate imbalance in CEA that use CRTs.
The thesis developed a checklist to assess the methodological quality of published CEAs that use CRTs. This checklist was informed by a conceptual review of statistical methods, and applied in a systematic literature review of published CEAs that use CRTs. The review found that most studies adopted statistical methods that ignored clustering or correlation between costs and health outcomes.
A simulation study was conducted to assess the performance of alternative methods for CEA that use CRTs across different circumstances where baseline covariates are balanced. This study considered: seemingly unrelated regression (SUR) and generalised estimating equations (GEEs), both with a robust standard error; multilevel models (MLMs) and a non-parametric 'two-stage' bootstrap (TS8). Performance was reported as, for example, bias and confidence interval (Cl) coverage of the incremental net benefit. The MLMs and the TSB performed well across all settings; SUR and GEEs reported poor Cl coverage in CRTs with few clusters.
The thesis compared methods for CEA that use CRTs when there are systematic differences in baseline covariates between the treatment groups. In a case study and further simulations, the thesis considered SUR, MLMs, and TSB combined with SUR to adjust for covariate imbalance. The case-study showed that cost-effectiveness results can differ according to adjustment method. The simulations reported that MLMs performed well across all settings, and unlike the other methods, provided Cl coverage close to nominal levels, even with few clusters and unequal cluster sizes.
The thesis concludes that MLMs are the most appropriate method across the circumstances considered. This thesis presents methods for improving the quality ofCEA that use CRTs, to help future studies provide a sound basis for policy making.
Contents
Abstract3
Contents5
Acknowledgements8
Abbreviations9
List of tables10
List of Figures12
List of Appendices13
Chapter 1 - Introduction
14
1.1 Economic evaluation of health care 15
1.2 Cluster randomised trials 17
1.3 Aims and objectives 20
1.4 Conceptual framework 21
1.5 Overall contribution of the thesis 23
1.6 Structure of the thesis 25
1. 7 Contribution ofthe candidate to the thesis 26
Chapter 2 - Conceptual review of statistical methods for CEA that
use CRTs
31
2.1 Introduction 32
2.2 Fundamental statistical issues in CEA that use CRTs 34 2.3 Review of prospective statistical methods for CEA that use CRTs 39
2.3.1 Hypothesis tests and cluster-level methods 39
2.3.2 Net-benefit regression 40
2.3.3 Seemingly Unrelated Regression (SUR) 41
2.3.4 Generalised Estimating Equations (GEEs) 43
2.3.5 Multilevel models (MLMs) 46
2.3.6 The non-parametric two-stage bootstrap (TSB) 48
2.3.7 Summary 55
2.3.8 Generating hypotheses about alternative appropriate methods for CEA that use CRTs 56
2.4 Current evidence on methods proposed for CEA that use CRTs 60
2.5 Discussion 62
References 66
Chapter 3 - Checklist for critical appraisal of CEA that use CRTs 74
3.1 Preamble to research paper 1 75
3.2. Research paper 1 77
Chapter 4 - Assessment of the relative performance of alternative
statistical methods for CEA that use CRTs in settings with balanced
covariates
127
4.1 Preamble to research paper 2 128
4.2 Research paper 2 129
5.1 Preamble to research paper 3 169
5.2 Research paper 3 171
Chapter 6 - Discussion
205
6.1 Introduction 206
6.2 Overall findings of the thesis 207
6.3 Main contributions of the thesis 208
6.3.1 Developing criteria for identifying appropriate methods for CEA that use CRTs and critical appraisal of
applied literature 208
6.3.2 Methodological insights on the relative merits of alternative methods for CEA that use CRTs with balanced
covariates 209
6.3.3 Comparative assessment of alternative methods for CEA that use CRTs with systematic imbalance in
baseline covariates 209
6.4 Other general methodological contributions emerging from the thesis 210
6.4.1 The use of robust methods in the analysis of hierarchical data 210
6.4.2 Methods that assume Normal distributions in settings with skewed cost data 211
6.4.3 Non-parametric bootstrap methods in CEA 211
6.5 Limitations 213
6.5.1 Criteria for critical appraisal ofCEA that use CRTs 213
6.5.2 Range of methods considered for assessment 214
6.5.3 Range of circumstances considered 215
6.6 Areas of further research 217
6.6.1 Comparison of the methods under more complex circumstances 217
6.6.2 Assessment of the impact of method choice on long-term cost-effectiveness using decision models 218 6.6.3 Development of a general analytical strategy for CEA ,that use CRTs 219
6.7 Recommendations for applied researchers 219
6.8 Implications for policy making 221
6.7 Conclusion 222
Acknowledgements
First and foremost I want to thank my supervisor Richard Grieve. It has been an honour to be his
first doctoral student. Richard has provided me with immense intellectual and practical support. His vast experience and excellent guidance were vital throughout this journey. I am also thankful for the excellent example he has provided with his successful achievements, both professional and personal.
I am very grateful to my advisors, Richard Nixon, James Carpenter and John Edmunds, who offered me their continuous support and constructive comments at each stage of the thesis. In particular, I would like to thank Richard Nixon for giving me the opportunity to work in the Modelling and Simulation Group at Novartis. I am also very grateful to Edmond Ng for his statistical advice and practical help with the simulations. Sincere thanks go to Simon Thompson, Zaid Chalabi and John Cairns for their enlightening thoughts and advices. I also thank Max Bachmann and Simon Dixon for providing full access to the datasets of the case studies.
Warm thanks go numerous friends and colleagues at LSHTM who contributed to an inspiring environment for research. In particular, I would like to thank Noemi Kreif and Tazio Vanni for
their stimulating comments, discussions and brainstorming. Financial support from the Funda~ao
para a Ciencia e a Tecnologia is greatly appreciated.
Lastly, special thanks go to my family for their invaluable support. In particular, I am deeply indebted to my parents for their eternal love and for passing on to me exceptional values. I
Abbreviations
AIC - Akaike information criterion ATE - Average treatment effect BVN - Bivariate Normal
CADTH - Canadian Agency for Drugs and Technology in Health CEA - Cost-effectiveness analysis
CEAC - Cost-effectiveness acceptability curve Cl - Confidence Interval
CL T - Central limit theorem CRT - Cluster randomised trial CV - Coefficient of variation DGP - Data generating process
EVPI - Expected value of perfect information GEE - Generalised estimating equations GLM - Generalised linear models GLS - Generalised linear squares
ICC - Intra-cluster correlation coefficient ICER - Incremental cost-effectiveness ratio INB - Incremental net-benefit
IPD - Individual patient data IQR - Interquartile range
IQWIG - Institute for Quality and Efficiency in Health Care MCMC - Markov chain Monte Carlo
ML - Maximum likelihood MLM - Multilevel model
MRC - Medical Research Council NB - Net-benefit
NICE - National Institute for Health and Clinical Excellence OLS - Ordinary least squares
PBCA - Pharmaceutical Benefits Advisory Committee
PoNDER - Psychological interventions for postnatal depression QALY - Quality-adjusted life year
RCT - Randomised controlled trial RMSE - Root mean square error SE - Standard error
SUR - Seemingly unrelated regression TSB - Two-stage bootstrap
List of tables
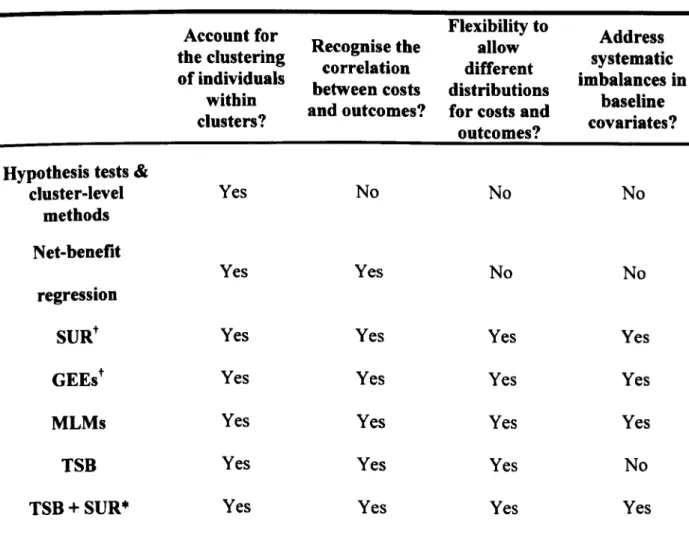
Table 2.1: The ability of each method to address the main statistic~1 issues in CEA
that use CRTs ... S5
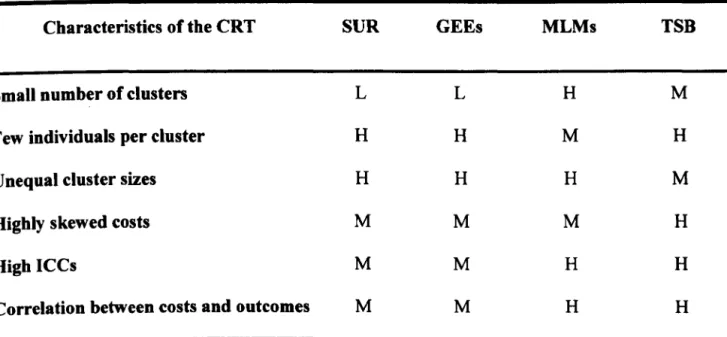
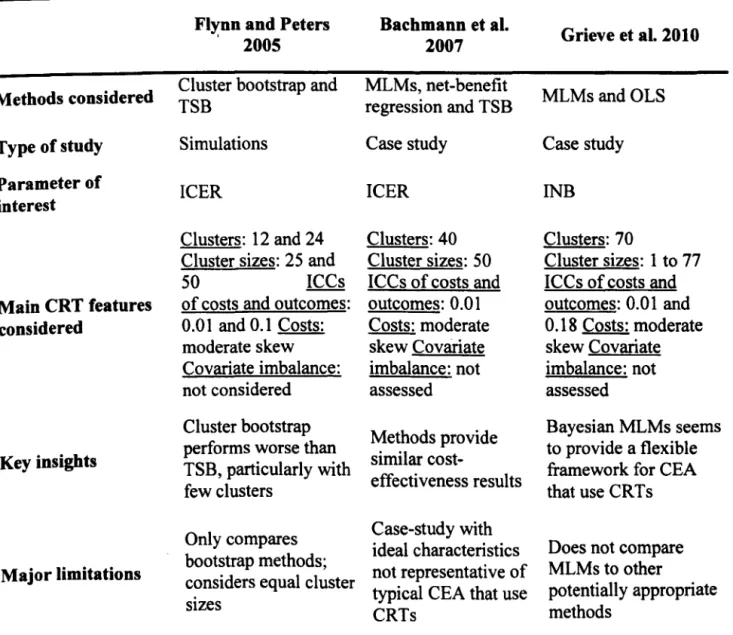
Table 2.2: Anticipated appropriateness of methods proposed for CEA that use CRTs across typical circumstances ...•...•... 58 Table 2.3: Evidence comparing appropriate statistical methods for CEA that use
CRTs ... 60
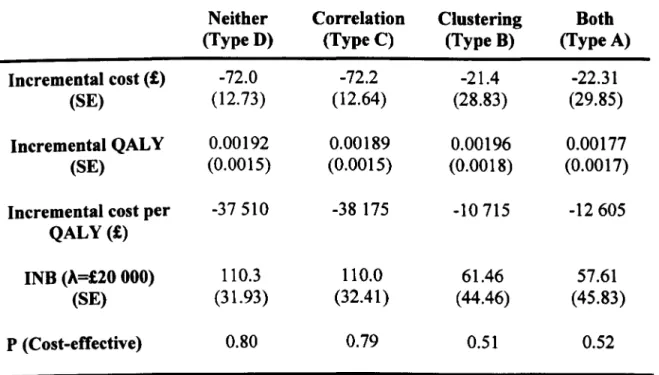
Table 3.1: Results from a CEA ofa CRT (PoNDER), reanalysed according to
whether the statistical methods accounted for clustering and correlation ....•.•... 84 Table 3.2 - Proposed checklist for CEA that use CRTs .•...•...•...•• 91 Table 3.3: Characteristics of the studies included in the review (n=62) ....•... 95 Table 3.4: Results from applying the CRT checklist to a) the economic evaluation
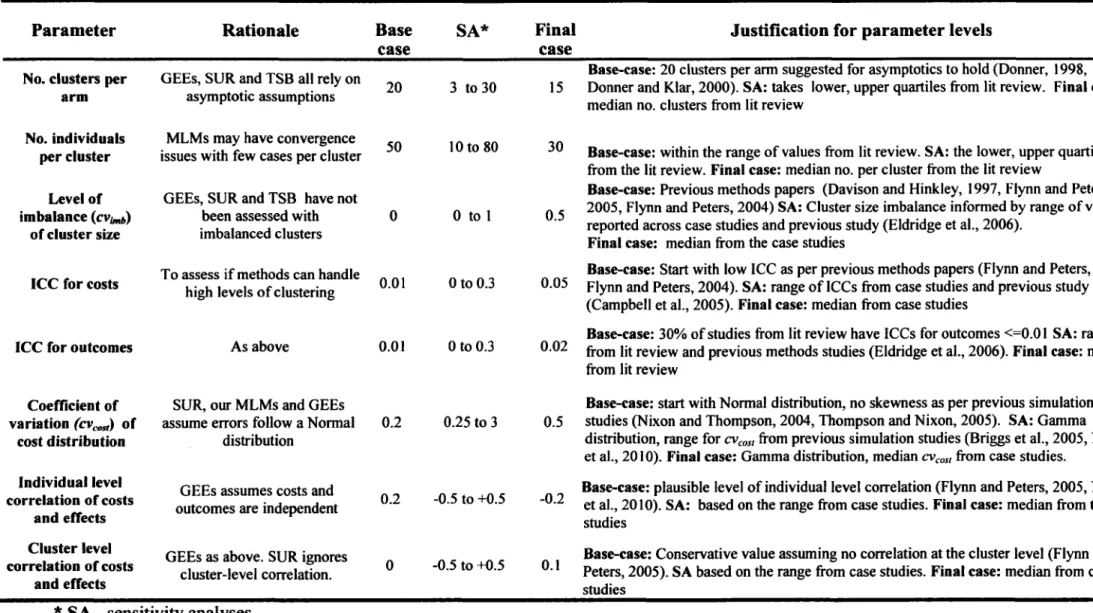
paper, and b) the economic evaluation and supplementary sources. N(%) of studies that met each criterion and total score (n=62) ... 97 Table 4.1: Description, rationale and evidence for the parameter values allowed to
vary across the different scenarios ... 133
Table 4.2: Bias, rMSE, Cl coverage and width of the mean INB for the base-case
(true INB=£l 000) ... 135
Table 4.3: Cl coverage of the mean INB (nominal level is 0.95) for the one-way
sensitivity analysis ... 136
Table 5.1: The PoNDER case-study. Covariate balance for baseline characteristics, and correlation of those covariates with endpoints ... 173 Table 5.2: PoNDER case-study. Mean (SE) incremental cost (£), incremental QALY, INB (#..=£20 000) for models without and with covariate. adjustment ... 176 Table 5.3: Description of the main parameter values allowed to vary across the
different scenarios in the simulation study ... 180
Table 5.4: Bias (SE) of the INB for a set of scenarios (SI-SS) which allow for increasing levels of baseline imbalance for an individual-level covariate, and
increasing levels of correlation of that covariate with health outcome (QAL Y s, true
INB=£l 000) ... 182
Table 5.5: Bias, variance, rMSE Cl coverage and width ofthe INB for a scenario (Sll) with a cluster-level prognostic relationship that differs by treatment arm (true
List of Figures
Figure 2.1: Clustering inherent to 2-arm multicentre RCTs and CRTs. The unit of randomisation (in bold) is the individual in multicentre RCTs and the cluster
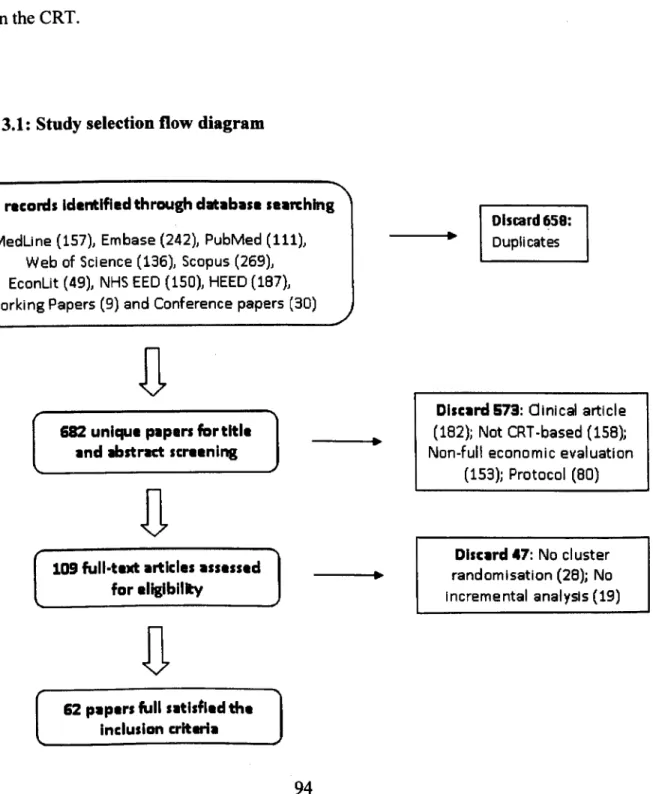
(e.g. hospital) in CRTs ... 36 Figure 3.1: Study selection flow diagram ... 94
Figure 3.2: Methodological quality of the selected papers using the Drummond checklist
and our proposed checklist ... 96
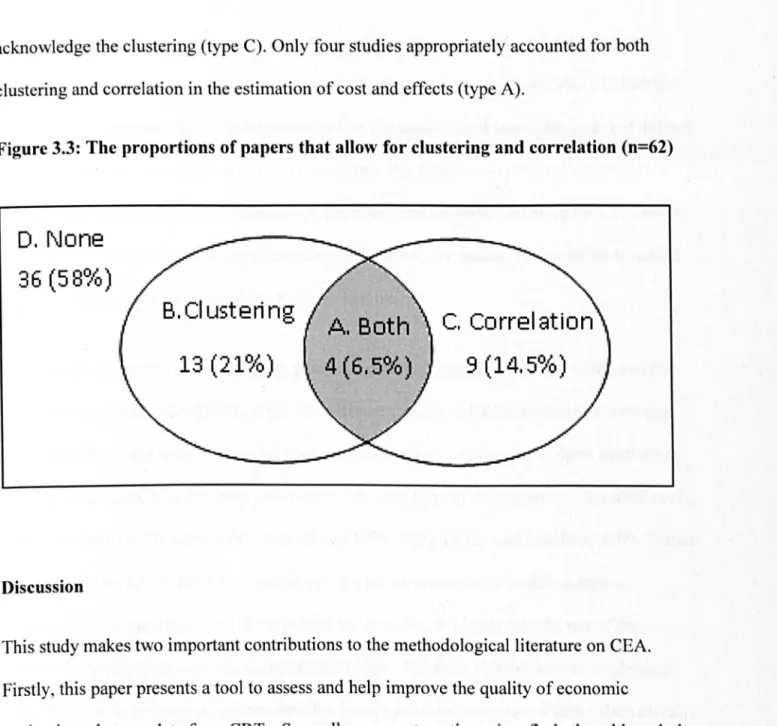
Figure 3.3: The proportions of papers that allow for clustering and correlation (n=62) •••.• 99 Figure 4.1: Cl coverage (nominal level is 0.95) for multi-way sensitivity analyses: high
skewness of costs (cvcost = 3), decreasing number of clusters combined with a) moderate and b) high cluster size imbalance ... 138 Figure 5.1: Cl coverage of the INB (nominal level is 0.95) for adjusted methods for the
following scenarios: base case (S5); confounding on costs (S6); imbalanced cluster-level covariate (S7); high ICCs (S8); high cluster size variation (S9); few
List of Appendices
Appendix 2.1: Robust estimators of the variance for SUR and GEEs ...•...•...•.... 70
Appendix 3.1: Guidance on the methods considered appropriate for a paper to meet each criterion of the proposed checklist ... 108
Appendix 3.2: Search strategy for the database MedLine (March 1,2010) ...••...•..••... 111
Appendix 3.3: List of the papers that satisfied the inclusion criteria ... 112
Appendix 3.4: Other characteristics of the reviewed studies (N=62) ... 117
Appendix 4.1: Robust variance estimator ... 148
Appendix 4.2: Algorithms for the non-parametric two-stage bootstrap ... 150
Appendix 4.3: Definition of performance measures for a given parameter of interest •••••. 152 Appendix 4.4: R code for implementing GEEs, MLMs and TSB ... 153
Appendix 5.1: Algorithm for the non-parametric TSB combined with SUR ... 194
Appendix 5.2: Bias (True INB=£l 000), variance and rMSE of the INB for adjusted methods, across scenarios S5-810" ... 195
Chapter 1
1.1 Economic evaluation of health care
Health economic evaluation aims to assist policy making by assessing the relative value of alternative health care technologies, public health interventions, and ways of organising health services (Gold, 1996; Drummond et al., 2005; Morris et al., 2007). It provides a structured framework which can help address the goal of maximising population health subject to available resources (Weinstein and Stason, 1977). Policy makers worldwide (e.g. CADTH, 2006; NICE, 2008; PBCA, 2008; IQWIG, 2009) now use economic evaluation studies to inform decisions about, for example, which health interventions to fund. Methodological guidelines for economic evaluation of health care programmes are relatively well established and encourage the use of individual patient data (lPD) from randomised controlled trials (RCTs) (Gold, 1996; Willan and Briggs, 2006; Glick et al., 2007). It has become increasingly common for RCTs to collect IPD on resource use alongside health outcomes to help evaluate which interventions offer the best value for money.
The availability of patient-level cost-effectiveness data has led to a greater focus on using appropriate statistical methods in cost-effectiveness analysis (CEA)i (Briggs et al., 2002). For example, methodological guidance emphasise the need for studies to use methods that can address the correlation between individual costs and health outcomes (O'Hagan and Stevens, 2001; Hoch et al., 2002; Willan et al., 2004). Another important issue is that costs and outcomes may be collected from different health care settings (e.g. different countries). In these
circumstances, methods must recognise that cost and outcome data may be more similar within than across settings due to, for example, patient case-mix and cost variation across countries
(Willke et aI., 1998; Grieve et aI., 2005). An additional concern in CEA is that cost data are typically skewed, with a small proportion of individuals incurring high costs (Barber and Thompson, 1998; Briggs and Gray, 1998; Thompson and Barber, 2000). The skewed nature of cost data may raise issues for methods which assume that data are Normally distributed. These methodological challenges have encouraged the development of statistical methods for CEA conducted alongside RCTs where individuals are randomly allocated to alternative treatment groups.
To address some of the methodological challenges raised in CEA, statistical methods have been successfully transferred from other areas such as biostatistics and econometrics. For example, methods that respect the correlation between costs and outcomes have adapted bivariate models and seemingly unrelated regressions (SUR) (O'Hagan and Stevens, 200 I; Willan et aI., 2004; Nixon and Thompson, 2005) originally proposed in medical statistics (Anderson, 1984; Timm, 2002) and econometrics (Wooldridge, 2002; Greene, 2003). More generally, these methods offer additional appeal for CEA in that they allow for covariate adjustment to help increase the
precision of the estimates or perform subgroup analyses (Willan et aI., 2004; Nixon and Thompson, 2005). Other studies have adapted multilevel models, originally developed for education and health research (Leyland and Goldstein, 2001; Goldstein, 2003), to acknowledge the hierarchical nature of multicentre and multinational cost and cost-effectiveness data (Manca et aI., 2005; Nixon and Thompson, 2005; Grieve et aI., 2007). To handle skewed costs, methods that avoid distributional assumptions such as non-parametric bootstrapping (Efron and
Research funders such as the UK Medical Research Council and National Institute for Health Research have encouraged methodological developments in CEA to help studies provide sound evidence for policy making. It is anticipated that the methods developed can then 'feed into'
methodological guidelines for CEA used by health decision makers such as NICE2 (NICE,
2008), and lead to improvements in practice. A number of other areas have received relatively little attention in CEA and further methodological development has been advocated. For
example, commentators have highlighted the need for additional work in methods for CEA that use cost-effectiveness data that are subject to censoring or missingness (Young, 2005; Noble et al., 20 I 0). Also, the characterisation of structural uncertainty in CEA is receiving increasing attention, and studies are advised to carefully address structural/model uncertainty in addition to parameter uncertainty (Claxton, 2008; Jackson et al., 2009). Another important area where the need for further methodological improvement has been recognised is in CEA that use cost-effectiveness data from cluster randomised trials (Flynn and Peters, 2005a; Willan and Briggs, 2006). This thesis will focus its attention on improving statistical methods in this area.
1.2 Cluster randomised trials
Economic evaluations of public health interventions often use cost-effectiveness data from cluster randomised trials (CRTs). In CRTs, the unit of random is at ion is the cluster, for example the hospital, not the individual patient. The cluster design is preferred in many situations (Donner and Klar, 2000; Hayes and Moulton, 2009). For instance, the intervention may be delivered at the group-level such as professional training for general practitioners in order to change their
behaviour towards their patients, or a prevention programme may be delivered at the hospital-level. Cluster designs are also common when it is important to avoid contamination between individual patients of different treatment groups. For example, in a CRT to evaluate a smoking cessation intervention, it is important to prevent individuals in the treatment group telling the control group about the preventive strategy, otherwise dilution bias may arise.
While CRTs can provide an appropriate design for many interventions, their analysis can pose specific challenges. A fundamental issue in the analysis of CRTs is that patients are more homogeneous in their outcomes within than between clusters. Hence, the use of standard methods such as OLS regression, that assume individual observations are independent, will be incorrect (Donner, 1998; Murray et aI., 1998). Cornfield who first brought to light the analytical implications of cluster randomisation stated (Cornfield, 1978):
"Randomisation by cluster accompanied with an analysis appropriate to randomisation by
individual is an exercise in self deception, however, and should be discouraged"
In other words, methods that ignore the clustering assume they are using more information than they actually have, and will understate the uncertainty (Donner, 1998; Murray et aI., 1998). In circumstances where there is a relationship between the size of the cluster and the endpoints, ignoring clustering may lead to bias (Panageas et al. 2007).
Another key concern with CRTs is that the cluster design may be prone to systematic differences in baseline covariates between treatment groups (Donner and Klar, 2000; Puffer et aI., 2005; Carter, 2010).
In CRTs, confounding3 can arise because many CRTs are unblinded, and hence, the recruiting
centre is aware of the treatment assignment and patients' characteristics prior to their inclusion. Therefore, the CRT design can yield systematic imbalances in baseline characteristics; for example, there may be circumstances where older patients are less likely to participate in the treatment than the control group (Hahn et al 2005). Studies that fail to account for potential confounding on these observed factors will provide biased results (Puffer et aI., 2003; Hahn et aI., 2005; Eldridge et aI., 2008).
Despite general improvements in methods for CEA alongside RCTs (Gold, 1996; Willan and Briggs, 2006; Glick et aI., 2007), methods for CEA that use data from CRTs have received relatively little attention (Flynn and Peters, 2005a). Commentators have recognised that this area can raise additional challenges for analysts and highlighted that additional methodological development is required (Klar and Donner, 2001; Flynn and Peters, 2005a; Willan, 2006). In CEA that use CRTs, it is crucial that methods address the issues that can arise with the cluster design such as the clustering and covariate imbalance, while acknowledging other important concerns in CEA such as the correlation between costs and outcomes. For example, Grieve and others (2010) suggest that ignoring the clustering can lead to inaccurate estimates of incremental cost-effectiveness and the accompanying uncertainty. While some methods, such as the non-parametric bootstrap (Flynn and Peters, 2005b) and multilevel models (Grieve et aI., 2010), have been proposed for CEA that use CRTs, there is a lack of work comparing these alternative approaches. Only one study (Bachmann et aI., 2007) considers alternative methods for CEA that
3 Here 'confounding' is defined as when there is an observed or unobserved baseline characteristic, which is
correlated with both the treatment and the endpoint. This can lead to a biased estimate of the true treatment effect. In the health economics and econometrics literatures this problem is also referred as 'selection bias' or 'endegoneity'. This thesis considers approaches for handling this aspect of confounding due to observed characteristics (Jones and
use cluster trials. This paper compares the methods in a single case-study with relatively ideal characteristics such as large number of clusters and equal cluster sizes. The study finds small differences across methods and fails to provide general insights on the relative merits of alternative methods. There have been no previous simulation studies that have compared the performance of alternative statistical methods across typical circumstances faced by CEA that use CRTs. Furthermore, it is unknown whether applied CEAs that use CRTs use appropriate methods and thus whether they can provide sound evidence for policy making.
1.3 Aims and objectives
The overall aim ofthis thesis is to identify appropriate statistical methods for CEA that use CRTs and to assess their relative performance across a wide range of realistic scenarios typically faced by CEA that use CRTs. The specific objectives are:
1. To develop criteria for identifying appropriate statistical methods for CEA that use CRTs. 2. To critically appraise the methods used in applied CEAs that use CRTs.
3. To assess the relative performance of alternative statistical methods for CEA that use CRTs in settings where baseline covariates are balanced.
4. To compare alternative methods to adjust for systematic covariate imbalance in CEA that use CRTs.
1.4 Conceptual framework
To address these objectives, the thesis requires a clear conceptual framework, drawing on insights from general biostatistics and medical statistics. An important conceptual point, well established in the literature, is that the form of clustering inherent in CRTs is distinct (Donner,
1998). Unlike individually-randomised multicentre trials, where individuals within each centre receive different treatments, in CRTs all patients within the cluster are assigned to the same treatment group. Another important concern is that cluster randomisation is more vulnerable to systematic imbalances in baseline covariates between treatment groups than individual
randomisation (Puffer et aI., 2003; Hahn et aI., 2005; Eldridge et aI., 2008). This means that covariate adjustment may be required if potential prognostic factors are anticipated to confound the treatment effect. In addition to these, CRTs typically have few clusters and unequal numbers of individuals per cluster, which raises important considerations for the statistical analyses (Ukoumunne et aI., 1999; Eldridge et aI., 2004; Campbell et aI., 2007). While these fundamental issues are well recognised in the statistics literature, they have received little attention in the context ofCEA that use CRTs.
To develop appropriate methods for CEA that use CRTs it is important to combine these methodological insights from biostatistics and medical statistics with conceptual ideas from the health economics literature. To transfer methods directly from one context to another is
insufficient (Briggs et aI., 2002). Undertaking CEA raises issues beyond those that arise in the analysis of clinical outcomes, which need to be carefully addressed. Firstly, as cost function theory suggests, costs may be associated with high levels of within-cluster correlation due to large heterogeneity across clusters in resource use, unit costs, efficiency and patient case-mix (Raikou et aI., 2000; Morris et aI., 2007). The anticipation of relatively large heterogeneity
further encourages the use of methods that appropriately account for the clustering. Secondly, methodological guidelines for CEA emphasise that individual costs are often correlated with individual outcomes (Willan and Sriggs, 2006). Hence, methods that allow for the joint estimation of endpoints while addressing the clustering are required. Thirdly, unlike clinical outcomes, cost data are typically highly skewed, with heavy right tails and bounded by zero. In these circumstances, assuming Normality may not be plausible, and using methods that allow for an appropriate joint distribution of costs and outcomes may be preferred (O'Hagan and Stevens, 2001; Nixon and Thompson, 2005).
This thesis will undertake a conceptual review to examine methodological guidance in the medical statistics and health economics literature. The review will identify key methodological
issues that analytical methods need to address in CEA that use CRTs. These criteria will then be
used for two main purposes. Firstly they will help identify appropriate statistical methods for the empirical investigations, and secondly to inform the development of a checklist for critical appraisal of CEA that use data from cluster trials.
The empirical investigation will include simulations and case-studies that draw on the concepts from the methods review. The simulations will allow a clear assessment of the statistical
performance of each method against the true parameter values, for example the true incremental net benefit (INS). Methods will be compared across realistic scenarios, which will be informed by the conceptual review, a systematic review of the applied literature and available case-studies. Analysis of the case-studies will provide insights on whether the empirical differences between methods identified in the simulations can lead to differences in the cost-effectiveness results used
1.5 Overall contribution of the thesis
This thesis develops specific criteria for critical appraisal ofCEA that use CRTs. General checklists and methodological guidelines for CEA do not include specific criteria for critically appraising CEA that use cluster trials (Of man et aI., 2003; Drummond et aI., 2005; Evers et aI., 2005; Philips et aI., 2006). In addition, it is unknown whether applied CEAs that use CRTs use appropriate statistical methods. Research paper 1 addresses these gaps in the literature by
identifying fundamental statistical issues that need to be addressed in CEA that use CRTs. These criteria are used to help develop a checklist for critical appraisal of published CEAs that use CRTs. This checklist is applied in a systematic review of the applied literature and finds that applied CEAs that use CRTs often fail to use appropriate statistical methods. In particular, the review shows that most studies fail to account for the clustering or correlation between costs and health outcomes, possibly resulting in misleading inferences about the cost-effectiveness of health care interventions. The new checklist aims to complement more generic checklists and methodological guidance for CEA (Drummond et aI., 2005; Evers et aI., 2005).
This thesis provides the first comparison of the relative performance of alternative statistical methods for CEA that use CRTs. Research paper 2 considers seemingly unrelated regression (SUR) and generalised estimating equations (GEE), both with robust standard errors, multilevel models (MLMs), and a non-parametric two-stage bootstrap (TSB). This paper firstly shows that methods which fail to account for key statistical issues such as clustering perform poorly, for example confidence interval (Cl) coverage is below 0.9, for a nominal level of 0.95. The paper considers SUR and GEEs with robust variance estimators for the first time in this context, and
finds that these may be inappropriate when there are few clusters. Unlike relatively complex MLMs proposed previously for CEA that use CRTs (Grieve et aI., 2010), the simulation study demonstrates that a simpler bivariate Normal MLM performed well across the scenarios
considered. In addition, the paper extends the non-parametric TSB considered in previous studies (Flynn and Peters, 2004; 2005b) to recognise circumstances where there are unequal cluster sizes, and shows that this method performs relatively well throughout.
Research paper 3 extends seminal work on covariate adjustment in CEA (Willan et aI., 2004; Nixon and Thompson, 2005) by investigating the relative merits of SUR, MLMs and non-parametric TSB to address systematic covariate imbalance in CEA that use CRTs. This paper demonstrates that failing to adjust for confounding, even if small, leads to biased results. Unlike research paper 2, this study finds that SUR with robust variance may not perform well even with a moderate number of clusters. To handle the covariate adjustment, this paper extends the original TSB routine (Davison and Hinkley, 1997) and combines it with SUR to adjust for the covariates. This new TSB approach provides unbiased estimates, but it gives poor Cl coverage across the scenarios considered. The paper shows that MLMs provide good Cl coverage (close to nominal level), even in scenarios with few clusters, unequal cluster sizes and highly skewed data.
The thesis concludes that methods which fail to account for important statistical issues in CEA that use CRTs can provide misleading cost-effectiveness results. It raises awareness of the poor methods used in practice, and provides methodological insights on the relative merits of
alternative methods for CEA that use CRTs across a large number of realistic scenarios. The three research papers presented here provide methods for improving CEA that use CRTs to help
1.6 Structure of the thesis
The remaining chapters of the thesis are as follows. Chapter 2 describes the conceptual review, which identifies the key statistical issues in CEA that use CRTs and assesses the appropriateness of prospective statistical methods against those criteria. This chapter then considers each of the statistical methods judged appropriate for CEA that use CRTs. Finally, the chapter examines the plausibility of the assumptions underlying each of these statistical methods and discusses their anticipated performance across different circumstances, in order to help inform the empirical investigation.
Chapters 3 to 5 comprise the three research papers, each prefaced with a brief preamble. Research paper 1 develops a checklist for critical appraisal ofthe methodological quality of CEAs that use CRTs, and applies this checklist in a systematic review of published studies. Research paper 2 uses simulations and a case study to assess the relative performance of
alternative statistical methods for CEA that use cluster trials in setting where baseline covariates are balanced. Research paper 3 evaluates the performance of alternative methods for covariate adjustment in CEA that use CRTs. The paper considers a motivating example with covariate imbalance and conducts further simulations to compare the methods in circumstances where systematic imbalances in baseline covariates can arise.
Chapter 6 provides an overview of the main findings and contributions of the thesis. The chapter then acknowledges the limitations of the thesis, and identifies potential areas for future research. This chapter concludes by highlighting the implications ofthe findings for applied researchers and policy making.
1.7 Contribution
of the
candidate to the thesis
The work conducted on this thesis was linked to a research grant funded by the Medical Research Council (MRC) methodology programme on improving analytical methods for CEA that use CRTs. Research paper 1 was designed by the candidate in collaboration with his supervisor Richard Grieve, and conducted independently from the project. In this study, the candidate carried out a conceptual review to develop a checklist for critical appraisal of CEA that use CRTs, applied this checklist in a systematic review of applied studies, and interpreted the findings.
The research question for research paper 2 was linked to the MRC project and identified by the principal investigator, Richard Grieve. The candidate led the design of the simulations conducted for this paper while visiting the Modelling and Simulation group at Novartis Pharma
(Switzerland), and was guided by Richard Nixon, researcher at Novartis and collaborator on the MRC project. Edmond Ng, the lecturer in statistics working on the project, helped the candidate write code for implementing the statistical methods. The candidate led on the interpretation of the results.
The candidate led on the conception of the research question for research paper 3 in
collaboration with his supervisor, Richard Grieve. The candidate was responsible for designing the simulations, writing additional code to implement the statistical methods, and conducting and interpreting the analyses.
contributions of the candidate and co-authors are described in the cover page of each research paper. The remaining chapters of the thesis are the sole work of the candidate.
References
Anderson, T. W. 1984. An introduction to multivariate statistical analysis, New York; Chichester, Wiley.
Bachmann, M. 0., Fairall, L., Clark, A. & Mugford, M. 2007. Methods for analyzing cost effectiveness data from cluster randomized trials. Cost Eff Resour Alloc, 5, 12.
Barber, 1. A. & Thompson, S. G. 1998. Analysis and interpretation of cost data in randomised controlled trials: review of published studies. British Medical Journal, 317, 1195-1200. Barber, J. A. & Thompson, S. G. 2000. Analysis of cost data in randomized trials: an application
of the non-parametric bootstrap. Statistics in Medicine, 19, 3219-3236.
Briggs, A. & Gray, A. 1998. The distribution of health care costs and their statistical analysis for economic evaluation. J Health Serv Res Policy, 3,233-45.
Briggs, A. H., O'Brien, B. 1. & Blackhouse, G. 2002. Thinking outside the box: Recent advances in the analysis and presentation of uncertainty in cost-effectiveness studies. Annual Review of Public Health, 23, 377-401.
Cadth 2006. Guidelines for the Economic Evaluation of Health Tecnologies: Canada. 3rd Ed. Canadian Agency for Drugs and Technologies in Health. , Ottawa, Canada.
Campbell, M. J., Donner, A. & Klar, N. 2007. Developments in cluster randomized trials and Statistics in Medicine. Stat Med, 26,2-19.
Carter, B. 2010. Cluster size variability and imbalance in cluster randomized controlled trials. Stat Med, 29,2984-93.
Claxton, K. 2008. Exploring uncertainty in cost-effectiveness analysis. Pharmacoeconomics, 26, 781-798.
Cornfield, 1. 1978. Randomization by Group - Formal Analysis. American Journal of Epidemiology, 108, 100-102.
Davison, A. C. & Hinkley, D. V. 1997. Bootstrap methods and their application, Cambridge, UK, Cambridge University Press.
Donner, A. 1998. Some aspects of the design and analysis of cluster randomization trials. Applied Statistics, 47, 95-113.
Donner, A. & Klar, N. 2000. Design and analysis of cluster randomization trials in health research, London, UK, Hodder Arnold Publishers.
Drummond, M., Sculpher, M., Torrance, G. W., O'brien, B. J. & Stoddart, G. L. 2005. Methods for the Economic Evaluation of Health Care Programmes Oxford, UK, Oxford
University Press.
Efron, B. & Tibshirani, R. 1993. An introduction to Bootstrap, New York, US, Chapman and Hall.
Eldridge, S., Ashby, D., Bennett,
c.,
Wakelin, M. & Feder, G. 2008. Internal and externalvalidity of cluster randomised trials: systematic review of recent trials. British Medical
Journal, 336, 876-880.
Eldridge, S. M., Ashby, D., Feder, G. S., Rudnicka, A. R. & Ukoumunne, O. C. 2004. Lessons
for cluster randomized trials in the twenty-first century: a systematic review of trials in
primary care. Clin Trials, I, 80-90.
Evers, S., Goossens, M., De Vet, H., Van Tulder, M. & Ament, A. 2005. Criteria list for
assessment of methodological quality of economic evaluations: Consensus on Health
Economic Criteria. Int J Technol Assess Health Care, 21,240-5.
Flynn, T. & Peters, T. 2005a. Conceptual issues in the analysis of cost data within cluster
randomized trials. J Health Serv Res Policy, 10, 97-102.
Flynn, T. N. & Peters, T. J. 2004. Use of the bootstrap in analysing cost data from cluster
randomised trials: some simulation results. Bmc Health Services Research, 4,33-43.
Flynn, T. N. & Peters, T. J. 2005b. Cluster randomized trials: Another problem for
cost-effectiveness ratios. International Journal o/Technology Assessment in Health Care, 21,
403-409.
Glick, H. A., Doshi, J. A., Sonnad, S. S. & Polsky, D. 2007. Economic Evaluation in Clinical
Trials, Oxford, UK, Oxford University Press.
Gold, M. R. 1996. Cost-effectiveness in health and medicine, New York, Oxford University
Press.
Goldstein, H. 2003. Multi/evel Statistical Models, Oxford, UK, Oxford University Press.
Greene, W. H. 2003. Econometric analysis, Upper Saddle River, NJ., Great Britain, Prentice
Hall.
Grieve, R., Nixon, R. & Thompson, S. G. 2010. Bayesian hierarchical models for
cost-effectiveness analyses that use data from cluster randomized trials. Med Decis Making,
30, 163-75.
Grieve, R., Nixon, R., Thompson, S. G. & Cairns, J. 2007. Multilevel models for estimating
incremental net benefits in multinational studies. Health Econ, 16, 815-26.
Grieve, R., Nixon, R., Thompson, S. G. & Normand, C. 2005. Using multilevel models for
assessing the variability of multinational resource use and cost data. Health Econ, 14,
185-96.
Hahn, S., Puffer, S., Torgerson, D. 1. & Watson, 1. 2005. Methodological bias in cluster
randomised trials. BMC Med Res Methodol, 5, 10.
Hayes, R. & Moulton, L. 2009. Cluster Randomised Trials, Boca Raton - Florida, US, CRC
Press, Taylor & Francis Group.
Hoch, 1. S., Briggs, A. H. & Willan, A. R. 2002. Something old, something new, something
borrowed, something blue: a framework for the marriage of health econometrics and
cost-effectiveness analysis. Health Econ, 11,415-30.
Iqwig 2009. Methods for assessment of the relation of Benefits to Costs in the German Statutory
Health Care System. Institute for Quality and Efficiency in Health Care., Cologne,
Germany.
Jones, A. & Rice, N. 2011. Econometric Evaluation of Health Policies. In: GLIED, S. & SMITH, P. (eds.) The Oxford handbook of health economics. Oxford, UK: Oxfors University Press.
Klar, N. & Donner, A. 2001. Current and future challenges in the design and analysis of cluster randomization trials. Stat Med, 20,3729-40.
Leyland, A. & Goldstein, H. 200 I. Multi/evel Modelling of Health Statistics, Chichester, UK, John Wiley & Sons, Ltd.
Manca, A., Rice, N., Sculpher, M. 1. & Briggs, A. H. 2005. Assessing generalisability by location in trial-based cost-effectiveness analysis: the use of multilevel models. Health Econ, 14,471-85.
Manning, W. 2006. Dealing with skewed data on costs and expenditures. In: JONES, A. (ed.)
The EIgar Companion to Health Economics. Cheltenham, UK: Edward EIgar.
Mccullagh, P. & Nelder, J. A. 1989. Generalized linear models, London, Chapman and Hall. Mihaylova, B., Briggs, A., O'H<agan, A. & Thompson, S. G. 2011. Review of statistical
methods for analysing healthcare resources and costs. Health Econ, 20,897-916. Morris, S., Devlin, N. & Parkin, D. 2007. Economic analysis in health care, Chichester, Wiley. Murray, D. M., Hannan, P. J., Wolfinger, R. D., Baker, W. L. & Dwyer, J. H. 1998. Analysis of
data from group-randomized trials with repeat observations on the same groups. Stat Med, 17, 1581-600.
Nice 2008. Methods for Technology Appraisal. National Institute for Health and Clinical Excellence, London, UK.
Nixon, R. M. & Thompson, S. G. 2005. Methods for incorporating covariate adjustment, subgroup analysis and between-centre differences into cost-effectiveness evaluations.
Health Econ, 14, 1217-29.
Noble, S. M., Hollingworth, W. & Tilling, K. 20 10. Missing data in trial-based cost-effectiveness analysis: the current state of play dagger. Health Econ.
O'Hagan, A. & Stevens, J. W. 2001. A framework for cost-effectiveness analysis from clinical trial data. Health Econ, 10,303-15.
Of man, J. 1., Sullivan, S. D., Neumann, P. J., Chiou, C. F., Henning, J. M., Wade, S. W. & Hay, J. W. 2003. Examining the value and quality of health economic analyses: implications of utilizing the QHES. J Manag Care Pharm, 9, 53-61.
Pbca 2008. Guidelines for preparing submissions to the Pharmaceutical Benefits Advisory Committee. Australian Government - Department of Health and Ageing., Camberra, Australia.
Philips, Z., Bojke, L., Sculpher, M., Claxton, K. & Golder, S. 2006. Good practice guidelines for decision-analytic modelling in health technology assessment: a review and consolidation of quality assessment. Pharmacoeconomics, 24, 355-71.
Puffer, S., Torgerson, D. & Watson, J. 2003. Evidence for risk of bias in cluster randomised trials: review of recent trials published in three general medical journals. BMJ, 327,
785-9.
Puffer, S., Torgerson, D. J. & Watson, J. 2005. Cluster randomized controlled trials. J Eval Clin Pract, I 1, 479-83.
Raikou, M., Briggs, A., Gray, A. & Mcguire, A. 2000. Centre-specific or average unit costs in multi-centre studies? Some theory and simulation. Health Economics, 9, 191-198. Thompson, S. G. & Barber,
J.
A. 2000. How should cost data in pragmatic randomised trials beTimm, N. H. 2002. Multivariate Analysis, New York, US, Springer.
Ukoumunne, O. C., Gulliford, M.
c.,
Chinn, S., Steme, J. A. & Bumey, P. G. 1999. Methods forevaluating area-wide and organisation-based interventions in health and health care: a
systematic review. Health Technol Assess, 3, iii-92.
Weinstein, M. C. & Stason, W. B. 1977. Foundations of Cost-Effectiveness Analysis for Health
and Medical Practices. New England Journal of Medicine, 296, 716-721.
Willan, A. 2006. Statistical Analysis of cost-effectiveness data from randomised clinical trials.
Expert Revision Pharmacoeconomics Outcomes Research, 6,337-346.
Willan, A. & Briggs, A. 2006. Statistical Analysis of cost-effectiveness data, Chichester, UK,
John Wiley & Sons, Ltd ..
Willan, A. R., Briggs, A. H. & Hoch, J. S. 2004. Regression methods for covariate adjustment
and subgroup analysis for non-censored cost-effectiveness data. Health Econ, 13,461-75.
Willke, R. J., Glick, H. A., Polsky, D. & Schulman, K. 1998. Estimating country-specific
cost-effectiveness from multinational clinical trials. Health Econ, 7,481-93.
Wooldridge, J. M. 2002. Econometric analysis of cross section and panel data, Cambridge, Mass., MIT Press.
Young, T. A. 2005. Estimating mean total costs in the presence of censoring: a comparative
Chapter 2
Conceptual review of statistical methods for CEA
that use CRTs
2.1 Introduction
Statistical methods for CEA that use data from RCTs have received considerable attention in the last twenty years. Conceptual ideas from biostatistics, medical statistics and econometrics have stimulated the development of methods for CEA (Gold, 1996; Drummond et aI., 2005; Willan and Briggs, 2006; Glick et aI., 2007). Despite this methodological progress, commentators have identified areas where these studies still use inappropriate methods, and encouraged further methods development (Willan, 2006; Glick et aI., 2007). They highlighted that methodological flaws in applied studies can hinder their usefulness for policy making (Rennie and Luft, 2000;
Willan, 2006). It is therefore essential that methods can address the key methodological issues
faced by CEA when evaluating the cost-effectiveness of health interventions.
One area where the lack of work on methods has been recognised is in CEA that use CRTs (Klar and Donner, 2001; Flynn and Peters, 2005a; Willan, 2006). A few studies (Flynn and Peters, 2004; Bachmann et aI., 2007; Grieve et aI., 2010) have considered statistical methods for CEA that use CRTs such as the two-stage bootstrap (TSB) and multilevel models (MLMs), and
illustrated their use in practice. However, these studies failed to tackle a number of fundamental questions, which this chapter seeks to address: Can these proposed methods address the key methodological challenges faced by CEA that use CRTs? Are the assumptions underlying these methods satisfied across different circumstances typically observed in CEA that use CRTs? Are additional potentially appropriate methods for CEA that use CRTs available? What are the anticipated relative merits of alternative methods for CEA that use CRTs?
The overall aim of this chapter is, therefore, to identify the key methodological issues faced by CEA that use CRTs and appropriate statistical methods that can address these concerns. The specific objectives of the chapter are:
1. To describe the fundamental statistical issues that can arise in CEA that use CRTs
2. To identify appropriate statistical methods for CEA that use CRTs in settings balanced covariates and systematic covariate imbalance
3. To formulate hypotheses about the relative performance of alternative methods across a range of realistic circumstances in CEA that use CRTs.
To address these objectives, a conceptual review was conducted to gather general
methodological insights from medical statistics and health economics literature. The review covered relevant papers concerning the analysis ofCRTs and economic evaluation alongside clinical trials available from 1995 to 2010. A broad search of Medline, Scopus, EconLit and Web
of Science databases was conducted by combining general search terms such as 'analysis' ,
'methods' and 'models' with 'cluster randomised trials' and 'group randomised trials '. In
addition, the citations included in these studies were examined to identify further relevant methodological publications. Working papers databases such as RePec (Research Papers in Economics) and CSSS (Centre for Statistics and Social Sciences) were also considered to cover non-published literature.
This review focused on fundamental issues for statistical analysis in CEA that use CRTs. Other aspects of CEA that use cluster trials such as those pertaining to study design, for example, sample size calculations, were not reviewed here but were considered in the critical appraisal of the applied literature (research paper 1).
The next section of this chapter identifies the main statistical issues that need to be addressed in CEA that use CRTs. Section 2.3 examines the appropriateness of potential statistical methods against the criteria developed in section 2.2. For those methods that are judged appropriate, i.e. can meet all criteria, this section critically assesses their underlying assumptions across different circumstances in CEA that use CRTs. Section 2.4 critically reviews previous evidence on
alternative methods considered in the context ofCEA that use data from CRTs. The last section discusses the findings of the conceptual review and implications for the empirical investigation.
2.2 Fundamental statistical issues in CEA that use CRTs
The first objective ofthe conceptual review was to help identify key methodological concerns in CEA that use CRTs. The review combined general insights from biostatistics and medical statistics literature together with conceptual ideas from health economics and econometrics, and identified four key issues for statistical analysis in CEA that use CRTs: the clustering of
individuals within clusters; the correlation between costs and health outcomes at individual and cluster-level; distributional assumptions for cost and outcome data; and systematic imbalances in baseline covariates. These are discussed in greater detail below.
Firstly, methodological guidelines for the analysis of CRTs (Donner, 1998; Murray et aI., 1998; Donner and Klar, 2000; Hayes and Moulton, 2009) highlighted the tendency for patients to be more similar in their characteristics and the care they receive within clusters than between
clusters (Ukoumunne et aI., 1999; Klar and Donner, 2001; Flynn and Peters, 2004). For example, unit costs in teaching hospitals are typically higher than non-teaching hospitals. Hence, costs often exhibit high intra-cluster correlations (lCCst (Campbell et aI., 2005; Flynn and Peters, 2005a).
Another important conceptual point that studies need to recognise is that the clustering inherent in CRTs is distinct from that in individually-randomised multicentre trials (Donner, 1998; Murray et aI., 1998). In multicentre RCTs, the unit of randomisation is the individual and within each centre patients receive different treatments. On the other hand, when clusters are
randomised, individuals within the cluster are allocated to the same treatment group, as described in Figure 2.1 below. Analytical methods are required that allow for this specific type of
clustering, otherwise they can underestimate the statistical uncertainty and produce incorrect inferences (Feng et aI., 1996; Donner, 1998; Omar and Thompson, 2000; Spiegelhalter, 2001). In addition, when cluster size is correlated with the endpoints, methods that fail to account for clustering may provide biased results (Panageas et aI. 2007).
Secondly, methodological guidance for economic evaluation highlighted that methods developed for analysing clinical outcomes in CRTs may not be directly applicable to CEA that use CRTs (Klar and Donner, 2001; Flynn and Peters, 2005a), which tend to have additional complexities. A key requirement identified in the review was that methods for CEA need to recognise the
correlation between costs and health outcomes (Briggs et aI., 1999; Hoch et aI., 2002; Willan et aI., 2004; Nixon and Thompson, 2005). For example, patients who respond better to treatment may have shorter hospital lengths of stay and lower costs, which implies a negative correlation
4 The degree of clustering is commonly summarised by the intra-cluster correlation coefficient, which indicates the
between individual costs and health outcomes. In CEA that use CRTs, correlation between costs and outcomes may also occur at the cluster-levels. For example, teaching hospitals are often associated with higher quality care and better health outcomes, but also higher mean costs. It is therefore important that methods can simultaneously allow for the clustering and correlation between endpoints, which poses specific requirements for the choice of analytical method (Turner et aI., 2006).
Figure 2.1: Clustering inherent to 2-arm multicentre RCTs and CRTs. The unit of
randomisation (in bold) is the individual in multicentre RCTs and the duster (e.g. hospital) in CRTs
a) 11ulticentre
RCI b)CRTHospital A HospitulB HospitulA HospitalB
HospitalC HospitalD HospitalC HospitalD
Thirdly, the review found that a general concern in CEA is to make appropriate distributional assumptions about cost and outcome data (Briggs and Gray, 1998; Briggs et al., 2005; Manning et al., 2005; Thompson and Nixon, 2005). Often statistical analyses of clinical outcomes are conducted based on the assumption that data are Normally distributed (Lumley et al., 2002; Mihaylova et al., 2011). However, as Nester (1996) emphasised in his Applied Statistician's Creed:
"Many methods assume normality (. .. ) simply assert that such assumption is always false. (. .. ) No
data are normally distributed'.
In CEA in particular, a plethora of studies has urged analysts to recognise that cost data obtained for individual patients in health care interventions are typically highly skewed (Barber and Thompson, 2000; O'Hagan and Stevens, 2003; Nixon and Thompson, 2004; Briggs et al., 2005; Manning, 2006; Mihaylova et al., 2011). This happens because often a substantial fraction of patients are associated with low or zero costs, while a few patients incur very high costs. Hence, it is important that methods for CEA that use CRTs make appropriate assumptions about the distribution of the data while accounting for both the clustering, and the correlation between costs and outcomes.
Fourthly, while CRTs may be preferred for many public health interventions, commentators have drawn attention to the fact that cluster designs can be vulnerable to systematic imbalances in both individual-level and cluster-level baseline covariates (Donner and Klar, 2000; Puffer et al., 2005; Carter, 2010). Those identifying and recruiting individuals into clusters often have foreknowledge of both the treatment allocation and patient characteristics, and this may lead to
example, patients with poor prognostic attributes are more likely to enter the control group (Hahn et aI., 2005).
Unblinded CRTs can, therefore, cause systematic imbalances in important prognostic factors, potentially leading to biased results. This systematic imbalance is distinct from imbalance due simply to chance, which can arise, for example, when small numbers of clusters are randomised. Therefore, statistical methods for CEA that use CRTs are required that appropriately adjust for any anticipated systematic differences in baseline covariates. Even in settings without systematic covariate imbalance, adjusting for important prognostic factors is expected to correct for any potential chance imbalances and improve the precision of the estimates by explaining some of the sample variability (Senn, 1994; Po cock et aI., 2002). In addition, adjusting for covariates can allow the examination of potential subgroup cost-effectiveness effects, which are often of prime interest for policy makers (Sculpher, 2008).
In summary, the conceptual review identified four important statistical issues faced by CEA that use CRTs. While it is recognised that analysts may be concerned with other methodological issues such as censoring or missing data, these were judged to be beyond the scope of this review. This review also focused on CEA that use individual patient data. The findings will help assess the appropriateness of different statistical methods for CEA that use CRTs, as presented in the next section. In addition, these criteria will inform the development of a checklist for critical appraisal of the methods used in practice (research paper 1).
2.3 Review of prospective statistical methods for CEA that use CRTs
Using the criteria developed in the previous section, the conceptual review examined the
methods literature to identify prospective methods for CEA that use CRTs (for further details on the review, please refer to section 2.1). The focus of the review was on statistical methods for analysing continuous endpoints, for example costs and QAL Y s, as these are typically of interest for health policy makers (Gold, 1996; Drummond et aI., 2005).
2.3.1 Hypothesis tests and cluster-level methods
Hypothesis tests are often used for analysing clinical outcomes from CRTs (Donner and Klar, 2000; Hayes and Moulton, 2009). Conventional methods such as the Wilcoxon rank sum test,
two-sample t-test and %2 -tests have been extended to account for the clustering inherent to CRTs
(Donner, 1998; Murray et aI., 1998; Ukoumunne et aI., 1999). However, these standard methods exhibit a number of limitations which make them unlikely to meet all the key criteria for CEA that use CRTs. For example, they lack the flexibility to recognise the correlation between costs and outcomes or to perform covariate adjustment. In addition, previous studies highlighted the fact that hypothesis tests often require particular distributional assumptions such as Normality or equal variances, which are unlikely to be met, for example in the analysis of cost data (Briggs and Gray, 1998; Barber and Thompson, 2000; Mihaylova et aI., 2011).
Cluster-level methods such as summary statistics combining data from different clusters and regression analysis at the cluster-level, can also account for the clustering in CRTs since the units of randomisation and analysis are the same. While these approaches are frequently used in
practice because they are relatively simple to implement, they do not appear appropriate for CEA that use CRTs. The key disadvantage of these methods is the loss of information from collapsing all individual observations within the cluster into a single measure (Donner and Klar, 2000). This poses specific limitations to the methods, for example in adjusting for individual-level covariates or accounting for the correlation between individual costs and outcomes. In addition, cluster-level analyses are only appropriate for CRTs with many clusters and equal numbers per cluster. CRTs with these characteristics are not typically found in practice (Ukoumunne et aI., 1999; Eldridge et aI., 2004; Campbell et aI., 2007).
2.3.2 Net-benefit regression
One of the main limitations of the methods discussed in the previous section was the lack of flexibility to take into account the correlation between costs and outcomes. A simple approach to address this correlation is to collapse the endpoints into a single scale before conducting the estimation. For example, costs and health outcomes can be combined into a univariate measure such as the net monetary benefit (Stinnett and Mullahy, 1998). Then, an estimation method, for
example linear regression, can be applied to this measure (Hoch et aI., 2002). Let cijand eij
represent the costs and outcomes for the ith individual in the jth cluster. The individual net
monetary benefit is determined
asNBij
= eij'A. -cij' whereA.
is the willingness-to-pay for anadditional unit of outcome. A net-benefit regression framework can be described as follows (Hoch et aI., 2002):
where I) is the treatment indicator (1)=0 for control and I for treatment group). The net-benefit is assumed to follow a particular distribution with mean p;B and standard deviation
a
NB. This net-benefit regression approach can allow for the clustering by incorporating a cluster-level random-effect (U;B ), which accounts for the between-cluster variation. While different distributions can be chosen for the net-benefits, Model (l) does not provide sufficient flexibility to make different distributional assumptions for costs versus outcomes. This is an important limitation because costs are typically right skewed whereas outcomes, such as QAL Y s, may have distributions that are left skewed or Normal (Basu and Manca, 20 11). Making inappropriate assumptions about the parametric form of the data may lead to incorrect inferences (Briggs et aI., 2005; Thompson and Nixon, 2005; Nixon et aI., 20 10). In addition, while Model (I) can include covariates, it requires the set of variables for cost and outcomes to be the same (Willan et aI., 2004). In fact, aparticular covariate may be expected to be an important prognostic factor for either costs or outcomes, but not necessarily for net-benefits. Furthermore, because the net-benefit measure is dependent on the ceiling ratio, separate analyses are required for alternative threshold values.
1.3.3 Seemingly Unrelated Regression (SUR)
The limitations of net-benefit regression suggest that a univariate framework is unlikely to satisfy the key criteria for CEA. A more flexible approach to allow for the correlation between costs and outcomes is to consider bivariate modelling (Timm, 2002; Greene, 2003). For example, methods guidance often proposes the use of a system of seemingly unrelated regression
equations (SUR) that allows the error terms to be correlated (Zellner, 1962). The joint estimation of the equations makes full use ofthe available information and can lead to gains in statistical efficiency when compared with equation-by-equation estimation (Greene, 2003). By allowing
the equations to be linked by their error terms, SUR provides a flexible framework for CEA because it recognises the correlation between individual costs and outcomes as described in Model (2.1):
(2.1)
This SUR assumes that the individual error terms (&;,&;) follow a bivariate Normal distribution
(BVN) with mean zero and variances
a;
anda; .
Correlation between costs and outcomes isrecognised through the parameter p . The parameters of interest, incremental costs (PlC) and
incremental outcomes (Pt), can be estimated by ordinary least squares (OLS). SUR can also be
estimated by generalised least squares (GLS), which provides identical estimates to OLS when the same covariates are included for costs and outcomes (Greene, 2003: page 343-344; Willan et aI., 2004). When different covariates are included for costs and outcomes, SUR estimation by GLS can improve statistical efficiency (precision) compared to OLS.
To accommodate the clustering, SUR can be extended to include random effects (Singh and Ullah, 1974), but this is not readily available in conventional software packages. A practical alternative way of addressing the clustering in uncertainty estimates is to report robust standard errors (Wooldridge, 2002) (Appendix 2.1 provides further details on the robust variance
estimator). The main purpose of robust methods is to produce estimators that are not markedly affected by departures from the key assumptions of classical statistical methods (Huber, 2004). However, a potential concern with using robust methods in CEA that use CRTs is that the
Murray et aI., 1998; Omar and Thompson, 2000). Furthermore, another concern with SUR is whether estimates are still unbiased and precise when the model is misspecified, for example, by assuming the error terms to be Normally distributed when costs are highly skewed.
When systematic imbalances are anticipated, covariate adjustment can be easily incorporated in Model (2.1). Unlike net-benefit regression, SUR can allow for the set of covariates to differ for
costs and outcomes, but in Model (2.2) below the same individual ( Xii) and cluster-level (Zj)
covariates are included for each endpoint:
Model (2.2) can also incorporate interaction terms, for example, of treatment with a continuous
individual-level covariate ( xi})' The covariate xi} can be centred on the mean so that ~ and
Pt
are the incremental costs and outcomes, at the covariate mean.
2.3.4 Generalised Estimating Equations (GEEs)
An alternative approach commonly advocated to acknowledge the clustering is to use population-averaged GEEs (Liang and Zeger, 1986). GEEs offer a flexible extension to
likelihood-based generalised linear models for analysing correlated data, and have been generally used in the analysis ofCRTs (Donner and Klar, 2000; Hardin and Hilbe, 2003; Hayes and
Moulton, 2009). GEEs can account for clustering by incorporating a working correlation matrix which treats the elements that define the within-cluster correlation structure as nuisance
conditional approach, i.e. they estimate marginal effects averaged over the population.
Commentators argue, however, that for continuous outcomes, marginal and conditional analyses provide the same point estimates (Lee and Nelder, 2004).
Multivariate GEEs have been developed to recognise potential correlation between two or more endpoints (Lipsitz et aI., 2009). A bivariate GEE for CEA that use CRTs, with an exchangeable correlation matrix can be written as:
(3.1)
A
c pc
"
c= lj 0+ ItJ .+& lj elj =
p;
+ptt
j +&~a a a
LWhere V [
} ",xrI,
] is a symmetrical variance-covariance matrix for the jth cluster, with theeTc~e]
is the standard variance matrix for costseTe
and outcomes for the ith individual, and a = [::,:: ::::] , with
a
being the covariancebetween the individuals i and i ' ( i '# i '), for each end point. Model (3.1) considers an
exchangeable correlation matrix, which assumes that the level of correlation between the different observations within the cluster is the same. However, more complex correlation structures could be assumed such as an unstructured matrix which allows for correlations amongst different individuals within each cluster to differ.
in standard software packages. A simpler alternative is to consider a GEE model with
independent estimating equations which stacks costs and outcomes into a single vector but still allowing separate, independent estimates of incremental costs and outcomes (Hardin and Hilbe, 2001; Hardin and Hilbe, 2003). A bivariate GEE model with independent estimating equations can be described as,
(3.2)
This model structure relies on a general property of population-averaged GEEs, which is that the regression parameter estimates are asymptotically consistent, even if the working correlation matrix is misspecified (Hardin and Hilbe, 2003). This holds as long as the model, i.e. the relationship between the marginal mean and the linear predictor, is correct (Wang and Carey, 2003). Model (3.2) also provides a flexible framework for covariate adjustment, and can include both individual and cluster-level covariates and interaction terms, as described previously for SUR.
Parameter estimates can be obtained by maximum likelihood, assuming that the error terms follow Normal distributions, and provide the same point estimates as OLS estimation. Similar to SUR, a robust estimator for the variance can be considered to allow for clustering when reporting uncertainty (see Appendix 2.1 for further details). A key distinction between the SUR (2.1) and GEEs (3.2) is that the former accounts for correlation between costs and outcomes within the estimation of the parameters of interest. With GEEs, it is recommended that the correlation is acknowledged after the parameter estimation in the robust variance estimator (Williams, 2000; Hardin and Hilbe, 2003: page 30:-31).