[CLIPS] CLIPS Reference Manual, Basic Programming Guide. Software Technology Branch, Lyndon B. Johnson Space Center. CLIPS Version 5.1, September 10, 1991.
[Davis85] D. Y. Davis and E. M. Stearns. Energy Efficient Engine—Flight propulsion system Final Design and Analysis. NASA CR-168219, contract report prepared by General Electric Company, August 1985.
[Hall93] E. J. Hall, R. A. Delaney, and J. L. Bettner. Investigation of Advanced Counterrotation Blade Configuration Concepts for High Speed Turboprop Systems, Task 5 — Unsteady Counterrotation Ducted Propfan Analysis Computer Program User’s Manual, NASA CR-187125, Jan. 1993.
[Hayes89] R. Hayes. UTS: A Type System for Facilitating Data Communication, Ph.D. Dissertation, Department of Computer Science, University of Arizona, August 1989.
[Homer94a] P. T. Homer and R. D. Schlichting. A software platform for constructing scientific applica-tions from heterogeneous resources.Journal of Parallel and Distributed Computing 21, (June 1994), 301-315.
[Homer94b] P. T. Homer and R. D. Schlichting. Using Schooner to support distribution and heteroge-neity in the Numerical Propulsion System Simulation project.Concurrency—Practice and Experience 6, 4 (June 1994) 271-287.
[Khokhar93] A. A. Khokhar, V. K. Prasanna, M. E. Shaaban and C. Wang. Heterogeneous computing: Challenges and opportunities.IEEE Computer 26, 6 (June 1993), 18-27.
[Reed94] J. A. Reed and A. A. Afjeh. Distributed and parallel programming in support of zooming in numerical propulsion system simulation, OAI/OSC/NASA Symposium on Application of Parallel and Distributed Computing, Columbus, Ohio. April 1994.
[Reed93] J. A. Reed. Development of an Interactive Graphical Aircraft Propulsion System Simu-lator. Master of Science Thesis, University of Toledo, August 1993.
[Sunderam90] V. S. Sunderam. PVM: A framework for parallel distributed computing. Concurrency— Practice and Experience 2, 4 (December 1990) 315-339.
[TAE] Transportable Applications Environment Plus. Programmer’s Manual, Version 5.2. Goddard Space Flight Center, National Aeronautics and Space Administration. December 1992.
located at the Lewis Research Center and monitoring an ADPAC run on a node of the Lace cluster. In this prototype, the expert system executes on the same platform as the monitoring tool, since the initial number of rules is small. The system is currently being extended to monitor all instances of ADPAC and allow the user to select all, or a subset, to observe. The expert system can be moved to a separate platform as soon as the complexity of the rules increases to the point where this will be necessary.
4.2 Future Directions
One obvious direction is to modify the source code of ADPAC to allow it to communicate directly with TESS and the monitoring and control system, rather than through its output files. A principal reason for not modifying the source initially is the desire to prove the feasibility of this approach and identify the specific changes desired. There is another positive feature to the approach of using the output files: It would be rel-atively straight-forward to substitute a different high-fidelity fan simulation and provide a similar level of monitoring through watching its output file. This technique allows for easy testing of different fan simula-tions without the initial need to involve the authors of the simulation.
The ADPAC code is currently being re-written to take advantage of parallel machines and workstation clusters. Once this work is completed, the parallel-ADPAC will be tested with the TESS system.
Another zooming approach being studied is to use an intermediate fan simulation, specifically a two-dimensional, axi-symmetric simulation. This has the advantage of not requiring as much execution time as the three-dimensional ADPAC simulation when less accuracy is needed. In addition, it will be possible in some cases to use the solution from the medium-fidelity simulation to jump-start the three-dimensional solution, thus shortening the execution time of the high-fidelity simulation.
Fault detection and fault tolerance techniques are being studied for use with the multiple ADPAC runs. Currently, the system does not gracefully handle the failure of an ADPAC instance. In general, the desired single curve performance map can be created even when one or two ADPAC instances fail, allowing the simulation to proceed. This is an area where rules are needed for the expert system so the user will not have to constantly monitor a long simulation in case a fault occurs.
Acknowledgments
The NPSS project is managed by the Interdisciplinary Technology Office (ITO) at NASA Lewis Research Center (LeRC). This work was performed in part on computing resources at the Advanced Computational Concepts Laboratory (ACCL) and the Computer Services Division (CSD) at LeRC. Thanks are due to G. Follen, C. Putt and C. Miller of LeRC.
References
[AVS92] Advanced Visual Systems Inc. AVS Developer’s Guide (Release 4.0), Part number: 320-0013-02, Rev B, Advanced Visual Systems Inc., Waltham, Mass., May 1992.
[Claus92] R. W. Claus, A. L. Evans, G. J. Follen. Multidisciplinary propulsion simulation using NPSS.4th AIAA/USAF/NASA/OAI Symposium on Multi-disciplinary Analysis and Opti-mization, Cleveland, OH (September 1992).
[Claus91] R. W. Claus, A. L. Evans, J. K. Lylte, and L. D. Nichols. Numerical propulsion system simulation.Computing Systems in Engineering 2, 4 (April 1991), 357-364.
machines on which ADPAC is executing, and the corresponding list of output file names. Schooner’s dynamic configuration library allows watch-dog processes to be started whenever needed by the simula-tion. Once the watch-dog has been started, themonitor_files dispatch is called. This tells the watch-dog the name of the output file to monitor, and starts the infinite monitoring loop. During execution, the watch-dog makes simple procedure calls, for example
residual_report(iteration, max_err);
is called to report the residual from the current iteration. The Schooner system transparently handles com-munications and data conversions among the machines.
4. Current Status and Future Directions
This is an on-going research project. This section describes the current state of the implementation and then outlines some of our plans for expansion of the system.
4.1 Current State
The TESS-ADPAC system has been fully implemented. It has been tested with a subsonic engine model and compared with experimental data from the Energy Efficient Engine. The machine suite used for the tests consisted of a Silicon Graphics Iris 4D/440VGX at the University of Toledo for the TESS system. The ADPAC instances were executed on a variable number of nodes of the Lace cluster, a network of 32 IBM RS6000 workstations located at the NASA Lewis Research Center.
The monitoring tool was originally designed to monitor a single ADPAC instance. This was a result of the original zooming strategy which envisioned a single high-fidelity component simulation used in an iterative approach (see Section 2.1). The monitoring tool has been tested on a Sun Sparc 10 workstation
# starting watch-dog
export monitor_files dispatch( "filename" val string[40]) # residual report
import residual_report prog( "iteration" val integer, "residual" val float) # warning reports
import warning_report1 prog( "message" val string[-]) import warning_report2 prog( "message" val string[-]) # final reports
import mass_in_report prog( "mass_in" val float) import mass_out_report prog( "mass_out" val float)
import pressure_report prog( "pressure_ratio" val float)
import pressure_plot_report prog( "pressure" val array[52] of float) import last_report prog()
ally achieved when the residual has dropped four orders of magnitude, while an oscillating residual is a symptom of a problem within ADPAC. Experience with TESS-ADPAC indicates that convergence is reached in most cases in 500 to 800 iterations. When a computation is finished, the strip-chart on the upper-right shows the pressure plot at 52 points along a slice through the fan. The vertical scales on the upper left report the flow rate of air into and out of the fan. The vertical scale on the lower left shows the final pressure ratio (outlet/inlet) computed by ADPAC. Each of the vertical scales also show the design point provided by the one-dimensional TESS model.
A prototype expert system receives data from the monitoring tool and provides several warning mes-sages to the user in the form of pop-up windows. One example is shown in Figure 8. The monitoring tool uses the C language interface to CLIPS to pass data to the expert system. The pop-up windows, when appropriate, are then triggered by procedure callbacks from CLIPS to the monitoring tool.
Since the source code for ADPAC was not available for this project, the output data files are monitored instead. One of the data files is updated by ADPAC on each iteration during a run to report a number of quantities, including the desired residual, and several types of warnings. One limitation of this approach is an inability to affect ADPAC once execution has started. Thus, the expert system is currently limited to displaying warnings and errors in the monitoring tool, rather than being able to actively steer ADPAC.
To simulate the type of monitoring desired given the constraints, a watch-dog process is created on each machine executing ADPAC. This process uses an infinite loop to continuously check ADPAC’s out-put file for new data. Whenever the file changes, the watch-dog examines the file for values of interest, specifically the residual values from each iteration and warnings of interest to the expert system. It also reads the average results from thembave program at the completion of the ADPAC run.
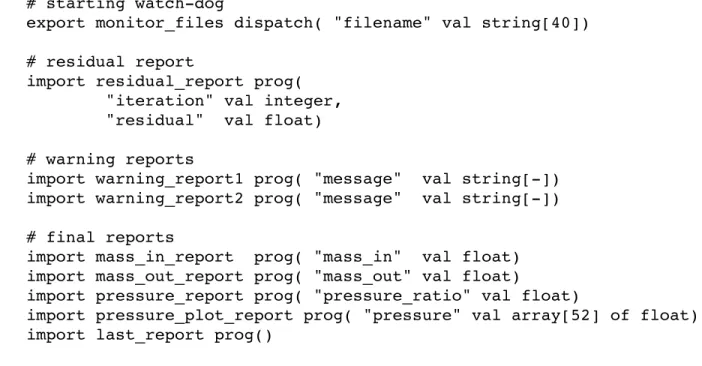
Schooner connects the watch-dog processes to the monitoring tool through the use of UTS specifi ca-tion files. The specification file for the watch-dog process is shown in Figure 9. Animport specification indicates a service the watch-dog process will call from another component, in this case from the monitor-ing tool. An export is a service the watch-dog process provides to the monitoring tool. A analogous specification file is used with the monitoring tool. Each procedure specification lists the arguments using a Pascal-like syntax.
Execution of the watch-dog process is started after the monitoring tool receives from TESS the list of Figure 8: Pop-up warning window
tion and accompanying data exchange library, a set of stub compilers, and a runtime support system. The Universal Type System (UTS) provides both the specification language and the intermediate data represen-tation [Hayes89]. The specification language is machine- and language-independent and is used to describe the interface for each component application. The UTS intermediate data representation provides a medium for exchanging data across machine architectures and handling data structure differences among languages. The stub compilers, one for each supported language, read the UTS specifications and create the interface. The runtime system implements application-level remote procedure call (RPC) control trans-fer between components, as well as configuration and control features. It provides the user with a means of configuring the various applications in the computation, and provides the underlying communication and management support.
3.3 Prototype Monitoring and Control System
To accomplish the immediate research goals, a monitoring tool has been constructed that allows the user to observe the progress of ADPAC runs and provides information to an expert system that can raise several warning panels. The monitoring tool, designed with TAE+, consists of windows for each instance of ADPAC. Figure 7 shows a snapshot of one such window taken at the end of an ADPAC run. The name of the machine executing this instance of ADPAC is shown at the top center of the window. The chart on the lower-right portion is a strip-chart and plots the residual on a log scale over the most recent 100 iterations. The residual provides a measure of how well ADPAC is approaching convergence. Convergence is
pull-down menus, and text fields. Second, there are data-driven objects that graphically display informa-tion from the applicainforma-tion in real time through dials, strip-charts, thermometers, etc. The third category is information objects, such as text displays and help screens that provide the user with information or instructions about the application. The data-driven objects are particularly useful in a monitoring tool as they easily support receiving and reporting of continuous data during execution. A set of pre-defined objects are available that can be used to create vertical and horizontal scales, rotating dials, strip charts, etc. The user can also build objects specific to the application by creating a custom-object using the supplied drawing tools in TAE+ and defining the type of rotational, sliding, stretching, etc. data that will be supplied to the object. The data-driven object was a major reason for selecting TAE+ for this project, as it easily supports the type of monitoring needed for ADPAC.
3.2.2 CLIPS
An expert system built with CLIPS begins with a user-defined set of rules. The rules are written in a func-tional language and describe actions to take when specified conditions occur in the application. Typically, CLIPS supplies a window that displays information to the user about the application and shows the progress of the knowledge engine as the package works through the rules. A C language interface is also available that by-passes the CLIPS window and allows an application to be tied directly to the knowledge engine. This latter feature is being used in this current project. The C interface consists of function calls that pass data to CLIPS and return results from the rules. Callbacks through the C interface allow CLIPS to pass control commands to other components in the system.
3.2.3 Schooner interconnection system
An interconnection system provides a model of computing that connects applications and implements a configuration management system, thus creating ameta-computation [Khokhar93]. Each application con-tains one or several computations that accomplish a specific set of tasks, for example, the TESS or moni-toring tool applications in Figure 6. An application can be developed using the combination of programming language, model, or architecture that is most suitable. Thus, the meta-computation is a heter-ogeneous, distributed program. At runtime, each application exports operations that can be invoked from other applications. For example, the monitoring tool exports operations that can be invoked by instances of ADPAC to report their progress. The interconnection system transparently handles the transfer of data and control among the applications making up the meta-computation.
A meta-computation requires configuration tools to assist the user in starting and controlling the com-ponent applications. The configuration management features of the system give the user both static and dynamic configuration control. Static control allows the user to select the applications that will be needed, such as the expert system and monitoring tools, and to begin execution. Dynamic control then allows applications to be added or removed as needed by the user or through commands issued by the applications themselves. Dynamic control is used by the monitoring tool to establish and break connections with instances of ADPAC.
The Schooner interconnection system realizes this model of scientific computing by supplying a soft-ware configuration and control mechanism for executing heterogeneous distributed computations. There are four, mostly orthogonal, parts to Schooner: a specification language, and intermediate data
representa-more complex rules and the corresponding controls to allow the expert system to actively steer the simula-tion. To realize the immediate goal, the monitoring tool displays information about the progress of each of the ADPAC simulations. The expert system receives data from the monitoring tool and passes back appro-priate warnings to be displayed for the user. The interconnection system provides a transparent means of connecting the different parts into a single application. Figure 6 illustrates this system. For clarity, only one ADPAC instance is shown in the figure. As experience with the system is gained, the expert system will be extended to provide active control, through the interconnection system, of ADPAC and TESS.
3.2 Control System Components
This section presents an overview of the TAE+, CLIPS, and Schooner systems that are used in the monitor-ing tool and expert system.
3.2.1 TAE+
TAE+ is a package that supports the rapid prototyping and construction of X-windows graphical user inter-faces. It provides a workbench that facilitates the design and layout of the application’s windows, allowing easy placement of the various objects within each window. A programming tools package allows the user to add code to the interface to provide program control over the various objects that make up the interface. Finally, a code generator automatically generates code in a number of languages for creating the interface and building the main event loop for the application.
There are three basic building blocks available for use in designing windows for a TAE+ application. The first is a set of user-entry objects that allow the user to interact with the application through buttons,
Monitoring Tool
Expert System
TESS & AVS
ADPAC Fan Simulation
Interconnection System
PVM
•
Monitoring tool constructed using the TAE+ (Transportable Application Environment) package [TAE]•
Expert system constructed using CLIPS (C-Language Integrated Production System) package [CLIPS], and•
The Schooner interconnection system [Homer94a, Homer94b]This section first describes the overall approach to the problem, then gives a description of each system used, and finally presents some details of the implementation.
3.1 Control Strategy
Intelligent monitoring and control is necessary due to the complexity of engine simulations. A large num-ber of variables can affect the outcome of a simulation and monitoring them can place a severe burden on the user. Two types of problems that arise are physically unrealistic boundary conditions imposed on a component and numerical instabilities that arise within a component. One simple example is the addition of fuel to a combustor component. This should result in a rise in temperature through the combustor. As another example, the fan component should produce a rise in air pressure at the outlet. Both of these cases are relatively easy for an expert system to check. A more complicated example arises from numerical instabilities in the fan component. These can produce artificial, numerically-induced vortices in the air flow which reduce the effective area for flow through the fan and cause pre-mature choked flow. An expert system would need more complicated rules to detect such a problem and implement the series of corrective steps needed.
The immediate goal of this research is to build a monitoring and control system that can detect some of these types of problems and warn the user when they arise. The longer-range goal is the development of
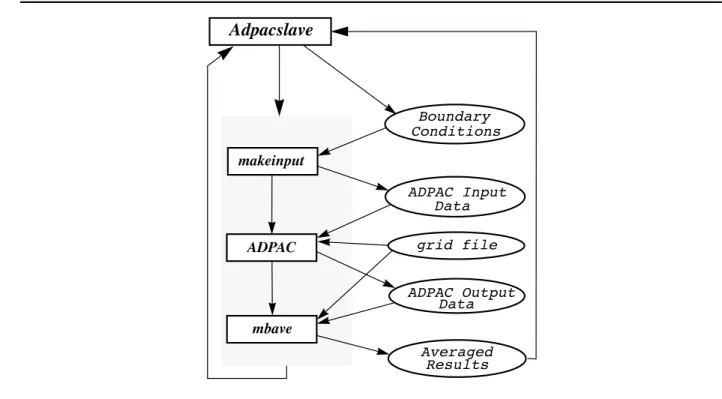
Figure 5: ADPAC code suite flow chart grid file
Adpacslave
ADPAC mbave makeinput Boundary Conditions Data ADPAC Output Data ADPAC Input Averaged ResultsThe source code for ADPAC is maintained by a separate group at NASA Lewis Research Center, and has been unavailable for this project. As a result, the operation of each remote instance of ADPAC requires several codes, illustrated in the flow chart in Figure 5. The first program, makeinput, creates the ADPAC input data file from the boundary parameters. Then, ADPAC executes, reading its grid file and the input data file. The output file produced by ADPAC is then read by the third program,mbave. This is a multi-block averaging program and integrates the three-dimensional flow solution to give the single (space-averaged) flow values which are needed by TESS. The adpacslave program coordinates the execution of the other three programs, and handles the PVM communications with fan Multi-ADPAC receiving the input data formakeinput and returning the results frommbave.
A new performance curve is created byfan Multi-ADPAC each time fan performance data is needed by TESS. To reduce the overall simulation time, the space-averaged values are retained and used to create an overall fan performance map. Before running flow solutions, this data is checked to see if the current oper-ating conditions are within the data range. If so, the data is interpolated and used in the system simulation. In this manner, the simulation time may be significantly reduced. This also has the added benefit of creat-ing an overall fan performance map which can be used in subsequent, non-zoomcreat-ing TESS simulations.
3. Intelligent Monitoring and Control
A monitoring tool and expert system have been designed for use with the TESS/ADPAC simulation. It will provide the user with information about the progress of the simulation and allow the inclusion of rules to steer ADPAC runs and determine when new performance curves are needed. The design of the system is complete and implementation is underway. The following systems are being used:
2.2.2 Advanced Ducted Propfan Analysis Code (ADPAC)
The high-fidelity flow solver program used to model the operation of the fan component is the Advanced Ducted Propfan Analysis Code (ADPAC) [Hall93]. ADPAC is a three-dimensional Euler/Navier-Stokes numerical analysis tool developed to study high-speed ducted propfan aircraft propulsion systems. The program utilizes a three-dimensional, time-marching numerical procedure along with a flexible, coupled 2-D/3-D multiple block geometric grid representation to predict the flow field in and around the fan. Multiple runs of ADPAC are needed to create the single-curve performance map used in the zooming strategy.
2.2.3 Parallel Virtual Machine (PVM)
PVM is a message-passing system that permits a network of heterogeneous Unix computers to be used as a single large parallel computer. Using PVM, a user-defined collection of different computers, known as the virtual machine, is used to provide aggregate power for solving large computational problems
The PVM system is composed of a daemon which resides on all of the computers making up the vir-tual machine, and a library of PVM interface routines which supply user-callable routines. These func-tions, along with the PVM daemon, allow a PVM application on one computer to automatically start up tasks (computational processes) on other computers in the virtual machine and communicate data among the tasks by sending and receiving messages.
2.3 Prototype Zooming System
The prototype zooming system is defined by two suites of codes: The first suite, residing on the user’s workstation, runs AVS and TESS. The second suite consists of ADPAC and associated codes [Reed94]. One instance of this second suite exists for each of the multiple fan simulations used in the zooming strat-egy.
A new TESS engine component module,fan Multi-ADPAC, was created to provide the user interface and functionality for the zooming system. The module
•
Handles the basic AVS data transfer for the fan component within TESS,•
Establishes the PVM virtual machine,•
Spawns the remote ADPAC tasks, and•
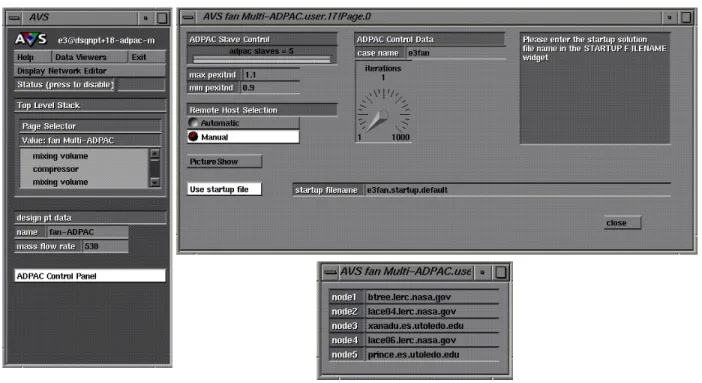
Controls the data transfer between TESS and the ADPAC simulations.To utilize the fan Multi-ADPAC module in a TESS engine simulation, the user defines the ADPAC control parameters and the remote machines on which to spawn the ADPAC simulations. Figure 4 shows the AVS pop-up windows used to accept this input from the user. PVM daemons are started on each remote machine specified by the user to create the virtual parallel machine.
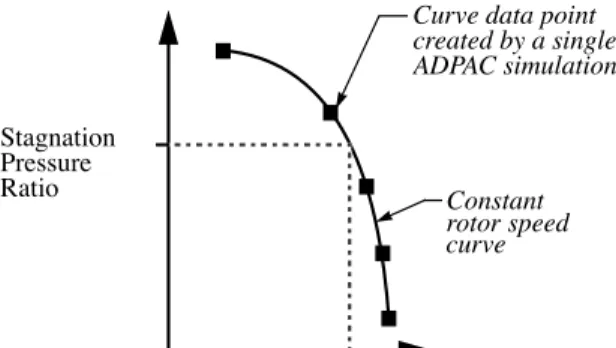
Each time TESS needs fan performance data during a simulation,fan Multi-ADPAC creates the needed remote instances of ADPAC on the virtual machine and sends each its boundary condition parameters.fan Multi-ADPAC then waits for the simulation results. Each result is matched with its boundary conditions, then used to create data points on the performance curve (see Figure 2). Once all the values have been received, the performance curve is interpolated to match the stagnation pressure ratio across the fan, impressed by the TESS simulation, to determine the stagnation temperature ratio and mass flow rate. These values are then used by TESS to continue the complete propulsion system simulation.
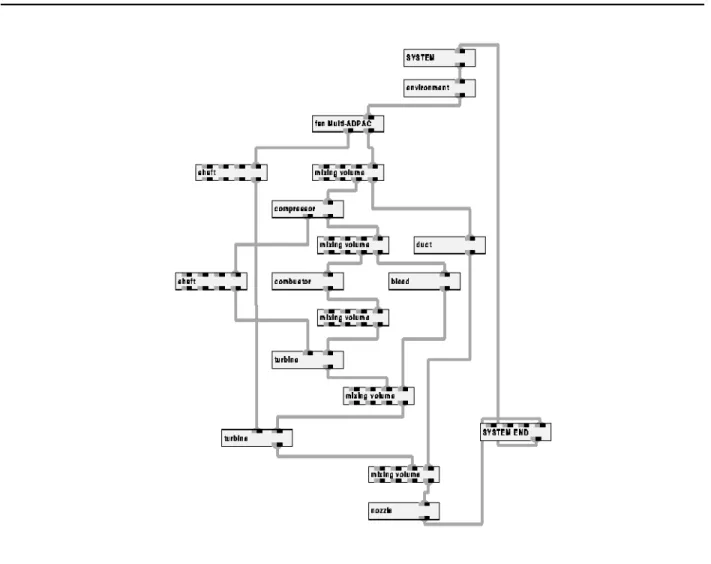
bine, duct, etc.) are represented graphically as AVS module icons, or simplymodules. Each module has a control panel where the operational characteristics of the engine component are defined by the user (e.g., the mass flow rate, design point performance data). An engine is created by selecting the modules needed and placing them in the work space of the Network Editor. The dataflow network is then created by con-necting the modules to establish the physical connections of the engine. Figure 3 shows a typical TESS engine network that models a two spool, two stream turbofan engine.
Once all of the components have been connected and their operational parameters have been entered, the user selects the length of time for the transient, and defines how the governing equations are to be solved numerically for both the state and transient portions of the simulation. Currently, for steady-state solutions, the user may choose either Newton-Raphson or Fourth-order Runge-Kutta methods. For transient solutions, the user may choose either Modified Euler, Fourth-order Runge-Kutta, Adams, or Gear methods. When simulation execution is begun, TESS first attempts to balance the engine at the initial oper-ating point using the steady-state balancing method. Once the engine is balanced, the transient is begun and proceeds up to the number of simulation seconds defined by the user.
the stagnation pressure ratio computed across the engine model. If the values are identical, then the extrap-olated field distributions are proved to be suitable representations and the averaged values of mass-flow rate and stagnation temperature ratio may be used in the one-dimensional simulation.
Typically, however, the averaged stagnation pressure ratio will not initially match the low-fidelity sim-ulator value, and the three-dimensional boundary condition representations must be redefined and the above process repeated until the necessary match is found. An iterative approach to boundary value match-ing was found to be computationally unstable, requirmatch-ing many iterations to achieve a balance. Worse, in many instances, the iterative approach led to an oscillatory mode where convergence could not be achieved.
A solution is the construction of a performance map from multiple runs of the three-dimensional com-ponent. A single-curve performance map, such as that shown in Figure 2, is constructed and the appropri-ate value can then be chosen from the map, interpolating as needed. To shorten the overall time for the simulation, the multiple runs can be performed in parallel when the necessary computational resources are available.
2.2 Simulation Tools
This section presents an overview of TESS and ADPAC. Also presented is PVM [Sunderam90], a mes-sage-passing package, that transfers data and control between TESS and the multiple 3-D fan simulations needed to implement the zooming strategy.
2.2.1 Turbofan Engine System Simulator (TESS)
The low-fidelity system simulator used in the current research is the Turbofan Engine System Simulator (TESS). TESS is an object-based, one-dimensional, transient, thermodynamic aircraft engine simulator which runs under AVS. This integrated system provides the graphical user interface and operating environ-ment for construction of arbitrary engine configurations, selecting and controlling steady-state and tran-sient engine operation, and graphical display of simulation results.
The Network Editor of AVS provides a visual interface for creating dataflow programs. For TESS, the dataflow is used to model the flow of air through the engine. Engine components (e.g., compressor,
tur-Figure 2: Single curve fan map created by zooming Stagnation
Pressure Ratio
Curve data point created by a single ADPAC simulation
Constant rotor speed curve
interconnection system that provides the software framework to connect the various tasks.
Section two describes an engine model that demonstrates zooming on the fan component of NASA’s Energy Efficient Engine [Davis85]. Section three describes the design of a monitoring tool and expert sys-tem that assists the user in executing the simulation and will be used to explore techniques for intelligent control. The last section gives the current status of the project and outlines some of its future directions.
2. Simulation Strategy
The simulation strategy utilizes a high-fidelity flow solver in a low-fidelity simulation, and has been imple-mented in a prototype zooming framework consisting of the following systems:
•
TESS - A propulsion system simulator [Reed93] running with the Application Visualization System (AVS) [AVS92].•
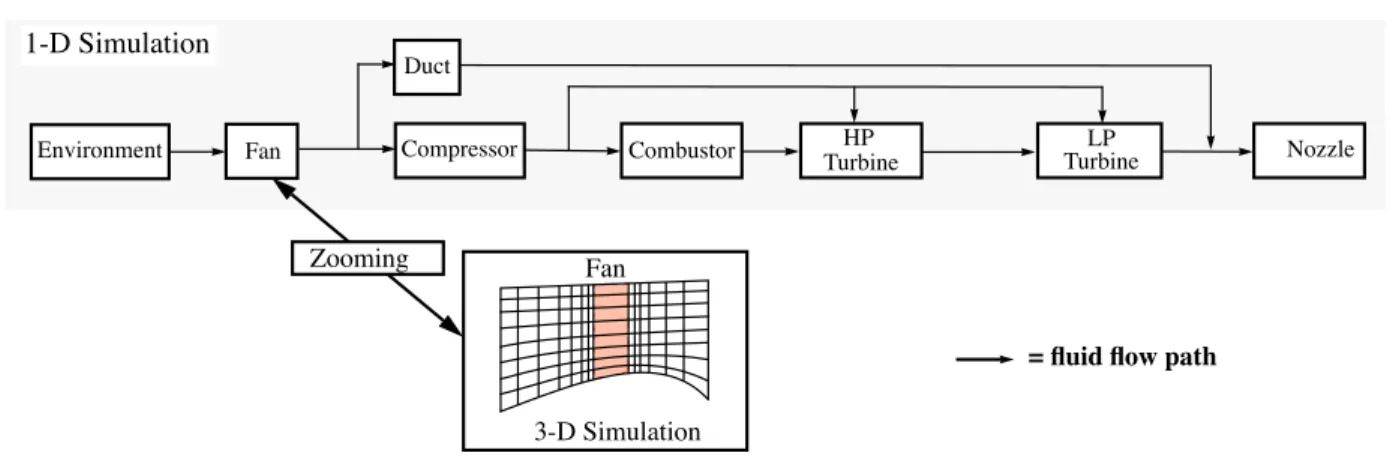
ADPAC - a fully three-dimensional Navier-Stokes/Euler flow analysis package capable of providing detailed flow analysis of the fan component in a turbofan engine [Hall93].This system is depicted in Figure 1. Here the fan component of the one-dimensional “baseline” engine model has been “zoomed” to a three-dimensional analysis.
2.1 Zooming
Implementation of the zooming concept is difficult, due mainly to the inability to accurately resolve high-fidelity data fields from a single value as supplied from the low-fidelity system simulator. In order for the zooming to be accurate, the upstream and downstream boundary values (which are single valued), must be extrapolated to define a suitable three-dimensional distribution of field variables such that when integrated over, the original single-valued boundary conditions are recovered.
This process begins with the single inlet boundary values for stagnation pressure, stagnation tempera-ture, and Mach number, and the exit boundary value of static pressure from the fan component of the one-dimensional engine model. These are then extrapolated to appropriate three-one-dimensional field distributions and applied as boundary conditions to the fan simulation. The results of the fan 3-D simulation are then integrated to determine the mass-flow rate, and the mass-averaged values of outlet/inlet ratios for the stag-nation pressure and stagstag-nation temperature. The averaged stagstag-nation pressure ratio is then compared with
Fan
3-D Simulation
Compressor Combustor TurbineHP TurbineLP Nozzle
Environment Duct Zooming 1-D Simulation Fan = fluid flow path
Development of an Intelligent Monitoring and Control System
for a Heterogeneous Numerical Propulsion System Simulation
1. Introduction
Designing and implementing new propulsion technologies can be an expensive and time-consuming pro-cess. The Numerical Propulsion System Simulation project, sponsored by NASA Lewis Research Center, is bringing new computer simulation techniques and parallel hardware to bear on this problem [Claus92, Claus91]. Specifically, it is fostering the development of parallel simulations to improve both the execution time and accuracy of the simulations. A simulation executive will be developed that will support complete engine simulations made up from improved component simulations. Research on the simulation executive includes developing the monitoring and control techniques needed to manage the simulation, and explor-ing the use of expert systems techniques to assist the user in controllexplor-ing the simulation.
Several key issues must be addressed in the design of the propulsion system simulation. One is the integration of simulation codes at different levels of fidelity. Low fidelity modelling requires empirical data that are not available at the preliminary design stage. On the other hand, high fidelity modelling overcomes this limitation, but at a substantial computational cost. Zooming allows selected components to be mod-elled in detail and integrated into a low-level engine simulation. Additionally, during a low fidelity simula-tion, zooming provides a means of selectively examining in detail the physical processes within components of the engine.
A second issue is the use of a monitoring and control system. A monitoring tool will allow the user to observe the progress of the simulation through displays of its key parameters. An expert system can further improve the simulation by continuously monitoring and actively steering the simulation. This requires sup-port in two areas: The first area is the collection of knowledge and the formulation of rules that govern the design and operation of jet engines. The second area is the integration of expert system software into the simulation executive to assist the user in executing the simulation.
A third issue is heterogeneity. The engine component codes and the expert system take advantage of a variety of vector and parallel platforms, and employ a variety of programming models and languages. An interconnection system allows components to execute on the most appropriate platform with minimum effort on the part of the user and the scientific programmer. The user should not see individual simulations that execute in isolation, but rather a single integrated simulation.
This paper describes a prototype simulation executive designed to address all three issues: zooming, a monitoring and control system, and heterogeneity support. The prototype employs a one-dimensional model of a complete engine. In this model, the operational characteristics of the individual system compo-nents are supplied in the form of performance maps that are constructed from experimental data. To pro-vide descriptions of the physical processes occurring in an engine component beyond that supplied by a performance map, a higher fidelity component simulation is used. The simulation executive uses a moni-toring tool that provides information about the engine simulation to the user and the expert system. Based on this information, the expert system can provide warnings and errors to the user and will be able to actively steer the engine simulation. Heterogeneity is addressed in the simulation executive through an
Development of an Intelligent Monitoring and Control System
for a Heterogeneous Numerical Propulsion System Simulation
1TR 94-25
Abstract
The NASA Numerical Propulsion System Simulation (NPSS) project is exploring the use of computer simulation to facilitate the design of new jet engines. Several key issues raised in this research are being examined in an NPSS-related research project: zooming, monitoring and control, and support for heteroge-neity. The design of a simulation executive that addresses each of these issues is described. In this work, the strategy ofzooming, which allows codes that model at different levels of fidelity to be integrated within a single simulation, is applied to the fan component of a turbofan propulsion system. A prototype monitor-ing and control system has been designed for this simulation to support experimentation with expert sys-tem techniques for active control of the simulation. An interconnection syssys-tem provides a transparent means of connecting the heterogeneous systems that comprise the prototype.
October 4, 1994
Department of Computer Science The University of Arizona
Tucson, Arizona 85721
1This work has been supported in part by the following grants: NSF grant ASC-9204021, NASA grants NGT-50966,
NAG3-1560, and NCC-3-207. Email addresses of authors: John A. Reed ([email protected]), Abdollah A. Afjeh ([email protected]), Henry Lewandowski ([email protected]), Patrick T. Homer ([email protected]), and Richard D. Schlichting ([email protected]).