3D Model Selection from an Internet Database for Robotic Vision
Ulrich Klank, Muhammad Zeeshan Zia and Michael Beetz
Abstract— We propose a new method for automatically ac-cessing an internet database of 3D models that are searchable only by their user-annotated labels, for using them for vision and robotic manipulation purposes. Instead of having only a local database containing already seen objects, we want to use shared databases available over the internet. This approach while having the potential to dramatically increase the visual recognition capability of robots, also poses certain problems, like wrong annotation due to the open nature of the database, or overwhelming amounts of data (many 3D models) or the lack of relevant data (no models matching a specified label). To solve those problems we propose the following: First, we present an outlier/inlier classification method for reducing the number of results and discarding invalid 3D models that do not match our query. Second, we utilize an approach from computer graphics, the so called ’morphing’, to this application to specialize the models, in order to describe more objects. Third, we search for 3D models using a restricted search space, as obtained from our knowledge of the environment. We show our classification and matching results and finally show how we can recover the correct scaling with the stereo setup of our robot.
I. INTRODUCTION
The deployment of service robots into human living en-vironments imposes great challenges for their object recog-nition capabilities. Such robots will know abstractly which objects they have to manipulate namely cups, plates, bowls, pots, etc. But because the appearance of these objects varies substantially it will not know how they look. Also, in case of longterm operations, it will inevitably for a robot to be confronted with situations in which it has to manipulate new kinds of objects. Moreover, since the robot’s task doesn’t end with the detection of the objects’ existence but rather its purpose is manipulating them, in particular to pick them up and place them, having fairly accurate geometric models of them is a valuable resource for reliable and efficient robot operation. The main purposes of such models is the accurate localization of objects in world models, guessing their weight and center of mass, and determining appropriate grasp points for the objects.
In this paper, we propose an integrated robot object recog-nition system that is designed to satisfy these requirements. This vision system operates as follows.
1) Given abstract instructions for the tasks the robot is to perform, the vision system extracts all types of objects that the task refers to, such as cups, plates, etc.
This work was supported by MVTec Software GmbH, M¨unchen and by the cluster of excellence Cognitive Technical Systems (CoTeSys).
U. Klank, M. Z. Zia and M. Beetz are with the Intelligent Au-tonomous Systems (IAS) group, Technische Universit¨at M¨unchen, Boltz-mannstr. 3, 85748 Garching bei M¨unchen{klank, zia, beetz}
@in.tum.de
2) For each object type it looks up a library of geometric 3D object models (in this paper we use Google 3D warehouse for this purpose) and retrieves prototypical 3D models for these object types.
3) Given the prototypical 3D object models, which will only match the objects in the environment to a certain degree and typically lack accurate size specifications, the robot looks for objects in the environment that sufficiently match these 3D models.
4) The vision system then matches the object model to the image in order to select one of the prototypical models as an accurate one for the objects in the environment. 5) The robot presents the objects it has found together with their class labels and the specialized 3D models computed in the last step in order to get them approved by the robot programmer. It also presents the objects that it believes are task relevant but that it could not classify by itself.
6) Upon approval of the object labels and models the ob-ject recognition system computes appearance descrip-tions using environment tailored feature that enable visual popout mechanisms in cluttered scene as well as accurate localization using model knowledge.
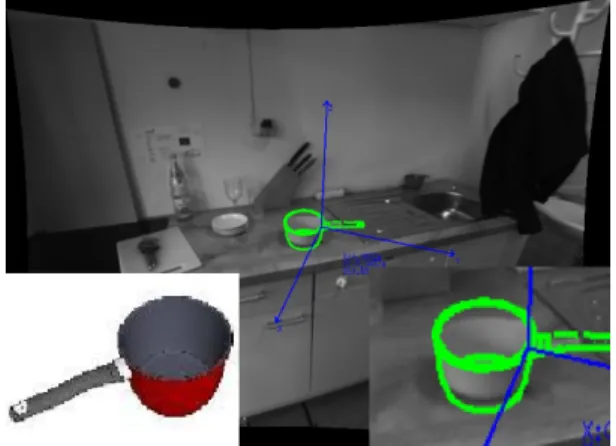
Fig. 1. A scene where a model from internet was found. The lower right corner zooms in on the match. In the left corner the model from the internet, that is used to calculate the shape model on the right.
The key contribution of this paper is a novel vision mech-anism that enables robots to localize objects only knowing their name and some restrictions about their position in a partially known environment. This is especially interesting for a learning phase after deployment of a service robot in a new environment. We present a novel method to estimate the most probable 3D model from a set of models found in object model databases (such as Google 3D warehouse) using an object’s name. The method uses a morphing algorithm that
generates models that better fits variations of objects found in the environment. We show that the specialized models allow state-of-the-art shape matching algorithms with the additional use of some physical and semantic constraints in a known environment to efficiently detect and localize those objects. Fig. 1 shows a “cooking pot” that was found on a known counter in a kitchen environment.
II. RELATEDWORK
We are aiming on localizing a specific but previously un-seen object in order to interact with it which is a challenging task. A possibility to learn relevant information for grasping is to automatically estimate grasping points like it was done by [1] or simply approximating an object with primitives before grasping it [2]. Those approaches are limited by automatic segmentation which is still a problem, especially in range images, see [3]. Another approach is active vision that allows learning of shape or appearance of any object by automatic usage of the action capabilities of the robot for further inspection [4], [5], [6]. This approach involves necessarily changes in the environment that is not always wanted.
A database of 3D objects enables a large set of new possibilities like high level motion planning [7], [8]. One possibility is to learn a specialized database another is to select knowledge from a large database that was specified beforehand by humans, mostly available through internet. Using an internet databases automatically was already done [9], but only using 2D information, namely images. We are extracting 3D models from internet databases. The selection of relevant objects is performed using clustering techniques based on the shape distribution function proposed by [10] and the distance measurement tested in [11] to find out the major cluster of the resulting models. Using a simple k-means algorithm, we are able to select inliers.
For calculating the most probable alignment in the world of such objects and if necessary to generate with morphing new models we align the models using a new Iterative Closest Point(ICP)-based algorithm which we called Volu-metric ICP. The original version was introduced by [12]. We improved this ICP variant for our purposes. In literature, there are several morphing techniques most of them only applicable to closed meshes and are computationally very time consuming. Several of them are discussed in [13].
The last step for our problem is to match many 3D objects in 2D images. This problem was solved before and there are many different state of the art methods like for example [14] which is based on many views of a 3D object. We are using a state of the art 3D shape model matching technique, which is described in [15]. This method matches 3D-CAD-models in an image by simulating the 2D appearance in a model building phase. A range of position relative to the camera must be specified, which can only be done if information about the scene is available. In our kitchen scenario this is given, since we assume all static parts to be approximately known by earlier 3D-Laser scans or similar techniques and are semantically labeled via methods like [16].
III. METHOD
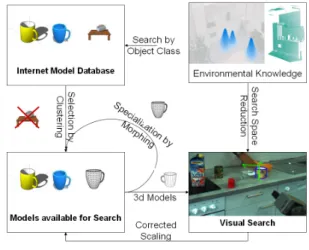
An overview of our method is sketched in Fig. 2. We think here of scenarios like a robot is deployed in a pre-viously unknown environment, a human gives the robot a certain command including previously unknown words or an automatic acquired action plan from the internet has to be executed like sketched in [17]. The two last scenarios require object recognition using class labels. Those object classes are organized in a specialized hierarchy derived from OpenCyc.
Fig. 2. Overview of the method.
A. Internet Search
Given a search string specifying an object (things like “mug”, “cooking pot” or “frying pan”), we just pass this string to an internet search engine for 3D models. Since we used for tests Google Sketchup we additionally had to convert the models to another format, since the Sketchup file format is binary and does not allow direct access to the mesh information. The process of searching, downloading and converting is done completely automatically. Normally, the results are quite good, and contain only few outliers, further tests are restricted to the first 12 results (first result page). This restriction is caused by the decreasing relevance of the search results and the fact that 12 models already give a good overview of what kind of models exist in the database.
B. Inlier Search
Assuming that there are more inliers than outliers in the results we want to select the largest cluster as inliers. To find similarities between 3D models we use the shape distribution function proposed by [10]. This feature is calculated by randomly selecting points on faces of a model and describes the shape of the model. We are using k-means introduced by
[18] for clustering. Caused by the outlier quote we usek=4
clusters, since we expect maximally 3 types of outliers. This step is also performed unsupervised and results in a set of 4-9 models.
The results from the internet search normally contain 20-40 percent outliers. We want to recognize them, before starting any further postprocessing, or at least group the
models in order not to align to different models. Actually, there are three different types of outliers in the results. First, ambiguities of the search string that result in different objects than meant. For example “cup” could mean a trophy or a liquid container. Second, assembled scenes containing the right object, for example an oven with a “cooking pot” on it. And third, wrongly labeled objects or semantically close models additionally showed by the search engine if there were no better matches. An example for this is a fork found searching for “spoon”.
C. Model Postprocessing
In order to get a broader range of objects we use morphing to generate new models between two inlier models, this enables the approach to specialize models in objects in our environment. A morphing process in computer graphics usually requires an operator that specifies the appropriate orientation, scaling, and translation of the starting and the destination models. However, as we wish to perform every-thing automatically we need a good initial alignment first. Then we need to rotate one of the models, so that it is aligned with the other one before the morphing process can take place. For this we use Iterative Closest Point algorithm proposed by [12].
1) Initial Alignment: We use the technique presented [10] to form a histogram of distances between randomly selected points on the model-surface, and then pick the most commonly occurring distance (actually the middle point of the most frequent bin) and scale that distance to a constant value and the whole model is scaled isotropically. A similar technique is used for finding a statistical centroid and translating both the models so that the centroid lies at their origin. The quality of the following ICP depends on the initial alignment, so actually Eq. 2 in the following section is minimized over a set of initial alignments. Initial alignments are relative rotation of the smallest cube around the model by +-90 degree in each cartesian direction.
ε= arg min
PCi
M1,M2∈Rotall
+δPCMi1,M2 (1)
2) Volumetric Iterative Closest Point Algorithm: How-ever, ICP works for only dense point-clouds; while the 3D models have only vertices (of the triangulated faces) which can be directly used for ICP. These vertices are densely packed at places where a lot of curvature is present in the model; and very few of these are present for comparatively flat surfaces. Thus, even if the curved surface has a small area, its alignment is given more weight by the ordinary ICP, as compared to a more planar surface with large area - which should not be the case. Thus, we use the technique presented by [10] to form such a dense point-cloud which has a distribution of points proportional to the surface area of the faces.
We are minimizing the distance between
corresponding points. The distance δ between two
models M1 and M2 of size |M1| and |M2| is
given by an initial set of point correspondences
PC = [(P0,M1,P0,M2),(P1,M1,P1,M2)..(P|M1|,M1,P|M1|,M2)],
and the Euclidian distance between two pointsd:
δ(PCM1,M2) =
|PCM1,M2|
∑
i=0d(Pi,M1,Pi,M2) (2)
The set of point correspondences is calculated simply: to every point of the smaller model the closest point is taken as correspondence. This result in:
PCM1,M2 =∀Pi∈M1 arg min Pj∈M2
d(Pi,Pj)
Of course this can be optimized by only having few matching candidates per point by using to a hierarchical grid in the 3D world.
3) Morphing: The result of the ICP is an injective map-ping of points of the first model to the second. So we are able to linearly interpolate from all source points to the destination points, which define the morphing path. Any point on the global morphing path is a new model. This model then consists of the points Pmor phed,i =εPsource,i+ (1−ε)Pdest,i
where Pdest,i is the closest point in the destination model
toPsource,i in the source model. Normally, we use the model
on half way of this morphing path (ε=0.5).
D. Final Detection
Our final detection is based on the 3D shape matching proposed by [15]. This approach uses 3D models to calculate all necessary shape appearances and searches then for them in an image. This makes it necessary to restrict the search space. Since we estimate the final size of found objects we need a calibrated stereo setup. We also need an approximated position of the object, to calculate beforehand all relevant possible views. Simply calculating all views is not efficient and will probably use more than the available memory of any machine.
1) Model imposed view reductions: Any model we get from the internet already appears in a very probable position for finding it again in the world. For most kitchen objects we found in the internet we see that they are somehow laying on supporting plane which is the xy-plane in the 3D model coordinates. And the model is laying in a way like it is expected to lie in a normal environment. This is of course an assumption and we do not rely completely on it, but we assume that the majority of the models are aligned such a way.
2) World imposed view reductions: In our kitchen domain we assume that we have a box model of the major com-ponents of our world. And in case we are looking for an object we can expect an object position in one of several positions, like on the table, on the counter, in the fridge or in the cupboard. For all positions we can approximate a relative mean-position of the object relative to the robot inspecting this area. This will be the reference pose, of an object combined with the zero pose given by the object itself. Around this pose an uncertainty has to be specified that increases the search space such that all relative positions
are in it. The expected distance of the object has to be adapted additionally, since the scaling of the model does not correspond to the real object. We increase the distance search space by 20 percent.
3) Detection: For the detection we pass an image to a shape based matching algorithm. We use a previously trained model that includes all views that could not be excluded by the view reductions. Details of the approach can be found in [15]. Shortly resumed and simplified, the model building phase includes the projection of edges of model in all relevant views and the calculation of self occlusions. The edges that are between face that have an angle smaller than 30 degree are ignored during this process. The matching uses a pyramid-based-approach to find candidates for matches and tracks them to the lowest level. A quality threshold limits the number of candidates. The more edges a model contains the lower this threshold is set. The threshold describes the percentage of pixels of the model that can be matched with edge pixels in the image. The edge pixels are calculated with a Sobel-filter and must be over a certain threshold to be counted.
4) Localization: During localization the position vector which is result of the detection has to be scaled correctly. This can be done either monocular, as soon as the size of the real object correspond to the size of the model or with a stereo setup. In a stereo setup we use the disparity that we can calculate using either two matches of the model in a left and a right image, or by finding the model once and calculating for the region of interest the disparity using a template matching like normalized cross correlation. This method can only applied to well textured image regions. The
distancez1of any point from the first camera of a stereo setup
with focal lengths f1and f2and relative distance of the two
cameras after rectification d12 can be calculated using the
disparity dpix by z1= dd12pixf1. Using this information we can
scale the pose which we got from the matching algorithm relative to the camera. The z component of the result of
the algorithm zresult is the distance from the camera plane,
which means that the scaling factor fscale is fscale=zZ1
result. This factor can be used to adapt the model and connect it with the real object that was found. That includes dividing all length measurements by this factor. Afterwards, the detection of this object can be done also monocular.
IV. RESULTS
For proof of concept, we now show a few of the clustering and selection results. Then we show a morphed model to visualize the difference from the original models. We also indicate the detection of relative position of models in real-life images. Finally, we show an example where our robot corrects automatically the scaling of a 3D model through stereo triangulation in our kitchen environment. Last, we show a complete search for several models in several images acquired by our robot moving its pan-tilt unit.
(a) (b) (c) (d) (e)
(f) (g) (h) (i)
(j) (k) (l)
Fig. 3. The resulting four clusters for the query for “mug”, a - e are inliers, all the other are classified as outliers (clusters are f-i, j-k and l).
(a) (b) (c) (d) (e)
(f) (g) (h) (i)
(j) (k) (l)
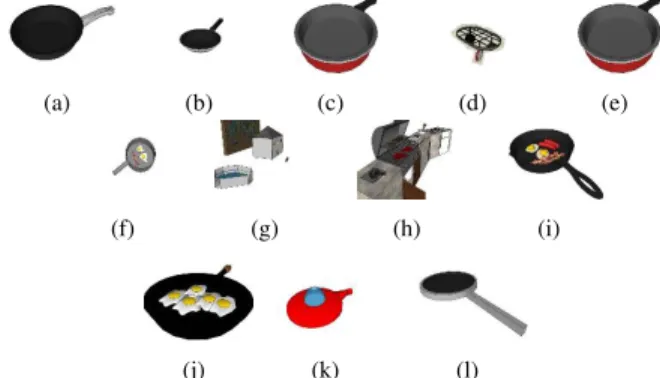
Fig. 4. The resulting four clusters for the query for “pan”, a - e are inlier, all the other are classified as outliers (clusters are f-i, j-k and l).
A. Model Selection
In Fig. 3 there are results of our clustering searching for “mug”. It can be seen, that the first and largest cluster (Figures 3(a), 3(b), 3(c), 3(d) and 3(e)) contains results that can be reasonable counted as inliers. Some good matches were classified as outliers, like all entries of the second cluster (Figures 3(f), 3(g), 3(h), and 3(i)) are thrown out. Since the target is to reduce the number of wrong models and condense to the most probable models, this can be seen as a good result. Another good result can be seen in Fig. 4. For pans, the total number of unwanted models is higher. The unwanted models are mainly collection of different objects including a pan, e.g. cluster two with Figures 4(f), 4(g), 4(h) and 4(i). Table I gives a statistical overview how often certain errors occurred in our queries. We counted here manually for 10 queries the occurring errors and the classification results, including the referenced three for “mug”, “frying pan” and “cooking pot”. Easily can be seen that we improve the quote of inliers by the selection, in our test from 60% to 79%. The error types are defined in Section III-B.
B. Detection of Objects
To show that more or less random models of kitchen objects can be detected we used models of pans and knifes from the internet and also images of pan from Google Images to check if it is possible to detect those, too. See Fig. 5(b) for a pan that was matched in a simple image and see Fig. 5(a) for several pans and a knife, which were the best matches for a search with manually specified distance and rotation range.
(a) Several matches in a complex scene (b) Simple image. Fig. 5. Application of a pan and knife models to different images
(a)Image of a real pot (b)Morphed model (c)Source model (d)Destination model Fig. 6. An example for an real pot that better fits a morphed model
(a) Left camera image. (b) Right camera image. Fig. 7. A counter in our kitchen, stereo, calibrated and rectified
1) Morphing: In Fig. 6(a) we show an image of a real pot that did not match any of the models found for pot. By morphing from the model displayed in Fig. 6(c) to the model showed in Fig. 6(d) we got a model much more similar to the image. This result can be seen in Fig. 6(b). The points of the source model are moved towards their best matches in the destination model. Those were calculated by the volumetric ICP.
C. Localization of Objects
In order to validate our approach we want to localize a mug in a cluttered scene. Fig. 7(a) and Fig. 7(b) show rectified images of a kitchen scene. We assume here partial knowledge of the scene and the robots location. This allows us to derive the position restrictions for a search: the distance between camera and objects is between 80 cm and 1 m 60 cm. The expected view are all rotations around the z axis of the object that is expected to be the most probable top direction of the models. A small amount of noise in other rotations are allowed. We are using here the first match from the internet search, see Fig. 3(a). In Table II the position of the best match that was measured monocular with both cameras. Fig. 8(a) and Fig. 8(a) show that the match was correct. The match is consistent in both views by not consistent with the stereo calibration. This means, we are able to use this inconsistency for estimating the correct 3D position of the marked mug.
D. A Complete Search Sequence
To finally prove if our approach is feasible to an au-tonomous system we tested it in the following scenario:
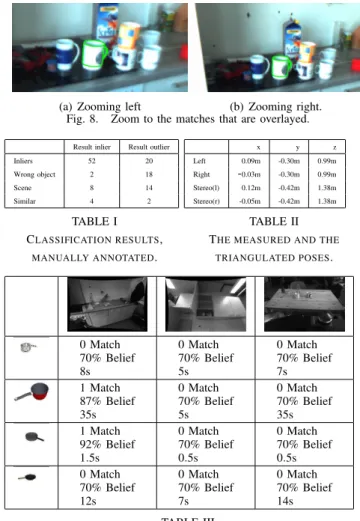
(a) Zooming left (b) Zooming right. Fig. 8. Zoom to the matches that are overlayed.
Result inlier Result outlier Inliers 52 20 Wrong object 2 18 Scene 8 14 Similar 4 2 TABLE I CLASSIFICATION RESULTS, MANUALLY ANNOTATED. x y z Left 0.09m -0.30m 0.99m Right -0.03m -0.30m 0.99m Stereo(l) 0.12m -0.42m 1.38m Stereo(r) -0.05m -0.42m 1.38m TABLE II THE MEASURED AND THE
TRIANGULATED POSES. 0 Match 70% Belief 8s 0 Match 70% Belief 5s 0 Match 70% Belief 7s 1 Match 87% Belief 35s 0 Match 70% Belief 5s 0 Match 70% Belief 35s 1 Match 92% Belief 1.5s 0 Match 70% Belief 0.5s 0 Match 70% Belief 0.5s 0 Match 70% Belief 12s 0 Match 70% Belief 7s 0 Match 70% Belief 14s TABLE III
THE CALCULATION TIME PER MODEL FOR MATCHING IT IN THE IMAGES.
1582 Faces 6660 Faces 344 Faces 1534 Faces 25min58s 1h35min15s 2min2s 17min16s
TABLE IV
THE MODEL BUILDING TIME FOR THE FOUR POTS
the robot gets the command to find a pot on the counter, in the cupboard or on the table. The current position of the robot is known, and allows by simple camera rotation to see all three places. Table IV shows the running time for the model generation and Table III the search and the results. The first column shows the time needed for model building, that includes the views for the three later search locations. The relevant positions covered half of the sphere that specifies the possible views on the object, but since the three search locations all had a similar distance to the robot the distance range that had to be precalculated was relatively low. Our result here is that we found the pot with two models correctly, and did not find an object if there was none present. The Belief in Table III specifies the certainty the matches algorithm returns, that means that for further manipulation the third pot was selected. The attached video shows the scenario. The results of a similar experiments searching plates can be found in Table V. Here can be seen the potential of the method to deal with uncertainties: First, several models confirmed the same correct object position,
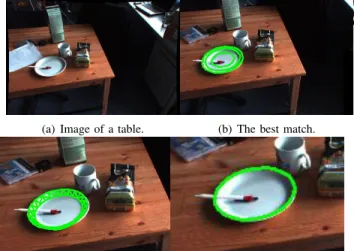
(a) Image of a table. (b) The best match.
(c) The second match. (d) The third match. Fig. 9. Results with plates.
Model(Faces) Time Model Time Search Matches/Score Remarks Plate 0(188) 201 s 0.65s 1/0.98 Fig. 9(b) Plate 10(22) 76 s 0.20s 1/0.97 Fig 9(d) Plate 9(258) 296 s 1.89s 1/0.86 Fig 9(c) Plate 4(332) 112 s 0.67s 1/0.83 mismatch Plate 7(120) 223 s 1.09s 1/0.78 Plate 3(118) 80 s 0.32s 1/0.76
Plate 8(626) 326 s 1.24s 0/0.70 outlier, no match TABLE V
RESULTS FOR PLATES ON A CLUTTERED TABLE.
which allows to detect wrong matches. Also models are more probably outlier themself, if they do not support the most probable hypothesis. 9(a) shows the image of the table that was processed. Fig. 9(b) to 9(d) show several models matched at the same position.
Summarizing the results, the approach allows to improve the autonomy of service robots, because it enables the robot to detect and localize unknown objects. We do not show a complete empirical evaluation, but our results give an idea that with state of the art matching methods it is possible to find objects only having approximated models. We have in this test a low false-positives rate, which is necessary for application to real world scenes. Still, the large number of faces of many models imposes a problem to the matching algorithm.
V. DISCUSSION ANDCONCLUSIONS
We presented an approach to obtain 3D models automati-cally from online databases and used these for object recogni-tion and localizarecogni-tion without user interacrecogni-tion. This allows our robot to act more autonomously in a kitchen environment. We showed that we can generate new models (by morphing) to have a larger set. Our tests were restricted to kitchen tools, since we test the system in our ”aware” kitchen scenario. We see the 3D model search as a starting point for segmentations and for building up simpler descriptions of the world. Our approach needs some time to calculate, so the search for a new object does not compete with human performance now. But given we can save the model generation phase or calculate it offline, the online matching would be fast enough for interaction with the world. We also see this only as a
starting point for further specialization process that learns specific shape or visual descriptor models from the images with the already located objects that will allow realtime interaction.
REFERENCES
[1] A. Saxena, J. Driemeyer, and A. Ng, “Robotic Grasping of Novel Objects using Vision,”The International Journal of Robotics Research, vol. 27, no. 2, p. 157, 2008.
[2] A. Miller, S. Knoop, H. Christensen, and P. Allen, “Automatic grasp planning using shape primitives,”IEEE International Conference on Robotics and Automation (ICRA), 2003, vol. 2, pp. 1824–1829 vol.2, Sept. 2003.
[3] R. B. Rusu, A. Sundaresan, B. Morisset, M. Agrawal, and M. Beetz, “Leaving Flatland: Realtime 3D Stereo Semantic Reconstruction,” in Proceedings of the International Conference on Intelligent Robotics and Applications (ICIRA) 2008, October 15-17, Wuhan, China, 2008. [4] G. Kootstra, J. Ypma, and B. de Boer, “Active exploration and keypoint clustering for object recognition,”IEEE International Conference on Robotics and Automation (ICRA), 2008, pp. 1005–1010, May 2008. [5] A. Ude, D. Omrcen, and G. Cheng, “Making object recognition an
active process,”International Journal of Humanoid Robotics (IJHR), vol. 5, no. 2, 2008.
[6] P. Forssen, D. Meger, K. Lai, S. Helmer, J. Little, and D. Lowe, “Informed visual search: Combining attention and object recognition,” IEEE International Conference on Robotics and Automation (ICRA), 2008, pp. 935–942, 2008.
[7] K. Okada, M. Kojima, S. Tokutsu, T. Maki, Y. Mori, and M. Inaba, “Multi-cue 3D object recognition in knowledge-based vision-guided humanoid robot system,”IEEE/RSJ International Conference on In-telligent Robots and Systems (IROS), 2007., pp. 3217–3222, 2007. [8] A. Morales, T. Asfour, P. Azad, S. Knoop, and R. Dillmann,
“Inte-grated grasp planning and visual object localization for a humanoid robot with five-fingered hands,” inInternational Conference on Intel-ligent Robots and Systems (IROS), 2006, Beijing, China, 2006. [9] R. Fergus, L. Fei-Fei, P. Perona, and A. Zisserman, “Learning Object
Categories from Googles Image Search,” Tenth IEEE International Conference on Computer Vision (ICCV), 2005., vol. 2, 2005. [10] R. Osada, T. Funkhouser, B. Chazelle, and D. Dobkin, “Shape
distri-butions,”ACM Transactions on Graphics (TOG), vol. 21, no. 4, pp. 807–832, 2002.
[11] E. Wahl, G. Hillenbrand, and G. Hirzinger, “Surflet-pair-relation his-tograms: a statistical 3D-shape representation for rapid classification,” Proceedings. Fourth International Conference on 3-D Digital Imaging and Modeling (3DIM), 2003., pp. 474–481, 2003.
[12] P. Besl and H. McKay, “A method for registration of 3-d shapes,”IEEE Transactions on Pattern Analysis and Machine Intelligence, vol. 14, no. 2, pp. 239–256, Feb 1992.
[13] F. Lazarus and A. Verroust, “Three-dimensional metamorphosis: a survey,”The Visual Computer, vol. 14, no. 8, pp. 373–389, 1998. [14] R. Hoover, A. Maciejewski, and R. Roberts, “Pose detection of
3-d objects using s2-correlate3-d images an3-d 3-discrete spherical harmonic transforms,”IEEE International Conference on Robotics and Automa-tion (ICRA), 2008, pp. 993–998, May 2008.
[15] C. Wiedemann, M. Ulrich, and C. Steger, “Recognition and tracking of 3d objects,” inPattern Recognition, ser. Lecture Notes in Computer Science, G. Rigoll, Ed., vol. 5096. Berlin: Springer-Verlag, 2008, pp. 132–141.
[16] R. B. Rusu, Z. C. Marton, N. Blodow, M. Dolha, and M. Beetz, “Towards 3D Point Cloud Based Object Maps for Household Envi-ronments,”Robotics and Autonomous Systems Journal (Special Issue on Semantic Knowledge), 2008.
[17] M. Beetz, F. Stulp, B. Radig, J. Bandouch, N. Blodow, M. Dolha, A. Fedrizzi, D. Jain, U. Klank, I. Kresse, A. Maldonado, Z. Marton, L. M¨osenlechner, F. Ruiz, R. B. Rusu, and M. Tenorth, “The assistive kitchen — a demonstration scenario for cognitive technical systems,” inIEEE 17th International Symposium on Robot and Human Interac-tive Communication (RO-MAN), Muenchen, Germany, 2008, invited paper.
[18] E. Forgy, “Cluster analysis of multivariate data: Efficiency vs. inter-pretability of classifications,” 1965.