913990
3
SUPERVISOR’S USE ONLY9 1 3 9 9
© New Zealand Qualifications Authority, 2020. All rights reserved.
Level 3 Economics 2020
91399 Demonstrate understanding of the efficiency of
market equilibrium
2.00 p.m. Friday 4 December 2020 Credits: Four
Achievement Achievement with Merit Achievement with Excellence
Demonstrate understanding of the
efficiency of market equilibrium. Demonstrate in-depth understanding of the efficiency of market equilibrium. Demonstrate comprehensive understanding of the efficiency of market equilibrium.
Check that the National Student Number (NSN) on your admission slip is the same as the number at the top of this page.
You should attempt ALL the questions in this booklet.
If you need more room for any answer, use the extra space provided at the back of this booklet. Check that this booklet has pages 2–11 in the correct order and that none of these pages is blank.
YOU MUST HAND THIS BOOKLET TO THE SUPERVISOR AT THE END OF THE EXAMINATION.
ASSESSOR’S USE ONLY
TOTAL
Tick this box if there is no writing in this booklet
QUESTION ONE: Protecting local industry
Two policy options for the Government, if it wishes to protect local industry, are
imposing tariffs on imported goods, or subsidising the production of New
Zealand-made goods that compete with imported goods.
Graph One: A market for an imported good
with a tariff imposed (price taker model)
Price ($) Quantity Pw + tariff Pw a h Q1 Q2 Q3 Q4 S D b d e f c g
Graph Two: A market for a locally-made good
with a subsidy
Price ($) P5 P1 P2 P4 P3 D S + subsidy S a b c ASSESSOR’S USE ONLYCompare and contrast the impacts of imposing a tariff on imported goods with the impacts of subsidising the production of New Zealand-made goods.
In your answer, refer to Graph One and Graph Two, and explain, in detail: • the impact of both policies on consumer surplus
• the impact of both policies on allocative efficiency
• which of these two policies will be more beneficial for the producers of New Zealand-made goods who compete with overseas producers.
ASSESSOR’S USE ONLY
QUESTION TWO: Taxes on alcohol
Excise taxes on alcohol are adjusted annually to reduce consumption and the negative
impacts of excessive drinking.
Source (adapted): https://www.customs.govt.nz/about-us/news/important-notices/new-excise-duty-rates-for-alcohol -from-1-july-2019/ 0 20 40 60 80 100 120 2.80 2.90 3.00 3.10 3.20
Graph Three: The market for an alcoholic drink after a 20c / litre tax increase
Price ($ / litre)
Quantity (thousand litres) S + tax increase S D Pe Qe ASSESSOR’S USE ONLY
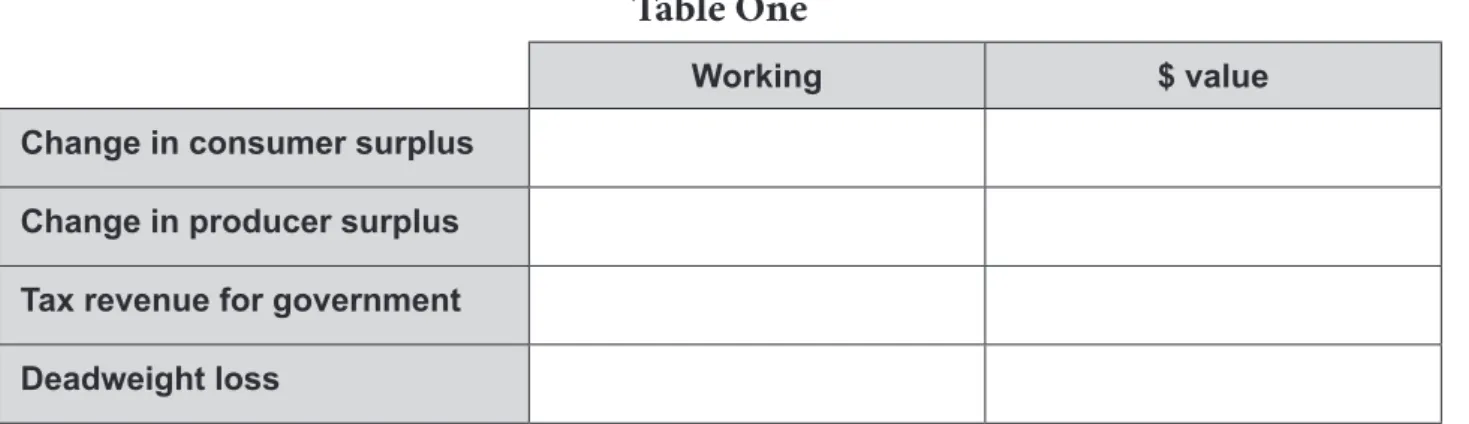
(a) Refer to Graph Three to calculate the values in the table below, specifying an increase or decrease. Space for working is provided.
Table One
Working $ value Change in consumer surplus
Change in producer surplus Tax revenue for government Deadweight loss
(b) Explain, in detail, the impact of the tax increase on consumer surplus. Refer to Graph Three and Table One in your answer.
(c) Explain, in detail, the impact of the tax increase on producer surplus. Refer to Graph Three and Table One in your answer.
Please turn over ➤
ASSESSOR’S USE ONLY
(d) Compare and contrast the impact of the tax increase on consumers and producers of the alcoholic drink in Graph Three.
In your answer:
• explain, in detail, whether the tax increase will have a greater impact on consumer surplus or producer surplus
• refer to Graph Three and Table One, and the price elasticity of demand for alcohol.
ASSESSOR’S USE ONLY
This page has been deliberately left blank. The examination continues on the following page.
QUESTION THREE: The New Zealand housing market
Despite a significant increase in the total number of houses, New Zealand still has a
shortage of affordable houses. Due to population growth, the increase in the supply of
houses is not matching the increase in demand for houses.
Source (adapted) : http://www.scoop.co.nz/stories/BU1907/S00495/new-zealands-housing-shortage-is-getting-worse -not-better.htm
Graph Four: The New Zealand housing market
with a shortage at price P
1Price ($) Quantity Pe P1 S D Qe Q1 Q2 1 6 5 7 3 4 2
(a) Use the numbers from Graph Four to identify the: (i) consumer surplus at P1:
(ii) producer surplus at P1:
(iii) deadweight loss at P1:
(b) Assume the price is initially at P1 in the New Zealand housing market. Explain, in detail, how
house prices and the shortage of houses would be affected if market forces were operating freely. Refer to Graph Four in your answer.
ASSESSOR’S USE ONLY
(c) Compare and contrast the impact on consumer surplus, producer surplus, and allocative efficiency if equilibrium is restored in the New Zealand housing market. Refer to Graph Four in your answer.
ASSESSOR’S USE ONLY
ASSESSOR’S USE ONLY QUESTION
NUMBER
Extra space if required.
ASSESSOR’S USE ONLY QUESTION
NUMBER
Extra space if required.