MEDICARE
PHYSICIAN
PAYMENT
Care Coordination
Programs Used in
Demonstration Show
Promise, but Wider
Use of Payment
Approach May Be
Limited
February 2008
What GAO Found
Why GAO Did This Study
Congress mandated in 2000 that the Centers for Medicare & Medicaid Services (CMS) conduct the Physician Group Practice (PGP) Demonstration to test a hybrid payment methodology for physician groups that combines Medicare fee-for-service payments with new incentive payments. The 10 participants, with 200 or more physicians each, may earn annual bonus incentive payments by achieving cost savings and meeting quality targets set by CMS in the demonstration that began in April 2005. In July 2007, CMS reported that in the first performance year (PY1), 2 participants earned combined bonuses of
approximately $7.4 million, and all 10 achieved most of the quality targets. Congress mandated that GAO evaluate the demonstration. GAO examined, for PY1, the programs used, whether the design was reasonable, and the potential challenges in broadening the payment approach used in the demonstration to other physician groups. To do so, GAO reviewed CMS documents, surveyed all 10 groups, and conducted interviews and site visits.
What GAO Recommends
CMS should provide participating physician groups with interim summary reports that estimate participants’ progress in achieving cost-savings and quality-of-care targets. CMS agreed with the intent of GAO’s recommendation.
All 10 participating physician groups implemented care coordination
programs to generate cost savings for patients with certain conditions, such as congestive heart failure, and initiated processes to better identify and manage diabetes patients in PY1. However, only 2 of the 10 participants earned a bonus payment in PY1 for achieving cost savings and meeting diabetes quality-of-care targets. The remaining 8 participants met most of the quality targets, but did not achieve the required level of cost savings to earn a bonus. Many of the participants’ care coordination programs were not in place for all of PY1. CMS’s design for the PGP Demonstration was generally a reasonable
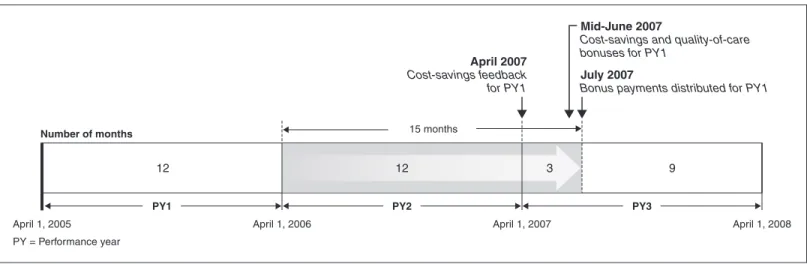
approach for rewarding participating physician groups for achieving cost-savings and quality-of-care targets, but created challenges. CMS’s decision to use comparison groups, adjust for Medicare beneficiaries’ health status, and include a quality component in the design helped ensure that bonus payments were attributable to demonstration-specific programs and that cost-savings were not achieved at the expense of quality. However, the design created challenges. For example, neither bonuses nor performance feedback for PY1 were given to participants until after the third performance year had begun. CMS provides participants with quarterly claims data sets, but most
participants report they do not have the resources to analyze these data sets and generate summary reports on their progress and areas for improvement. Gap between Completion of First Performance Year and Expected Bonus Payments
Source: GAO analysis of CMS data. April 1, 2005
PY = Performance year
April 1, 2006 April 1, 2007 April 1, 2008
July 2007
Bonus payments distributed for PY1
April 2007
Cost-savings feedback for PY1
Mid-June 2007
Cost-savings and quality-of-care bonuses for PY1
12 12 3 9
PY1 PY2 PY3
15 months
Number of months
Note: The 15-month period includes the typical 6-month period necessary for CMS to process a sufficient number of claims to meet its 98 percent complete claims threshold that it uses for analysis.
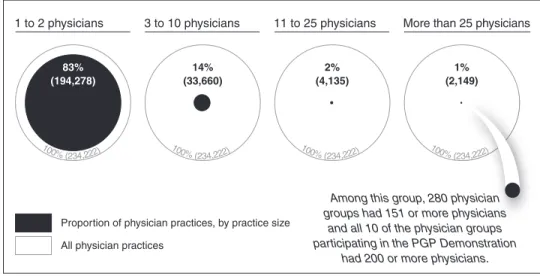
The large relative size of the 10 participating physician groups (all had 200 or more physicians) compared with most U.S. physician practices (less than 1 percent had more than 150 physicians) gave the participants certain size-related advantages that may make broadening the payment approach used in the demonstration to other physician groups and non-group practices
challenging. Their larger size provided the participants with three unique size-related advantages: institutional affiliations that allowed greater access to financial capital, access to and experience with using electronic health
Letter
1Results in Brief 5
Background 7 Participating Physician Groups Implemented Care Coordination
Programs Designed to Achieve Cost Savings and Management Processes to Meet CMS-Set Diabetes Quality-of-Care Targets in
PY1 18 CMS’s PGP Demonstration Design Was Generally a Reasonable
Approach, but Created Challenges 26
Participating Physician Groups Had Several Size-Related Advantages, Which May Pose Challenges in Broadening the Payment Approach Used in the Demonstration to More
Participants 33 Conclusions 37
Recommendation for Executive Action 38
Agency Comments and Our Evaluation 38
Appendix I
Objectives, Scope, and Methodology
40Appendix II
New and Expanded Programs Implemented by the
10 Participating Physician Groups for the PGP
Demonstration
43Appendix III
Reported PGP Demonstration-Related Start-up
and Operating Costs for New and Expanded
Programs
47Appendix IV
Comments from the Centers for Medicare &
Medicaid Services
48Tables
Table 1: Description of the Participating Physician Groups in the
Physician Group Practice Demonstration 8
Table 2: CMS’s Demonstrations Related to Physician
Pay-for-Performance 17 Table 3: Percentage of FTEs Devoted to Largest New and
Expanded Care Coordination Programs Implemented by
PGP Demonstration Participants, PY1 20
Table 4: Management Processes Developed or Enhanced by Participating Physician Groups to Meet Diabetes
Quality-of-Care Targets, PY1 23
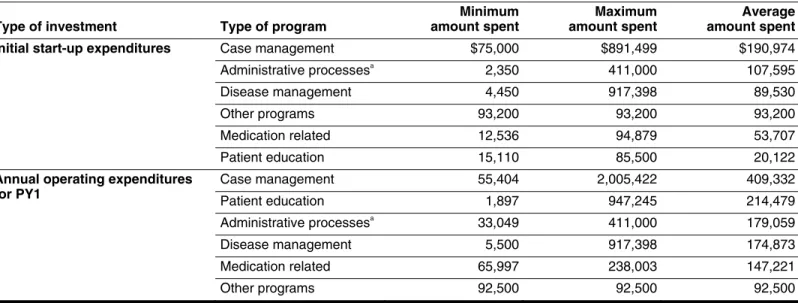
Table 5: Range and Average of Initial Start-up and PY1 Operating Expenditures Reported by Participating Physician Groups, by Program Type and Order of Average Amount Spent,
2005 35
Figures
Figure 1: Illustration of CMS Bonus Payment Methodology for PGP
Demonstration, Performance Year 1 10
Figure 2: Medicare Spending Growth Rate of Participating Physician Groups Relative to Their Comparison Group
and the 2 Percent Threshold in PY1 15
Figure 3: Percentage of New and Expanded Programs Implemented
by Participating Physician Groups 19
Figure 4: Gap between Completion of First Performance Year and
Performance Feedback and Bonus Payments 28
Figure 5: Relative Proportion of Physician Practices in the United
Abbreviations
ASC ambulatory surgical center
BIPA Medicare, Medicaid, and SCHIP Benefits Improvement and Protection Act of 2000
CAD coronary artery disease CAH critical access hospital CHF congestive heart failure
CMS Centers for Medicare & Medicaid Services COPD chronic obstructive pulmonary disease E&M evaluation and management
EHR electronic health record FFS fee-for-service
FTE full-time equivalent
HCC hierarchical condition category
HEDIS® health plan employer data and information set IRMA Integrated Resources for the Middlesex Area
IT information technology
IVR interactive voice response
MedPAC Medicare Payment Advisory Commission MGMA Medical Group Management Association NCQA National Committee for Quality Assurance PGP physician group practice
PY1 performance year one PY2 performance year two PY3 performance year three
This is a work of the U.S. government and is not subject to copyright protection in the United States. It may be reproduced and distributed in its entirety without further permission from GAO. However, because this work may contain copyrighted images or other material, permission from the copyright holder may be necessary if you wish to reproduce this material separately.
February 15, 2008
The Honorable Max Baucus Chairman
The Honorable Charles E. Grassley Ranking Member
Committee on Finance United States Senate
The Honorable John D. Dingell Chairman
The Honorable Joe Barton Ranking Member
Committee on Energy and Commerce House of Representatives
The Honorable Charles B. Rangel Chairman
The Honorable Jim McCrery Ranking Member
Committee on Ways and Means House of Representatives
Medicare spending for physician services paid through Medicare’s Part B fee-for-service (FFS) program grew rapidly from 2000 to 2006, increasing from $37 billion in 2000 to $58 billion in 2006, at an average annual growth rate of almost 8 percent, outpacing the national economy’s annual average growth rate for that period of 5.2 percent.1
Growth in Medicare spending for physician services has heightened congressional concerns about how physicians are reimbursed under the Medicare FFS payment system as well as the long-term fiscal sustainability of the Medicare program. The Medicare Payment Advisory Commission (MedPAC) and other experts believe that the method for paying physicians under the current Medicare FFS payment system is contributing to the rapid growth in Medicare
1
Medicare Part B helps pay for doctors’ services, outpatient hospital care, and durable medical equipment.
expenditures,2
because the FFS payment system generally does not encourage physicians to make efficient use of resources, encourage coordination of physician services with services paid under the Medicare Part A program,3
or encourage improvements in quality of care. Some private sector insurers that pay physicians on an FFS basis have recently implemented payment systems, referred to as pay-for-performance, in which a portion of a physician’s or hospital’s payment is based on meeting performance measures designed to improve the quality of care. Congress mandated in the Medicare, Medicaid, and SCHIP Benefits Improvement and Protection Act of 2000 (BIPA)4
that the Centers for Medicare &
Medicaid Services (CMS), the agency that oversees the Medicare program, conduct demonstrations to test incentive-based alternative payment methods for physicians reimbursed under Medicare FFS. The Physician Group Practice (PGP) Demonstration was the first of several physician pay-for-performance demonstrations CMS has implemented. In line with BIPA’s mandate and the ongoing concerns about growth in Medicare spending for physician services, CMS’s PGP Demonstration aims to encourage the coordination of Part A and Part B services, promote efficiency through investment in administrative processes, and reward physicians for improving health outcomes.5
CMS’s PGP Demonstration tests a hybrid payment methodology that combines Medicare FFS payments with a bonus payment that participating physician groups can earn by demonstrating savings through better
management of patient care and services and meeting quality-of-care performance targets. Performance for the demonstration is based on the success of the entire physician group practice, and not on the individual performance of any one physician. CMS stated that it chose to focus on large physician group practices because these organizations influence a significant amount of Medicare expenditures and have sufficient Medicare beneficiary volume to calculate Medicare savings or losses under the demonstration. CMS initially designed the PGP Demonstration for a 3-year
2
MedPAC is an independent federal body established by the Balanced Budget Act of 1997, Pub. L. No. 105-33, §4022, 111 Stat. 251, 350-55, to advise Congress on issues affecting the Medicare program.
3
Medicare Part A pays for inpatient hospital stays, care in skilled nursing facilities, hospice care, and some home health care.
4
Pub. L. No. 106-554, App. F, § 412, 114 Stat. 2763, 2763A-509-2763A-515. 5
period and recently, December 2007, continued the demonstration for a fourth performance year. CMS solicited participation from physician practices across the United States, and selected 10 physician group practices with at least 200 or more physicians that were multispecialty physician groups, which had the capacity to provide a variety of types of clinical services.6
The first year of the demonstration, referred to as performance year one (PY1), ran from April 1, 2005, through March 31, 2006, and the fourth performance year will end on March 31, 2009.7
In July 2007, CMS reported the results of PY1. As a result of their efforts, 2 of the 10 participating physician groups participating in the PGP
Demonstration earned a performance bonus payment. Specifically, the Marshfield Clinic and the University of Michigan Faculty Group Practice earned bonuses of approximately $4.6 million and $2.8 million,
respectively. As a part of the overall design of the demonstration, to obtain bonus payments, each participant had to generate cost savings to
Medicare of more than 2 percent relative to a unique comparison group of Medicare beneficiaries intended to be similar to Medicare beneficiaries treated by that participant.8
Only participants that earned this cost-savings portion of the bonus also were eligible to increase their bonus payments if they met certain disease-specific, quality-of-care performance targets. CMS selected 10 diabetes management measures as the quality-of-care
performance targets, and in PY1, all 10 participants achieved 7 or more of CMS’s 10 quality-of-care targets. Performance year two (PY2) and
performance year three (PY3) used the same bonus payment methodology, with two exceptions: (1) other disease-specific quality measures are phased in over time and (2) the share of any bonus earned by meeting quality targets increases each year. While the specific quality-of-care measures for each year were selected by CMS, each participating physician group had the latitude to determine what programs—such as patient care coordination and administrative processes—it would implement to both generate cost savings and meet the quality measures.
6
The number of physicians includes physicians and clinical professionals who can bill Medicare as physicians, such as physician assistants. Unless otherwise noted, the term physician includes all professionals paid under the Medicare physician fee schedule. 7
Performance year two began April 1, 2006 and ended March 31, 2007, and performance year three began April 1, 2007, and ends March 31, 2008.
8
In each performance year, the Medicare beneficiaries assigned to each of the 10 unique comparison groups are similar to the Medicare beneficiaries being served by the participating physician group they are compared against, in terms of their geographic location and the services they receive.
No one savings or quality management program was required to be implemented uniformly.
BIPA required us to report on the progress of the PGP Demonstration. As discussed with the committees of jurisdiction, in this report we examined for the first performance year of the demonstration: (1) what actions the participating physician groups took to achieve cost savings and meet the CMS-set, diabetes quality-of-care targets, (2) the extent to which the PGP Demonstration design was a reasonable approach to rewarding
participating physician groups for cost-savings and quality performance, and (3) potential challenges involved in broadening the payment approach used in the demonstration from the 10 large participating physician groups to other physician groups and nongroup practices.
To determine the programs used by the participating physician groups for the PGP Demonstration, we analyzed data we collected through written questionnaires and interviews. We supplemented this information by conducting site visits to 5 of the 10 locations.9
We included in our analysis new programs or expansions of existing programs created in response to the demonstration. To determine the extent to which the PGP
Demonstration design was reasonable, we analyzed documents on the overall design and bonus payment methodology we obtained from CMS, analyzed data collected through the questionnaire, and used interviews we conducted with representatives of the participating physician groups and CMS. We also reviewed and analyzed CMS documents on the design of the PGP Demonstration. To determine the potential challenges involved in broadening the payment approach used in the demonstration to other physician practices, we compared selected characteristics of the 10 participating physician groups with all physician practices in the United States, and we also relied on interviews with the participating physician group practices, CMS officials, and relevant industry experts. In doing our work, we tested the reliability of the data and determined they were adequate for our purposes. We conducted this performance audit from May 2006 through December 2007 in accordance with generally accepted government auditing standards. Those standards require that we plan and perform the audit to obtain sufficient, appropriate evidence to provide a reasonable basis for our findings and conclusions based on our audit
9
We visited Geisinger Health System in Pennsylvania, Park Nicollet Health Services in Minnesota, Marshfield Clinic in Wisconsin, Billings Clinic in Montana, and The Everett Clinic in Washington.
objectives. We believe that the evidence obtained provides a reasonable basis for our findings and conclusions based on our audit objectives. For additional details of our scope and methodology, see appendix I.
To achieve cost savings in the PGP demonstration, all 10 participating physician groups implemented care coordination programs that focused on specific patient populations, such as those with congestive heart failure (CHF), that the participants believed were the most likely to generate cost savings. However, only 2 of the 10 participants earned a bonus payment in PY1 for achieving cost savings and meeting quality-of-care targets. The remaining 8 participants met 7 or more of CMS’s 10 quality-of-care targets in PY1, but were not eligible for bonus payments because they did not achieve the required level of cost savings. To meet the quality-of-care targets set by CMS for PY1 on 10 diabetes measures, such as whether a beneficiary’s blood pressure was at the recommended level, participants generally initiated processes to better identify patients with diabetes, improve documentation of diabetes-management-related exams and tests completed, and provide feedback to physicians on achievement of the targets. All 10 participating physician groups reported that their care coordination programs were making progress in both achieving cost savings and providing broader benefits to their programs and communities because, for example, demonstration program initiatives were typically implemented for all patients in a physician’s care regardless of whether they were part of the demonstration. Despite early positive indicators of cost savings, the full impact of programs implemented for the PGP
Demonstration, particularly in care coordination, is largely unknown for a variety of reasons, including that many programs were not in place for all 12 months of the first performance year.
Results in Brief
CMS’s design for the PGP Demonstration was generally a reasonable approach for rewarding physician groups in the demonstration for cost savings and quality performance, but created challenges. CMS’s decision to use comparison groups and adjust for differences in health status among Medicare beneficiaries helped ensure that bonus payments reflected programs and incentives attributable to the demonstration. In addition, having a quality component of the design helped ensure that participating physician groups did not achieve cost savings at the expense of quality. However, the demonstration design created a particular
challenge for CMS in providing timely performance feedback and bonus payments to the participating physician groups, which, if received, may have enabled them to improve their programs. Specifically, neither bonuses nor performance feedback for PY1 were given to participants
until after PY3 began. While CMS has begun to provide each participant with a quarterly patient claims data set related to beneficiaries it served, most participants reported they did not have the necessary resources to analyze and use these data sets to determine their progress and areas for potential improvements. Participants also raised additional concerns about the demonstration’s design, including the use of a uniform 2 percent savings threshold for all participants, which may have made earning a bonus more challenging for particular providers. CMS officials indicated that they planned to examine these issues as part of their evaluation at the conclusion of the PGP Demonstration.
The large relative size of the 10 participating physician groups compared with most U.S. physician practices gave the participants certain size-related advantages that may make broadening the payment approach used in the demonstration to other physician groups and nongroup practices challenging. Whereas all physician groups participating in the
demonstration had 200 or more physicians, less than 1 percent of all physician practices nationwide had more than 150 physicians. In addition to the number of physicians, participants were larger in terms of their annual medical revenues and staff size. Their larger size provided the participating physician groups with three unique size-related advantages: institutional affiliations that allowed greater access to financial capital, access to and experience with using electronic health records (EHR) systems, and experience prior to the PGP Demonstration with pay-for-performance programs. For example, 8 of the 10 participants had an EHR, which was essential to participants’ ability to gather data and track
progress in meeting quality-of-care targets; only about 24 percent of physician practices in the U.S. had a full or partial EHR in 2005. Most participating groups believed these three advantages were critical to achieving cost savings and improving quality.
We recommend that the Administrator of CMS provide participating physician groups with interim summary reports that estimate their progress in achieving cost-savings and quality-of-care targets. In
commenting on a draft of this report, CMS agreed with the intent of our recommendation. CMS stated that it was developing a new quarterly report and refined data set to aid physician groups in monitoring their performance, coordinating care, and improving quality.
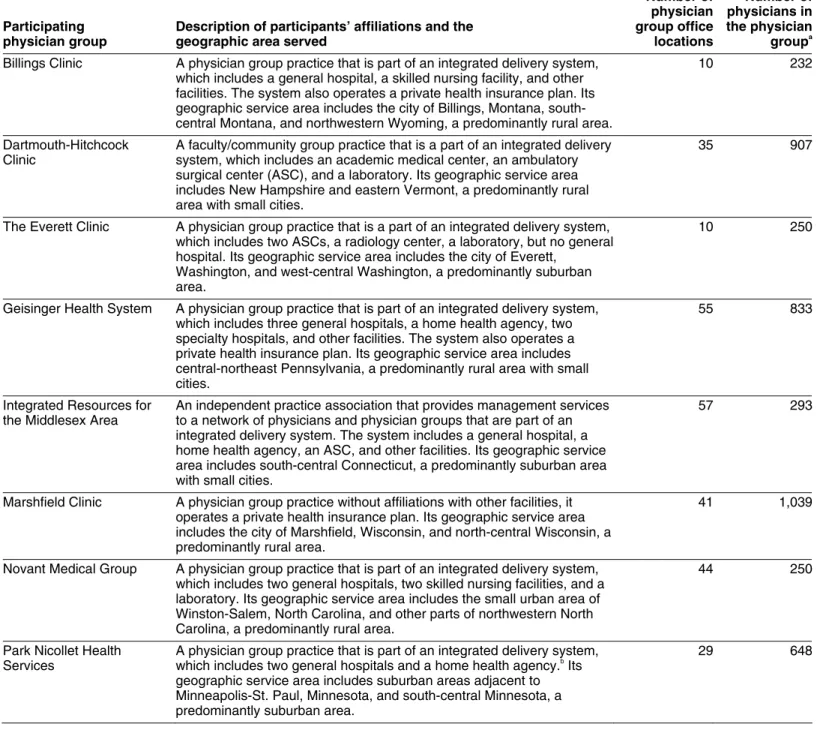
Physician groups with at least 200 physicians were eligible to apply for the PGP Demonstration and 10 were selected by CMS. (See table 1.) CMS’s technical review panel evaluated each applicant based on its
organizational structure, operational feasibility, geographic location, and demonstration implementation strategy.10
Collectively, the 10 participating physician groups are all multispecialty practices comprising more than 6,000 physicians who provide care for more than 220,000 Medicare FFS beneficiaries. While all the participants have at least 200 physicians, group practice size varies widely, ranging from 232 to 1,291 physicians. Except for the Marshfield Clinic, all participants identified themselves as integrated delivery systems that include, in addition to their group practice, other health care entities such as hospitals, surgical centers, or laboratories.11
Nearly all of the participants have nonprofit tax status, except for the Everett Clinic and the Integrated Resources for the
Middlesex Area (IRMA), which are for profit. Overall, a majority of the 10 participants are located in small cities and serve either predominantly rural or suburban areas. These participants provide care over wide geographic areas by using satellite physician group office locations, ranging from 10 to 65 physician group office locations.
Background
10
CMS received 26 applications in response to its Request for Proposal for the PGP Demonstration from a variety of organizations.
11
We defined an integrated delivery system as a health care system that includes at least one hospital in addition to the physician group, and may include other health care providers, such as home health agencies or nursing homes. The Everett Clinic identified itself as an integrated delivery system that does not include a general hospital but does include two ambulatory surgical centers, a laboratory, and a radiation center.
Table 1: Description of the Participating Physician Groups in the Physician Group Practice Demonstration
Participating physician group
Description of participants’ affiliations and the geographic area served
Number of physician group office locations Number of physicians in the physician groupa
Billings Clinic A physician group practice that is part of an integrated delivery system, which includes a general hospital, a skilled nursing facility, and other facilities. The system also operates a private health insurance plan. Its geographic service area includes the city of Billings, Montana, south-central Montana, and northwestern Wyoming, a predominantly rural area.
10 232
Dartmouth-Hitchcock Clinic
A faculty/community group practice that is a part of an integrated delivery system, which includes an academic medical center, an ambulatory surgical center (ASC), and a laboratory. Its geographic service area includes New Hampshire and eastern Vermont, a predominantly rural area with small cities.
35 907
The Everett Clinic A physician group practice that is a part of an integrated delivery system, which includes two ASCs, a radiology center, a laboratory, but no general hospital. Its geographic service area includes the city of Everett,
Washington, and west-central Washington, a predominantly suburban area.
10 250
Geisinger Health System A physician group practice that is part of an integrated delivery system, which includes three general hospitals, a home health agency, two specialty hospitals, and other facilities. The system also operates a private health insurance plan. Its geographic service area includes central-northeast Pennsylvania, a predominantly rural area with small cities.
55 833
Integrated Resources for the Middlesex Area
An independent practice association that provides management services to a network of physicians and physician groups that are part of an integrated delivery system. The system includes a general hospital, a home health agency, an ASC, and other facilities. Its geographic service area includes south-central Connecticut, a predominantly suburban area with small cities.
57 293
Marshfield Clinic A physician group practice without affiliations with other facilities, it operates a private health insurance plan. Its geographic service area includes the city of Marshfield, Wisconsin, and north-central Wisconsin, a predominantly rural area.
41 1,039
Novant Medical Group A physician group practice that is part of an integrated delivery system, which includes two general hospitals, two skilled nursing facilities, and a laboratory. Its geographic service area includes the small urban area of Winston-Salem, North Carolina, and other parts of northwestern North Carolina, a predominantly rural area.
44 250
Park Nicollet Health Services
A physician group practice that is part of an integrated delivery system, which includes two general hospitals and a home health agency.b
Its geographic service area includes suburban areas adjacent to Minneapolis-St. Paul, Minnesota, and south-central Minnesota, a predominantly suburban area.
Participating physician group
Description of participants’ affiliations and the geographic area served
Number of physician group office locations Number of physicians in the physician groupa
St. John’s Health System A physician group practice that is part of an integrated delivery system, which includes six general hospitals, six home health agencies, an ASC, and other facilities. The system also operates a private health insurance plan. Its geographic service area includes the city of Springfield, Missouri, as well as south-central Missouri and northwest Arkansas, predominantly rural areas.
65 522
University of Michigan Faculty Group Practice
A faculty group practice that is a part of an integrated delivery system, which includes an academic medical center, two other general hospitals, a home health agency, two ASCs, and other facilities. The system also operates a private health insurance plan. Its geographic service area includes the city of Ann Arbor, Michigan, and southeastern Michigan, a predominantly suburban area with small cities.
28 1,291
Source: GAO.
a
The number of physicians includes physicians and physician extenders—those who can bill Medicare as physicians, such as physician assistants.
bPark Nicollet Health Services has full ownership of one general hospital and partial ownership of a
second.
Demonstration Design,
Including Bonus Payment
Methodology
Under the PGP Demonstration’s design, participating physician groups are eligible to earn annual cost-savings bonuses for generating Medicare program savings. Participants that received cost-savings bonuses were also eligible to receive additional bonuses for meeting certain quality targets. Both the cost-savings and quality bonuses are in addition to payments physicians receive under Medicare FFS. There are three main steps in CMS’s bonus payment methodology to determine which
participants are awarded bonus payments and the amount of these
bonuses: (1) determination of eligibility for performance bonus payments, (2) determination of the size of the bonus pool, and (3) determination of actual bonus payments earned. (See fig. 1.)
Figure 1: Illustration of CMS Bonus Payment Methodology for PGP Demonstration, Performance Year 1
Source: GAO analysis of CMS data.
CMS determines whether a participating physician group is eligible for a demonstration bonus based on whether the participant generated annual Medicare savings greater than 2% of its target expenditures.
Medicare program savings generated by the participating physician group in excess of 2% of its target expenditure amount.
1
2
80% is available as a bonus pool to the participating physician group,
20% is considered Medicare program savings.
3 Of the bonus pool of savings available:
70% is awarded as a cost-savings bonus.
Up to 30% is awarded (for those who received the cost-savings bonus) to those who also meet diabetes quality targets for PY1. Any unearned portion is considered Medicare program savings.
Total actual bonus payment = cost-savings bonus (70% of bonus pool) received + quality bonus received (up to 30% of bonus pool).
Savings > 2% of target expenditures 100% 80% 20% Bonus pool If quality target met 70% of bonus pool Up to 30% of bonus pool
Actual bonus payment
Goes to participating
physician group
Step 1: Determination of eligibility for bonus payment
Step 2: Determination of size of bonus pool
Notes: CMS retained a share (25 percent) of the actual bonus earned by participating physician groups in Performance Year 1 to protect against any potential losses in future performance years. Spending increases in excess of 2 percent, relative to a comparison group of beneficiaries intended to have similar characteristics, of the spending target are carried forward as losses and deducted from any bonus earned in future years. The total actual bonus earned cannot be greater than 5 percent of the participating physician group’s original spending target. If it is higher, it will be reduced to the 5 percent level.
For the first step of the bonus payment methodology, to determine eligibility for receiving bonus payments, participating physician groups had to generate savings greater than 2 percent of their target expenditure amounts, relative to a comparison group of beneficiaries intended to have similar characteristics. CMS stated that the purpose of the 2 percent savings threshold was to further account for the possibility of random fluctuations in expenditures rather than actual savings. CMS also stated that it used separate comparison groups for each of the participants to distinguish the effect of the demonstration’s incentive payments from trends among Medicare beneficiaries unrelated to the demonstration. Operationally, Medicare beneficiaries were assigned to the comparison groups or to the participating physician groups retrospectively at the conclusion of each performance year, using Medicare claims data sent to CMS by providers following the delivery of care. As a part of the process of selecting beneficiaries for each comparison group that were similar to those served by the participating physician group they were being compared with, CMS ensured that beneficiaries (1) resided in the same geographic service areas as the beneficiaries assigned to the
corresponding physician group;12
(2) had received at least one office or outpatient service, referred to as an evaluation and management (E&M) service, in that performance year;13
and (3) had not received any E&M services from the corresponding physician group that year or had been assigned to the participant’s group of beneficiaries in any previous performance year.
For step two, determining the size of the bonus pools, participating physician groups that generated savings beyond the 2 percent threshold were eligible to receive up to 80 percent of those savings as potential
12
For the purposes of the PGP Demonstration, service areas consist of all counties in which a given participating physician group derives at least 1 percent of its assigned Medicare FFS beneficiaries. These counties are combined to form each participating physician group’s service area.
13
Under the Medicare physician payment system, E&M services refer to visits and consultations furnished to patients by physicians and include 10 current procedural terminology codes that represent the level of E&M service provided.
bonuses. The remaining 20 percent, and all other savings not awarded to the participants,14
were retained by the Medicare program.
In the third step, the determination of actual bonus amounts earned, eligible participating physician groups could receive up to the full amount available in their bonus pools as cost-savings bonuses and quality-of-care bonuses. Specifically, for PY1, 70 percent of the bonus pool was awarded as a cost-savings bonus to participants who met the 2 percent cost-savings threshold, and up to 30 percent of the bonus pool could have been
awarded as a quality-of-care bonus, for those who met the cost-savings threshold. The quality-of-care bonus was awarded to participants that met or exceeded various quality-of-care targets within an area of clinical focus selected by CMS, in collaboration with other organizations and the
participating physician groups.15
In PY1, CMS focused on diabetes management, and required participants to meet targets on a set of 10 diabetes measures, including whether a beneficiary received an eye exam or foot exam.16
To meet the quality-of-care target for each of the diabetes measures, a participant had to either improve its performance by a certain amount relative to its baseline performance or meet a national set of performance measures, referred to as HEDIS® measures, established by the National Committee for Quality Assurance (NCQA).17
Participants could also receive a prorated share of the quality-of-care bonus, based on success meeting some, but not all, of the quality-of-care targets.
14
Other savings generated by the participating physician groups but not awarded to them include the first 2 percent of savings generated as well as any unearned quality-of-care bonuses.
15
The quality measures were developed by CMS in conjunction with professional associations such as the American Medical Association’s Physician Consortium for Performance Improvement, the National Committee for Quality Assurance, the National Quality Forum, and the 10 participating physician groups.
16
The other measures were influenza vaccination, pneumonia vaccination, low-density lipoprotein cholesterol test, urine protein test, and Hemoglobin A1c test (which measures blood sugar level) in the recommended time interval, and whether Hemoglobin A1c, blood pressure, and low-density lipoprotein cholesterol are at the recommended levels.
17
NCQA created the health plan employer data and information set (HEDIS®) to measure performance on important dimensions of care and service, and it is now a tool used by more than 90 percent of health plans. For each measure, participating physician groups must achieve at least one of three targets: (1) meet the higher of 75 percent compliance or the Medicare HEDIS®
mean for the measure (for those measures where HEDIS®
indicators are also available), (2) demonstrate a 10 percent or greater reduction in the gap between the administrative baseline and 100 percent compliance, or (3) achieve the 70th percentile Medicare HEDIS®
level (for those measures where HEDIS®
While the bonus payment methodology will remain the same throughout the demonstration, CMS added other quality-of-care measures and increased the relative significance of the quality-of-care measures in PY2 and PY3. In PY2, quality-of-care measures pertaining to CHF and coronary artery disease (CAD) were added to the existing diabetes measures. In PY3, quality-of-care measures pertaining to the management of
hypertension and screening for breast and colorectal cancer were added to the existing diabetes, CHF, and CAD measures. The proportion of the bonus pool dedicated to meeting the quality-of-care targets—30 percent in PY1—also increased in each performance year. For PY2, the potential quality-of-care bonus increased to 40 percent of the potential bonus pool, and the proportion of the bonus pool that will be paid as a cost-savings bonus decreased to 60 percent. For PY3, the cost-savings and quality-of-care bonuses each will constitute 50 percent of the total bonus paid.
Results from Performance
Year 1
In July 2007, CMS reported that in PY1, 2 of the 10 participating physician groups earned bonuses for achieving cost-saving and quality-of-care targets, while all 10 participants achieved 7 or more of the 10 quality-of-care targets. The Marshfield Clinic and the University of Michigan Faculty Group Practice received performance bonus payments of approximately $4.6 million and $2.8 million, respectively, in PY1. The Marshfield Clinic generated approximately $6 million in Medicare savings in PY1, above the 2 percent threshold established by CMS. Of this $6 million bonus pool, the Medicare program retained approximately $1.2 million, and Marshfield Clinic earned $3.4 million for the cost-savings component of the bonus and $1.2 million for meeting 9 of the 10 quality-of-care targets.18
The University of Michigan Faculty Group Practice generated approximately $3.5 million in savings in PY1 above the 2 percent threshold. Medicare retained approximately $700,000 and the University of Michigan Faculty Group Practice earned nearly $2 million for the cost-savings component of the bonus, and just over $800,000 for meeting 9 of the 10 quality-of-care targets.19
18
The Marshfield Clinic was eligible to earn about $1.5 million ($1,448,613) in PY1 as a quality bonus if it met all 10 of the diabetes quality targets.
19
The University of Michigan Faculty Group Practice was eligible to earn $838,951 in PY1 as a quality bonus if it met all 10 of the diabetes quality targets.
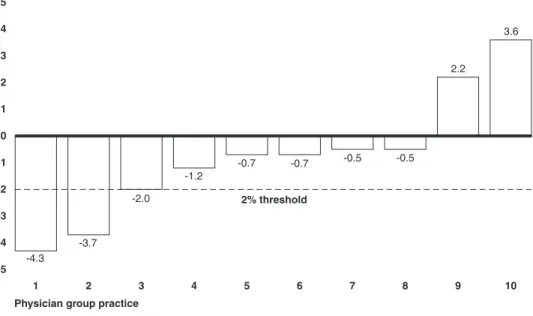
Of the remaining eight participating physician groups that did not earn cost-savings bonuses in PY1, all performed well in meeting the quality-of-care targets. Specifically, all eight of these participants achieved 7 or more of the 10 quality-of-care targets, with two participants meeting all 10 quality-of-care targets and two others achieving 9 of the targets. In addition, six of the participants came close to achieving the 2 percent threshold for the cost-savings component of the performance bonus payment in PY1. These six groups reduced their Medicare spending growth rates compared to their comparison group, but not beyond the 2 percent threshold.20
(See fig. 2.)
20
Collectively, these theoretical savings amounted to about $8 million. However, CMS does not consider these savings to be actual savings because based on the demonstration design, savings below the 2 percent threshold could be caused by random fluctuations in
Figure 2: Medicare Spending Growth Rate of Participating Physician Groups Relative to Their Comparison Group and the 2 Percent Threshold in PY1
-5 -4 -3 -2 -1 0 1 2 3 4 5 10 9 8 7 6 5 4 3 2 1
Difference in Medicare spendinggrowth rate
2% threshold
Physician group practice Sources: CMSand RTI International.
-4.3 -3.7 -2.0 -1.2 -0.7 -0.7 -0.5 -0.5 2.2 3.6
Note: Participating group 3 reduced its Medicare spending by almost 2 percent, but did not exceed the threshold.
PGP Demonstration, Early
Test of Public Sector
Pay-for-Performance Models
While the number of pay-for-performance programs—programs in which a portion of a provider’s21
payment is based on their performance against defined measures—has increased in recent years, this growth has occurred largely in the private sector by commercial health plans. MedVantage reported that 107 pay-for-performance programs were in place as of November 2005, up from 84 the year before.22
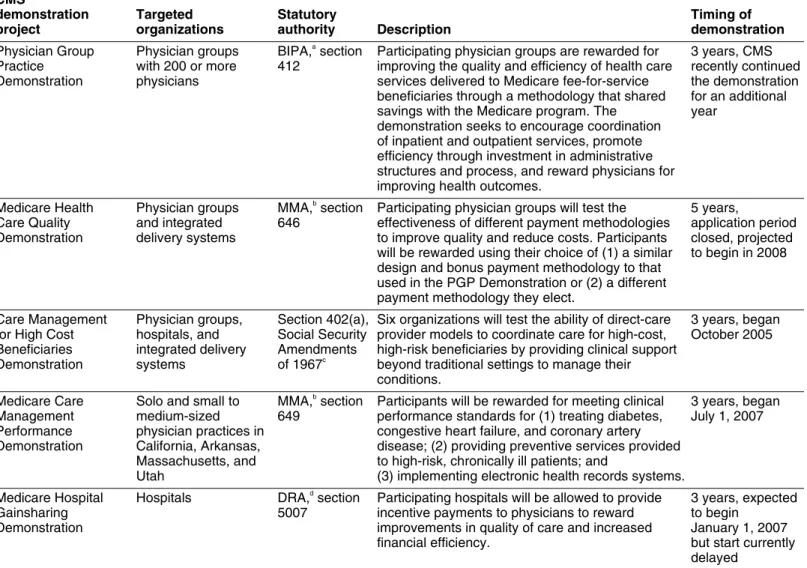
Of these 107 pay-for-performance programs, 21 were public sector programs, of which 10 were Medicare programs. Currently, CMS has 5 programs, including the PGP Demonstration, that are demonstrations testing alternative physician payment methods. (See table 2.) Among these
21
A provider could be a physician, hospital, or other professional health care service organization.
22
Congressional Research Service, The Library of Congress, CRS Report for Congress: Pay-for-Performance in Health Care (Washington, D.C.: updated Dec. 12, 2006). CRS’s count of pay-for-performance programs includes those targeting compensation to physicians, physician groups, and hospitals.
5 physician pay-for-performance demonstrations, 4, including the PGP Demonstration, test physician pay-for-performance methods by offering incentives to physicians for meeting clinical performance standards, while 1 focuses on aligning financial incentives between hospitals and
physicians. The PGP Demonstration was the first of CMS’s Medicare demonstrations to test physician pay-for-performance. Participants in CMS’s Medicare Health Care Quality Demonstration, projected to begin in 2008,23
may elect to use this overall design and bonus payment
methodology from the PGP Demonstration. Among CMS’s other pay-for-performance demonstrations that are not physician related, is the Premier Hospital Quality Incentive Demonstration, a hospital-specific pay-for-performance demonstration for more than 260 hospitals in the Premier Inc., system. Under this demonstration, CMS provides bonus payments for hospitals with the highest levels of performance in five clinical conditions, including acute myocardial infarction. A recent study examining this demonstration concluded that among hospitals receiving performance bonuses, patients did not have a significant improvement in quality-of-care of care or outcomes for acute myocardial infarction.24
23
For this demonstration, participants can also choose a different payment methodology rather than the bonus payment methodology used in the PGP Demonstration as long as it includes a hybrid shared savings approach incorporating a cost-savings and quality component.
24
Seth W. Glickman et al., “Pay for Performance, Quality of Care and Outcomes in Acute Myocardial Infarction,” The Journal of the American Medical Association, vol. 297, no. 21 (2007).
Table 2: CMS’s Demonstrations Related to Physician Pay-for-Performance CMS demonstration project Targeted organizations Statutory authority Description Timing of demonstration Physician Group Practice Demonstration Physician groups with 200 or more physicians BIPA,a section 412
Participating physician groups are rewarded for improving the quality and efficiency of health care services delivered to Medicare fee-for-service beneficiaries through a methodology that shared savings with the Medicare program. The demonstration seeks to encourage coordination of inpatient and outpatient services, promote efficiency through investment in administrative structures and process, and reward physicians for improving health outcomes.
3 years, CMS recently continued the demonstration for an additional year Medicare Health Care Quality Demonstration Physician groups and integrated delivery systems MMA,b section 646
Participating physician groups will test the effectiveness of different payment methodologies to improve quality and reduce costs. Participants will be rewarded using their choice of (1) a similar design and bonus payment methodology to that used in the PGP Demonstration or (2) a different payment methodology they elect.
5 years,
application period closed, projected to begin in 2008
Care Management for High Cost Beneficiaries Demonstration Physician groups, hospitals, and integrated delivery systems Section 402(a), Social Security Amendments of 1967c
Six organizations will test the ability of direct-care provider models to coordinate care for high-cost, high-risk beneficiaries by providing clinical support beyond traditional settings to manage their conditions. 3 years, began October 2005 Medicare Care Management Performance Demonstration
Solo and small to medium-sized physician practices in California, Arkansas, Massachusetts, and Utah MMA,b section 649
Participants will be rewarded for meeting clinical performance standards for (1) treating diabetes, congestive heart failure, and coronary artery disease; (2) providing preventive services provided to high-risk, chronically ill patients; and
(3) implementing electronic health records systems.
3 years, began July 1, 2007 Medicare Hospital Gainsharing Demonstration Hospitals DRA,d section 5007
Participating hospitals will be allowed to provide incentive payments to physicians to reward improvements in quality of care and increased financial efficiency.
3 years, expected to begin
January 1, 2007 but start currently delayed
Source: CMS.
a
Medicare, Medicaid, and SCHIP Benefits Improvement and Protection Act of 2000, Pub. L. No. 106-554, App. F, § 412, 114 Stat. at 2763A-509.
b
Medicare Prescription Drug, Improvement, and Modernization Act of 2003, Pub. L. No. 108-173, 117 Stat. 2066.
c
Pub. L. No. 90-248, 81 Stat. 821, 930-31 (1968), as amended by Pub. L. No. 92-603, § 222(b)(2), 86 Stat. at 1393.
d
The participating physician groups implemented care coordination programs to achieve cost savings and improved their management processes to meet quality improvement targets CMS set for particular diabetes measures in PY1. More specifically, management process improvements included enhancing information technology (IT) systems, incorporating more team-based approaches, and improving administrative processes. Despite early positive indicators in cost savings, the full impact of programs implemented for the PGP Demonstration, particularly in care coordination, is largely unknown because many programs were not in place for all 12 months of the first performance year.
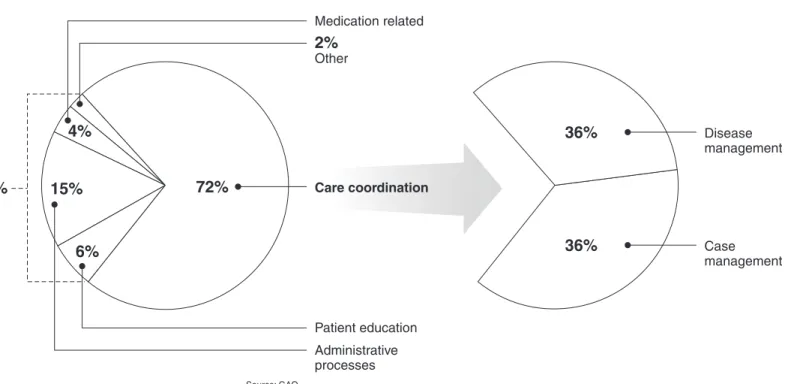
The participating physician groups implemented 47 programs, which were either new or expansions of existing programs, to achieve cost savings and meet the CMS-set diabetes quality-of-care targets, with each participant implementing from 2 to 9 programs.25
(See app. II for a complete list of new and expanded programs implemented for the PGP Demonstration.) More specifically, participants focused nearly three-quarters of their new and expanded programs on care coordination—programs that manage the care of a small number of chronically ill and frail elderly patients who account for a disproportionately large share of overall costs. (See fig. 3.) The remaining one-quarter of programs focused on patient education, medication-related issues, improving administrative processes, and other initiatives.
Participating
Physician Groups
Implemented Care
Coordination
Programs Designed to
Achieve Cost Savings
and Management
Processes to Meet
CMS-Set Diabetes
Quality-of-Care
Targets in PY1
Participating Physician
Groups Implemented 47
Programs for the
Demonstration, Largely in
Care Coordination
25
Participants in the PGP Demonstration reported using 78 total programs to achieve cost savings and quality targets: 28 were new programs created specifically for the
demonstration, 19 were expansions of existing programs, and 31 were existing programs that did not change as a result of the demonstration.
Figure 3: Percentage of New and Expanded Programs Implemented by Participating Physician Groups
Medication related
2% Other Care coordination Patient education Administrative processes 4% 15% 72% 27% 6%
All new and expanded programs
Disease management 36% Case management 36%
New and expanded care coordination programs
Source: GAO.
Note: There are two types of care coordination programs: (1) case-management programs that target high-cost, high-risk patients with multiple medical conditions, and (2) disease-management programs that treat patients with a specific disease, such as congestive heart failure. Information technology initiatives are not counted as discrete new or expanded programs because these initiatives were parts of broader participating physician group efforts. Administrative processes include such activities as physician and staff education programs, physician feedback systems, and data collection processes. Because of rounding, the pie chart does not total to 100 percent.
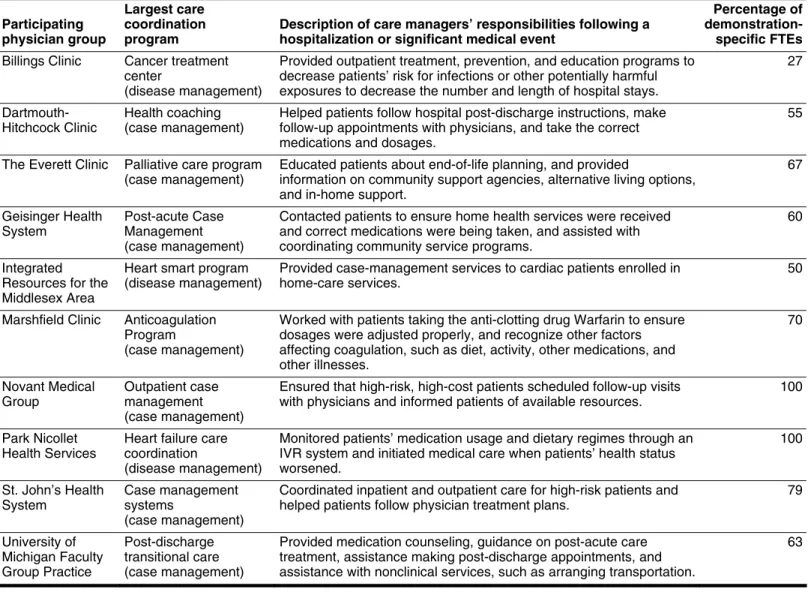
Among the 47 programs, participating physician groups devoted the largest portion of their program resources to care coordination programs designed to reduce hospitalizations by improving post-acute care. Our analysis showed that for 9 of the 10 participants at least half of
demonstration-specific, full-time equivalents (FTE) were devoted to care coordination programs. (See table 3.) Participants told us they selected care coordination programs that provided post-acute care because they believed these programs would reduce future hospitalizations and yield the most cost savings in the shortest amount of time. For example, both Billings Clinic and Park Nicollet Health Services used a telephonic
interactive voice response (IVR) system to monitor patients’ health status at home following a hospitalization or another significant health event.26
Table 3: Percentage of FTEs Devoted to Largest New and Expanded Care Coordination Programs Implemented by PGP
Demonstration Participants, PY1
Participating physician group
Largest care coordination program
Description of care managers’ responsibilities following a hospitalization or significant medical event
Percentage of
demonstration-specific FTEs Billings Clinic Cancer treatment
center
(disease management)
Provided outpatient treatment, prevention, and education programs to decrease patients’ risk for infections or other potentially harmful exposures to decrease the number and length of hospital stays.
27
Dartmouth-Hitchcock Clinic
Health coaching (case management)
Helped patients follow hospital post-discharge instructions, make follow-up appointments with physicians, and take the correct medications and dosages.
55
The Everett Clinic Palliative care program (case management)
Educated patients about end-of-life planning, and provided
information on community support agencies, alternative living options, and in-home support.
67 Geisinger Health System Post-acute Case Management (case management)
Contacted patients to ensure home health services were received and correct medications were being taken, and assisted with coordinating community service programs.
60
Integrated Resources for the Middlesex Area
Heart smart program (disease management)
Provided case-management services to cardiac patients enrolled in home-care services.
50
Marshfield Clinic Anticoagulation Program
(case management)
Worked with patients taking the anti-clotting drug Warfarin to ensure dosages were adjusted properly, and recognize other factors affecting coagulation, such as diet, activity, other medications, and other illnesses. 70 Novant Medical Group Outpatient case management (case management)
Ensured that high-risk, high-cost patients scheduled follow-up visits with physicians and informed patients of available resources.
100
Park Nicollet Health Services
Heart failure care coordination
(disease management)
Monitored patients’ medication usage and dietary regimes through an IVR system and initiated medical care when patients’ health status worsened. 100 St. John’s Health System Case management systems (case management)
Coordinated inpatient and outpatient care for high-risk patients and helped patients follow physician treatment plans.
79 University of Michigan Faculty Group Practice Post-discharge transitional care (case management)
Provided medication counseling, guidance on post-acute care treatment, assistance making post-discharge appointments, and assistance with nonclinical services, such as arranging transportation.
63
Source: GAO analysis of survey data.
Note: Care coordination programs were defined as large based on resources, as measured in FTEs, devoted to the program.
26
Interactive voice response systems are automated telephonic systems that patients call in to on a regular basis to answer a series of health-related questions.
Approximately half of the care coordination programs were case-management programs that targeted high-cost, high-risk patients with multiple medical conditions, while the other half were
disease-management programs that treated patients with a specific disease, such as CHF. Seven participants focused on case-management programs by using care managers for patients with multiple medical conditions to reduce hospitalizations. For example, an official from the Dartmouth-Hitchcock Clinic stated that the clinic’s primary strategy for the PGP Demonstration was to reduce hospitalizations and readmissions through more effective discharge planning, such as calling patients at home following their hospital discharge and encouraging them to schedule follow-up appointments with their physicians. Three participants committed the majority of their resources to disease-management programs; two of the three participants told us they focused on CHF because it is a costly disease to treat and would therefore generate savings within the first performance year. Other diseases, such as diabetes, could take several years to generate cost savings. CHF and diabetes are two of the most common chronic diseases among Medicare beneficiaries, according to recent health policy research.27
All 10 participating physician groups reported that their care coordination programs were making progress in both achieving cost savings and providing broader benefits to their programs and communities. In particular, four participants reported declines in hospitalizations for patients enrolled in their CHF care coordination programs. For example, Park Nicollet Health Services reported a 61 percent reduction in
hospitalizations for patients enrolled in its CHF care-management program, which utilized an IVR to interact with patients on a daily basis. Park Nicollet representatives estimated this program saved $4,680 yearly, on average, for each patient enrolled in the program. Because the
demonstration included other Medicare and non-Medicare patients, its benefits extended beyond the patients assigned to Park Nicollet for the demonstration. Further, several participants stated that collaboration and information sharing among the 10 participants on designing and
implementing programs and analyzing data resulted in improvements to their demonstration programs, which broadly benefit their organizations. Representatives from St. John’s Health Systems stated that creating a
27
See Michael Trisolini et al., “Medicare Physician Group Practice: Innovations in Quality and Efficiency,” Commonwealth Fund, (December 2006), and Stuart Gutterman et. al., “Enhancing Value In Medicare: Demonstrations and Other Initiatives to Improve the Program,” Commonwealth Fund, (January 2007).
coordination program had additional benefits, including the adoption of such programs by other health systems and physician groups throughout the community.
Despite early positive indicators of cost savings, the full impact of programs implemented for the PGP Demonstration, particularly in care coordination, is largely unknown for a variety of reasons, including that many programs were not in place for all 12 months of the first
performance year. Only 1 of the 10 participants had all of its programs in place for all 12 months of PY1. For example, the Marshfield Clinic had a case-management program operational for all 12 months in PY1, and a disease-management program operational for 4 months. By the beginning of PY2, only 6 of the 10 participants had all of their care coordination programs operational. Officials from participating physician groups stated that program implementation delays were caused by program complexity, the process of gaining management approval for significant program start-up costs, and educating physicians about the programs. In addition, two participants stated that because their care coordination programs were phased in throughout the first two performance years, PY3 may be the first year that the full impact of these programs is realized.
Participating Physician
Groups Improved
Management Processes to
Meet the Diabetes
Quality-of-Care Targets in First
Performance Year
To meet the quality-of-care targets set by CMS on diabetes management, participating physician groups improved their management processes by investing in IT, creating team-based approaches, and improving
administrative processes, particularly for diabetes management, the quality-of-care target for PY1. To earn the maximum bonus, participants that met the 2 percent cost-savings target had to further meet a quality-of-care improvement target in a particular clinical area. The measures selected by CMS for each performance year of the demonstration focused on chronic conditions prevalent in the Medicare population that are treated in primary care.28
In PY1, CMS selected diabetes management as the focus for quality improvement for the demonstration participants. See table 4 for a categorization of how the participants worked to improve quality, specifically for diabetes, by using physician feedback, patient registries, team-based approaches, and improved documentation.
28
The quality measures selected by CMS for the PGP Demonstration are a subset of the measures CMS developed for its Doctors’ Office Quality project. This project was designed to develop and test a comprehensive, integrated approach to measuring the quality of care for chronic disease and preventive services in the doctors’ offices. Participants for this demonstration are located in California, Iowa, and New York.
Table 4: Management Processes Developed or Enhanced by Participating Physician Groups to Meet Diabetes Quality-of-Care Targets, PY1 Participating physician group Physician feedback Patient registry Team-based approaches Improved
documentation Description of unique program componentsa
Billings Clinic x x x • Developed an electronic database that allowed
physicians to identify patients with diabetes • Utilized electronic database to generate reports
for physicians on meeting diabetes q uality-of-care measures
• Allowed care managers to manage certain aspects of a patient’s care such as adjusting diuretic medications for heart failure patients
Dartmouth-Hitchcock Clinic
x x x • Provided reports to physicians on meeting
diabetes quality measures through intranet • Improved physician coordination with nurses,
health coaches, and case managers
• Used flowcharts to ensure that diabetes patients receive the appropriate tests and treatments The Everett
Clinic
x x • Provided reports to physicians online, enabling
them to view the percentage of diabetes q uality-of-care measures they had completed for each patient
• Instructed medical assistants to begin performing more initial screenings on patients Geisinger Health
System
x x • Implemented an electronic system to track
physicians’ compliance with diabetes q uality-of-care measures
• Implemented standing orders for nurses to test diabetic patients’ urine for protein before each visit
Integrated Resources for the Middlesex Area
x x • Issued aggregated report cards for each
physician location that measured performance in meeting the diabetes quality-of-care measures • Distributed flow sheets to physicians at the point
of care to help monitor care for diabetes patients
Marshfield Clinic x x x • Provided reports to physicians on meeting
diabetes quality-of-care measures through intranet
• Implemented standing orders for medical assistants to order tests and allowed care managers to adjust patients’ Warfarin dosages based on protocols
• Created paper forms to help ensure that foot exams are completed and documented for diabetes patients
Participating physician group Physician feedback Patient registry Team-based approaches Improved
documentation Description of unique program componentsa
Novant Medical Group
x x • Provided reports to physicians on meeting
diabetes quality-of-care measures, based on paper charts
• Used paper checklists placed in patients’ medical records to record data on eye and foot exams for diabetes patients
Park Nicollet Health Services
x x • Developed electronic alerts and reminders that
inform physicians of patients’ immediate and future clinical needs, including the diabetes-related measures
• Implemented standing orders for care managers to administer various treatments
St. John’s Health System
x x • Used electronic database to check progress on
meeting diabetes quality-of-care measures • Developed an electronic database that allows
physicians to identify diabetes patients University of
Michigan Faculty Group Practice
x • Provided reports to physicians at the point of
care detailing each diabetes patient’s test results, appointments, and medications Sources: GAO and CMS.
aParticipating physician groups may have implemented more than one program to meet q
uality-of-care targets, with multiple components, and only a sample of selected components are included.
All participating physician groups made new investments in IT, by adding features to existing EHR systems or using technology to track physicians’ performance on the quality-of-care measures set by CMS. For example, Marshfield Clinic implemented electronic alerts in its EHR system to remind clinical staff to provide care, such as immunizations. Participants primarily used electronic methods for physician feedback as a tool for physicians to track their performance and that of their peers to improve their internal operations and patient care. For example, Geisinger Health System’s physician feedback system provided physicians with access to monthly reports for each physician, which compared each physician’s performance in meeting the quality-of-care measures. According to
administrators from Geisinger, this transparent approach fostered positive competition among its physicians to improve quality of care. Participants also invested in IT by creating electronic patient or disease-specific
databases or lists referred to as patient registries to better identify patients eligible for enrollment in diabetes programs. The St. John’s Health System, which did not have an EHR system, created an electronic patient registry
to track patients with diabetes and to alert physicians to provide certain tests.29
Six of the participating physician groups relied to a greater extent on a team-based approach to improve care processes. Using a team-based approach, participants expanded the roles and responsibilities of
nonphysician staff such as nurses, medical assistants, and care managers so that they worked more effectively with physicians to deliver quality care. Although the demonstration required additional quality reporting, officials from two of the participating physician groups stated that they were able to treat the same number of patients in a day. For example, Dartmouth-Hitchcock Clinic used care managers who were nurses to maximize the effectiveness of patients’ office visits. These staff scheduled lab tests in advance of patients’ office visits when appropriate, developed patient action plans, and communicated with physicians before and after patients’ arrivals. Physicians from Dartmouth-Hitchcock told us that the time they spent with patients had become more effective because of this new approach.
Four participating physician groups improved their administrative
processes by creating better documentation methods for diabetes-related tests and exams. They created worksheets, derived from patients’ medical records, to ensure that patients received diabetes tests, such as foot and eye exams. In addition to improving documentation, these initiatives served as reminders to physicians to complete diabetes-related tests and exams and also reduced the burden of data collection for reporting purposes. For example, IRMA created paper forms that were added to patient records to collect data on tests as they were conducted. In addition to improving documentation, these forms were intended to relieve some of the burden of collecting data for smaller practices within the organization. IRMA physicians also received paper worksheets at the point of care to help monitor and track care provided to their diabetes patients.
29
Officials at the St. John’s Health System regarded this as a precursor to a full-featured EHR system.
CMS’s design for the PGP Demonstration was generally a reasonable approach for rewarding participating physician groups for cost-savings and quality performance. However, the demonstration design created a particular challenge for CMS in providing timely performance feedback and bonus payments to the participants which, if received more quickly, may have enabled them to improve their programs.
CMS’s design for the PGP Demonstration was generally a reasonable methodological approach for determining whether the actions taken by the participants resulted in cost savings and improvements in quality, and rewarding participants as appropriate. In particular, three aspects of the PGP Demonstration design were consistent with established
methodological practices considered effective: a rigorous research study design to isolate the effects of the demonstration’s incentives, a risk-adjustment approach to adjust for changes in patient health status, and a quality component to help ensure that participating physician groups did not achieve cost savings at the expense of quality.
CMS’s PGP
Demonstration Design
Was Generally a
Reasonable
Approach, but
Created Challenges
CMS’s PGP Demonstration
Design Was Generally a
Reasonable Approach for
Rewarding Participating
Physician Groups
CMS used a rigorous research design to enable it to isolate the effectiveness of the actions taken by each of the participants in the demonstration. Specifically, CMS used a modified “pre-test/post-test” control group design that is generally viewed by experts as an effective way to control for some of the most common threats to internal validity, in this case the ability of the study design to measure the true effects of CMS’s incentive payments.30
The features of CMS’s study design included a separate comparison group for each participant to distinguish the effects of the demonstration’s incentives from unrelated spending trends in the participants’ service areas. Comparison groups’ beneficiaries are from the participants’ geographic service areas and, as such, are affected by the same local market trends as the participants. In addition, the study design included a baseline period, before the demonstration began, that helped to control for trends that may have occurred without demonstration-related interventions. A standard pre-test/post-test control group design would have randomly assigned beneficiaries to either a comparison group or a
30
For a more detailed discussion of the study design and its tradeoffs, see Donald T. Campbell and Julian C. Stanley, Experimental and Quasi-Experimental Designs for Research (Boston: Houghton Mifflin Company, 1963).