econ
stor
www.econstor.eu
Der Open-Access-Publikationsserver der ZBW – Leibniz-Informationszentrum Wirtschaft The Open Access Publication Server of the ZBW – Leibniz Information Centre for EconomicsNutzungsbedingungen:
Die ZBW räumt Ihnen als Nutzerin/Nutzer das unentgeltliche, räumlich unbeschränkte und zeitlich auf die Dauer des Schutzrechts beschränkte einfache Recht ein, das ausgewählte Werk im Rahmen der unter
→ http://www.econstor.eu/dspace/Nutzungsbedingungen nachzulesenden vollständigen Nutzungsbedingungen zu vervielfältigen, mit denen die Nutzerin/der Nutzer sich durch die erste Nutzung einverstanden erklärt.
Terms of use:
The ZBW grants you, the user, the non-exclusive right to use the selected work free of charge, territorially unrestricted and within the time limit of the term of the property rights according to the terms specified at
→ http://www.econstor.eu/dspace/Nutzungsbedingungen By the first use of the selected work the user agrees and declares to comply with these terms of use.
zbw
Leibniz-Informationszentrum WirtschaftReitz, Stefan; Schmidt, Markus A.; Taylor, Mark P.
Working Paper
Financial intermediation and the role of price
discrimination in a two-tier market
Kiel Working Paper, No. 1794
Provided in Cooperation with:
Kiel Institute for the World Economy (IfW)
Suggested Citation: Reitz, Stefan; Schmidt, Markus A.; Taylor, Mark P. (2012) : Financial intermediation and the role of price discrimination in a two-tier market, Kiel Working Paper, No. 1794
This Version is available at: http://hdl.handle.net/10419/64828
Financial Intermediation and the
Role of Price Discrimination in a
Two-Tier Market
by Stefan Reitz, Markus A. Schmidt,
and Mark P. Taylor
Kiel Institute for the World Economy, Hindenburgufer 66, 24105 Kiel, Germany
Kiel Working Paper No. 1794 | September 2012
Financial Intermediation and the Role of Price Discrimination in a
Two-Tier Market
Stefan Reitz, Markus A. Schmidt, and Mark P. Taylor
Abstract:
Though unambiguously outperforming all other financial markets in terms of liquidity, foreign exchange trading is still performed in opaque and decentralized markets. In particular, the two-tier market structure consisting of a customer segment and an interdealer segment to which only market makers have access gives rise to the possibility of price discrimination. We provide a theoretical foreign exchange pricing model that accounts for market power considerations and analyze a database of the trades of a German market maker and his cross section of end-user customers. We find that the market maker generally exerts low bargaining power vis-á-vis his customers. The dealer earns lower average spreads on trades with financial customers than commercial customers, even though the former are perceived to convey exchange-rate-relevant information. From this perspective, it appears that market makers provide interdealer market liquidity to end-user customers with cross-sectionally differing spreads.
Keywords: foreign exchange; market microstructure;pricing behavior JEL classification: F31, F41
Stefan Reitz
Kiel Institute for the World Economy 24105 Kiel, Germany
E-mail: [email protected]
Markus A. Schmidt
European Central Bank 60311 Frankfurt, Germany
Mark P. Taylor
Dept. of Economics, University of Warwick Coventry CV4 7AL, UK
____________________________________
The responsibility for the contents of the working papers rests with the author, not the Institute. Since working papers are of a preliminary nature, it may be useful to contact the author of a particular working paper about results or caveats before referring to, or quoting, a paper. Any comments on working papers should be sent directly to the author.
Financial Intermediation and the Role of Price
Discrimination in a Two-Tier Market
∗
Stefan Reitz
†Markus A. Schmidt
‡Mark P. Taylor
§Abstract
Foreign exchange trading is performed in opaque and decentralized markets. The two-tier market structure consisting of a customer seg-ment and an interdealer segseg-ment to which only market makers have access gives rise to the possibility of price discrimination. We develop a theoretical pricing model that accounts for market power considera-tions and analyze a database of the trades of a foreign exchange market maker. We find that the market maker generally exerts low bargain-ing power vis-´a-vis customers. The dealer earns lower average spreads on trades with financial customers than commercial customers, even though the former are perceived to convey exchange-rate-relevant in-formation.
JEL Classification: F31
Keywords: foreign exchange; market microstructure; pricing behavior ∗Corresponding author: Professor Mark P. Taylor, Dean, Warwick Business School,
University of Warwick, Coventry CV4 7AL, United Kingdom. [email protected] +44 (0) 7876 218 040. A substantial part of the paper was written while the first author visited the University of Warwick; Warwick’s hospitality is gratefully acknowledged. We thank Lukas Menkhoff, Carol Osler, Elvira Sojli, three anonymous referees and participants to the Fifth Central Bank Conference on Market Microstructure, the European Economic Association Conference, and the German Economic Association Conference for helpful comments. The views expressed here are those of the authors and not necessarily those of the European Central Bank.
†University of Kiel and Kiel Institute for the World Economy ‡Economics Department, European Central Bank
1
Introduction
The market microstructure literature generally suggests that market making is performed under informational asymmetry, implying that spreads include an adverse-selection component that compensates dealers for losses to pri-vately informed counterparties (Glosten and Milgrom, 1985; Kyle, 1985). Based on this literature, it is now commonly accepted that adverse selection costs are the primary channel through which asymmetric information affects spreads. The adverse selection component of spreads would be expected to rise with the likelihood that a given counterparty has private information. In an anonymous trading framework, this spread component is supposed to vary positively with order size, since larger trades should be associated with higher adverse selection costs (Easley and O’Hara, 1987; Glosten, 1989). In real-world currency markets, however, dealing is not completely anonymous, as dealers maintain business relationships with major customers (Sager and Taylor, 2006). Within the broad group of customers, importers and exporters (’commercial customers’) are considered less informed than other banks and hedge funds (jointly ’financial customers’). This is due to the fact that finan-cial customers are using professional information systems and communicate intensively with a variety of market makers, while commercial customers are, in contrast, just responding to changes in relative prices in order to maxi-mize profits from their real-side businesses. Commercial customers need to buy or sell foreign currency only occasionally and do not engage in
substan-tial foreign exchange research.1 Thus, the standard models for understanding
spreads under information asymmetry indicate that, other things being equal, currency spreads should be widest on financial customers’ large trades and narrowest on commercial customers’ small trades. Using various empirical models of FX trading such as Madhavan and Smidt (1991) and Huang and Stoll (1997), Osler et al. (2011) and Reitz et al. (2011) find, in contrast, that spreads of large deals are lower than spreads of small deals and that financial customers obtain narrower margins than commercial customers.
A possible explanation for this seemingly contradictory observation is based on the idea that commercial customers - in contrast to financial cus-tomers - generally stick to their dealer and do not spend resources on search-ing for the best available price, allowsearch-ing the market maker to quote wider spreads. Of course, in a search-and-friction model of over-the-counter mar-kets Duffie et al. (2005, 2007) show that bid-ask spreads are lower if investors can more easily find other investors, or have easier access to multiple market makers.2 Thus, a lack of customers’ information regarding current market
conditions allows a dealer to exert market power. In a cross-section of
cus-1The pronounced distinction between commercial and financial customers is meant to give an intuition for customers’ different incentives to trade and is theoretical in nature. As an anonymous referee correctly pointed out real-world customers may not be categorized in this binary fashion, but should be interpreted as a mixture of the two ’clean’ customer types. This becomes more important as changes in the FX microstructure also allow commercial customers to trade on electronic platforms (King et al., 2011).
2The market-power hypothesis complements, and is consistent with the strategic-dealing hypothesis, where currency dealers strategically subsidize trades with privately informed customers in order to learn the direction and magnitude of those customers’ trades (Osler et al., 2011).
tomers, a relatively weak bargaining position vis-´a-vis financial customers may be compensated by trades with commercial customers.
A low level of transparency as a prerequisite of price discrimination is prevalent in a number of markets, where trades are not transacted via a central marketplace, but occur in a decentralised ’over-the-counter’ (OTC) fashion. OTC-markets are relatively opaque, at least with respect to a cus-tomer’s knowledge about current quotes of every single dealer in the market. Hence, the bulk of market power studies investigate mainly OTC-markets. For example, Chakravarty and Sarkar (1999) study, among others, govern-ment bond markets, and Hong and Warga (2000) and Schultz (2001) investi-gate corporate bond trading. However, none of these studies explicitly focuses on market power considerations. Rather, they analyse bid-ask spreads with respect to specific features of the trade such as order size, which, in turn, can be indirectly related to market power. Based on theoretical considerations presented in Duffie et al. (2007), Green et al (2007), in contrast, explic-itly investigate market power on the U.S. municipal bond market applying a stochastic frontier model. Dealer intermediation in this market resulted in a large retail price dispersion and unfavorable spreads for small investors. Dunne et al. (2008) investigate the European sovereign bond market consist-ing of an (electronic) competitive interdealer market and an (electronic) mo-nopolistic customer market and find that dealer inventory management and market volatility are important for explaining spreads quoted to customers in the European bond market. Despite this work, however, the number of
studies in the field is generally low, and to our knowledge there is currently no contribution dealing empirically with market power considerations in the foreign exchange market.
In this paper we model the market maker’s transactions in the end-user segment of the foreign exchange market as an alternation offer game. The resulting transaction price appears to be a weighted average of the customer market price, which turns out to be a public information price corrected for adverse selection cost, inventory holding costs and trade execution costs, and the interdealer market price. The weights are given by the relative bargain-ing power of the counterparties. We test our model usbargain-ing a data base from a German bank’s tick-by-tick end-user order flow and respective quotes and find that financial customers exert massive market power vis-´a-vis the mar-ket maker, while marmar-ket power of commercial customers is somewhat lower, but still strong. The results suggest that market power considerations may account for earlier findings contrasting with the adverse selection hypothesis. The remainder of the paper is organised as follows. In Section 2, we develop our microstructural model of the market maker’s trading in a segmented for-eign exchange market. In Section 3 we estimate the model and discuss the empirical results. A final section concludes.
2
Modeling the Foreign Exchange Market
2.1
Market structure
The foreign exchange market is decentralised in the sense that market partic-ipants are generally separated from one another and transactions take place through media such as telephone or computer networks. Two important im-plications of decentralisation are fragmentation and low transparency. The foreign exchange market is fragmented in the sense that transactions may (and do) occur simultaneously or near simultaneously in the market at dif-ferent prices (Sarno and Taylor, 2001). It lacks transparency in the sense that the absence of a physical market place makes the process of price-information interaction difficult to observe and understand (Dominguez, 1999; Lyons, 2002). Within this market environment, two types of participants can gener-ally be distinguished: dealers and customers. While customers’ trading be-haviour is derived mainly from their core businesses, financial or commercial, foreign exchange dealers (or market makers) can be thought of as exchange-designated specialists who stand ready to buy or sell foreign currency to other market participants. Among these market makers there has evolved a market segment with a considerable market share, the interdealer market. Though the daily market turnover of this interdealer market has declined somewhat in the recent years it still accounts for more than 40 percent of total foreign exchange market turnover (Bank of International Settlements, 2007).
the Electronic Broking System (EBS) or Reuters D3000. Both systems were established in 1993 and were the primary facilitators of the subsequent marked increase in market liquidity. Their functionality is essentially equiv-alent, providing ex ante anonymous limit-order bid-ask pricing to dealers. The electronic brokers announce bid and ask prices in addition to the best bid and ask prices and their respective quantities. Prices and directions for all trades are communicated to the rest of the market (Bjønnes and Rime, 2005). As a result, market transparency is dramatically higher in brokered interdealer trading than in regular customer trading or even in direct (bilat-eral) interdealer trading. Due to the different degree of market transparency it is now commonly accepted that the pricing in the interdealer segment dif-fers from that in the broader customer market with the implication that any theoretical and empirical work has to consider the two-tier structure of the foreign exchange market (Evans and Lyons, 2006; Osler et al., 2006).
2.2
Customer trading
In the broader customer trading segment, trading is assumed to be per-formed in the following way: A market participant is approached by another and asked for quotes at which he is willing to buy or sell foreign exchange. Of course, in actual foreign exchange markets the first participant will be an exchange trading bank and the second typically an end-user customer. For the moment, however, it will be useful to consider a situation where ev-ery customer market participant may contact another for trading but none
will have access to the interdealer market. This implies that their trading may suffer from adverse selection, inventory holding costs and a broad range of execution costs. We follow - and subsequently extend - the analysis of Madhavan and Smidt (1991).
We consider a customer who wants to trade foreign currency and ap-proaches another customer and asks for a two-way price. For concreteness, assume that first customer is trying to sell an open position to the second customer. The full-information price of foreign currency denoted by υt
fol-lows a random walk. Its current value is revealed immediately after trading when its increment is announced as a part of the flow of public information signals.3 The fact that the full-information price is currently unobservable gives rise to adverse selection costs as the seller may possess private informa-tion. When additionally considering inventory control costs and execution costs, the price the buyer quotes to the approaching seller is
pct =µt−γ(It−It∗) +ψDt, (1)
wherepct denotes buyer’s quoted price,µtis the buyer’s expectation about
the true value of the exchange rate conditional upon his information at time t, (It−I∗) is the deviation of current inventory from desired inventory,Dtis an
indicator variable, whereDt=−1 represents the considered buy transaction
and ψ measures execution costs.
The seller’s pre-trade expectation of the foreign currency value mt is a
weighted average of the public information price yt and a private signal wt,
mt=θwt+ (1−θ)yt, (2)
where the coefficientθdepends on the precision of the information sources. His order flow qt results from the perceived mis-pricing of the buyer and an
idiosyncratic liquidity shock xt:
qt=α(mt−pct) +xt, (3)
where α is a positive constant. Following Glosten and Milgrom (1985), the buyer considers the fact that the order flow depends on a private signal. In order to quote prices that are regret-free after the trade has occurred, the buyer has to infer the seller’s private signal conveyed by the order flow. Bayesian updating gives a posterior meanµtof the true value of the exchange
rate:
µt =πyt+ (1−π)(pct+
1
αqt), (4)
consisting of a weighted average of the public signal and the inferred private signal from the order flow. The parameter π(0,1) is the weight placed on prior beliefs and depends on the relative precisions of signals. Substituting equation (4) into equation (1) yields the price the buyer quotes to the seller
pct =πyt+ (1−π)(pct +
1
αqt)−γ(It−I
∗
t) +ψDt, (5)
which can be regarded as a public information price corrected for adverse selection costs, inventory holding costs, and trade execution costs. Intense competition among foreign exchange customers will prevent prices from de-viating too far from the derived price. Otherwise, we should (permanently) observe quoted prices below trading costs on the part of the quoting agent or systematically inferior prices on the part of the approaching agent cut-ting into his profits of real-side businesses. We refer to equation (5) as the customer market price of foreign currency.
2.3
Interdealer market
We assume that the interdealer market consists of a subset of market par-ticipants called market makers who trade heavily via the market’s electronic platforms.4 As briefly outlined in the sub-section 2.1, the interdealer market
is characterized by substantially higher transparency than the customer mar-ket. Due to the trading protocol, the pricing in a brokered market depends heavily on information that is available to every market maker.5 Thus, the exchange rate reflects market makers’ individual information only when oth-ers assimilate that information, implying very low (if any) advoth-erse selection
4In real-world FX markets some of the financial customers such as hedge funds also trade in the interdealer market. The decision of financial customers to place their orders in different market segments is a separate line of research and beyond the scope of the paper.
5Of course, this does not mean that dealers hold identical information sets. For more details see Evans and Lyons (2006).
costs.6 Allowing for the fact that market orders are generally executed within
a very short time period (Bjønnes and Rime; 2005; Sager and Taylor, 2006), we do not expect significant inventory holding costs since dealers are able im-mediately to unload any unwanted positions. Finally, given that fixed costs of introducing access to the interdealer market are realized, trade execution costs tend to be small. Taken together, it seems to be reasonable to assume that the price paid by a market maker deviates from the interdealer market price only by (small) transaction costs φ:
pmmt =pidt +φDt, (6)
where pidt denotes the interdealer market price and pmmt is the net price the market maker would receive or have to pay in an interdealer transaction.
2.4
Price discrimination and market makers
The fact that market makers have access to both the customer and the in-terdealer market together with customer market prices differing from the interdealer market prices, according to equations (5) and (6), gives rise to the possibility of price discrimination. The extent to which the market maker is able to exploit price differences and collect monopoly rents depends on the
6Bjønnes et al. (2008) provide empirical evidence from electronic interdealer trading revealing information asymmetries between small and large banks. However, reported interdealer spreads ranging between 2 and 3 pips (Bjønnes and Rime, 2005) are small compared to customer market spreads and declined further in the 2000s as competition in the market became fierce (Gallardo and Heath, 2009). This is consistent with the Evans and Lyons’ (2006) results.
degree of his market power. Of course, the market power of dealers on quote-driven markets is heavily based on the knowledge of customers about current market conditions. In a search-and-friction model of over-the-counter mar-kets, Duffie et al. (2005, 2007) show that bid-ask spreads are lower if investors can more easily find other investors or have easier access to multiple market makers. Regarding the different types of end-user customer in the foreign exchange market, it is widely accepted that commercial customers typically know far less about market conditions than financial customers. The trading of market makers with customers is a low risk business as the former may pass any order flow from the latter immediately onto the interdealer mar-ket. To this end market makers provide access to the interdealer market at cross-sectionally varying rents. In the following, we provide a more detailed description of this argument.
For the sake of concreteness we continue to consider a selling customer asking for quotes.7 As customers may choose among different counterparts,
his lowest acceptable quote in this competitive but opaque segment is the customer market price derived in equation (5). Thus, we may define equation (5) as the reservation price of the customer. The market makers reservation price (and the decision to trade) will depend on his expectations about the price he will obtain on re-selling and the costs he anticipates in intermediating the trade. Within this framework the best price a selling customer can get from the market maker is the interdealer market price pid
t less transaction
costs. As a result, we interpret equation (6) as the reservation price of the market maker. Letpt be the price the market maker offers to the seller. The
market maker is risk-neutral with indirect utility function pmm
t −pt, i.e. the
expected profit from selling foreign currency. The selling customer is also risk-neutral with indirect utility function pt−pct, i.e. the price he receives
from the market maker less the reservation price.
The seller and market maker engage in an alternating offer game with pos-sibility of breakdown, the solution of which can be described by the general Nash solution. Let ρ be the bargaining power of the market maker relative to that of the customer, where ρ ∈ [0,1]. If ρ = 0, the seller has all the bargaining power and the buyer none, vice versa if ρ = 1. The equilibrium transaction price pt maximizes the generalized Nash product
max
pt
(pmmt −pt)ρ(pt−pct)
1−ρ, (7)
subject to the participation constraints
pmmt −pt≥0 (8)
pt−pct ≥0. (9)
The participation constraints can only be satisfied if there are positive gains from trade:
pmmt −pct ≥0. (10) If the gains from trade are not positive, the game ends and no trade takes place. The first-order condition when the gains from trade are positive is
(1−ρ)(pmmt −pt) +ρ(pct−pt) = 0. (11)
Solving (11) forpt, the equilibrium offer price is
pt=ρpct + (1−ρ)p mm
t . (12)
The transaction price is a weighted average of the customer’s and the market maker’s reservation prices. The weights are given by the relative bargaining power of the counterparties.
Substituting (5) and (6) into (12) gives
pt= (1−ρ)(pidt +φDt) +ρ[πyt+ (1−π)(pct+
1
αqt)−γ(It−I
∗
) +ψDt]. (13)
Equation (13) cannot be estimated directly because yt is unobservable.
The Madhavan and Smidt (1991) solution to this problem is to approximate the pre-trade expectation about the true value of the exchange rate using the last reservation price adjusted for inventory effects and execution costs:
where ηt is the difference between the posterior mean at time t−1 and
prior mean at time t and incorporates the public news signal. Note that, from (6) and (12), the customer’s last reservation price can be expressed in terms of the bargained price and the inter-dealer market price:
pct−1 = 1 ρpt−1− 1−ρ ρ (p id t−1+φDt−1). (15)
Substituting equations (15) and (14) in (13) we arrive at the following equation for the exchange rate change:
∆pt = (1π −1)ργI∗+ (1−ρ)∆pidt + ρ(1−π) απ qt− ργ πIt+ργIt−1 +ρψ+(1π−ρ)φπDt−[ρψ+ (1−ρ)φ]Dt−1+ρηt. (16)
The exchange rate dynamics inherent in equation (16) provide two main innovations over the standard Madhavan and Smidt (1991) model.8 First, the
change of the interdealer exchange rate is introduced as a direct measure of the customers’ relative market power vis-´a-vis the market maker: in the case of a customer with high market power, the price quoted by the market maker should follow closely the interdealer market price. Second, the coefficients of the otherwise unchanged variables exhibit a market power effect. For example, when interpreting the third term on the right-hand side of (16) we find that the contribution of order flow to the change of the exchange
8Technically, the Madhavan and Smidt (1991) model is nested in the above generalized model for (1−ρ) = 0. The interpretation is that the Madhavan and Smidt (1991) model does not contain an interdealer market providing a better quote. This lack of alternatives leaves end-users with competitive quotes from the customer market.
rate is diminished when the market maker exhibits low market power. A similar argument can be put forward when investigating the coefficients of the direction dummies. Since the standard Madhavan and Smidt (1991) model does not account for market power, the coefficient of the lagged direction dummy has been interpreted by empirical researchers as the effect of spreads varying adversely with the cross section of customer counterparties. From the perspective of our model, however, lower spreads quoted to informed financial customers may be the result of the low market power of the market maker vis-´a-vis this customer type.9 As these are important issues in a number of
recent empirical contributions (Bjønnes and Rime, 2005; Osler et al., 2006; Reitz et al., 2007), we discuss this point in more detail when we present our estimation results below.
3
Empirical Evidence
3.1
The Data
The end-user order flow investigated here is collected by a German bank, which is of average-size as regards its market share in FX trading. Though there are some big dealers by market share in currency markets, e.g. those be-ing analysed in Lyons (1995) and Evans and Lyons (2005), the relative size of the vast majority of banks participating in FX trading is virtually marginal, resulting in a highly competitive trading environment. The Bank of
Inter-9Since trading costs φin the interdealer market are small and their impact is further diminished by (1−ρ)<1, the estimated coefficient of the lagged direction dummy now approximates the combined impact of market power and transaction costs.
national Settlements’ Triennial Survey (2002), which is closest to our data set, reports aggregated daily turnover in April 2001 of 240 billion USD in the USD/EUR market from 2,531 contributing banks. At an average USD/EUR exchange rate of 0.89 in April 2001 this accounts for roughly 84.4 million EUR daily trading volume per bank. Given that our data set is based on trades of the most active dealer out of ten EUR/USD traders of the German bank at hand, the reported 47 million EUR average daily turnover represents an average market share. Theoretically, any surviving dealer in a competitive environment should be a sufficient representative of the entirety of success-ful dealers. For instance, Cheung and Chinn (2001) find market convention to be the predominant driving force of dealer behaviour, regardless of their actual market share in FX trading. The patterns presented in the paper are confirmed by market participants we have spoken to and the head of cur-rency trading at the bank analysed here fortifies our results, too. Thus, the data set investigated herein seems to be appropriate to provide insights into foreign exchange trading from the perspective of a foreign exchange dealer.
The data set consists of all foreign exchange transactions that occurred between October 2002 and September 2003, covering a period of 251 trad-ing days. While a large cross-section of dealers and currencies appears in the raw data, we examine the bank’s most active dealer in the EUR/USD market. One drawback of focusing on trades of a single dealer in one specific currency pair is that we are unable to directly calculate the bank’s inventory position. The calculation of spot inventory would involve the aggregation of
spot transactions across dealers and across currencies, because the dealers are trading various currencies against one FX portfolio. For example, the dealers can purchase USD against EUR and might offset the resulting USD long position against, e.g., GBP. Since the dataset analysed herein consists of EUR/USD transactions only, the resulting inventory time series does not show common properties like strong mean reversion, because these features refer to the bank’s overall inventory position. In addition, spot inventory of a single currency is also affected by swap transactions or exercised currency options. Nevertheless, the head of currency trading at the bank concerned confirmed that, in line with common standards, the banks overnight position aggregated over dealers and currencies is negligible due to risk management considerations of the bank. As such, it is reasonable to assume that our trader’s inventory at the end of each trading day coincides with the bank’s desired levels. Thus, we follow Lyons (1995) and set the inventory equal to zero at the beginning of a given trading day.
The structure of the data set is similar to other proprietary data used in Lyons (1995), and Bjønnes and Rime (2005), among others, with the exception of two distinguishing features. Each counterparty has a unique customer code, which allows us to classify trades according to their origin. This contrasts with Lyons (1995), where the dealer has no customer order flow and earns profits by continually ”shading” his quotes to induce interbank trades. Bjønnes and Rime (2005) only distinguish between customer trading and interbank trading. Second, the length of our sample is very much longer
than that of Lyons (five days), Bjønnes and Rime (five days), and Osler et al. (87 days). Each trade record contains the following information: (1) currency pair, (2) date and time stamp of the trade, (3) direction, (4) transaction price, (5) corresponding market price from the interdealer market collected at the exact same point in time (Reuters), (6) deal size, (7) counterparty type, and (8) the initiator of the trade. We analyze incoming trades defined as customer initiated trades for which the dealer has always been the supplier of liquidity. Order flow variables are calculated from the perspective of the deal initiator, implying that customers’ buy orders have a positive sign, and sell orders have a negative sign. Overnight price changes are removed from the data set.
[Table 1 about here]
Table 1 presents the composition of the bank’s trading by counterparty. Some 49 percent of the bank’s trades are with other interbank dealers, while 46 percent are with the bank’s customers. As a matter of fact, the dealer in this study is quite similar to those studied in earlier papers cited above. The average trade size varies across counterparties: as expected, comparatively large trades are initiated by other banks and financial customers while the mean trade size of commercial customers is approximately 20 percent of the mean trade size across all counterparties.10
3.2
Estimation Results
Equation (16) is estimated using Hansen’s (1982) generalized method of mo-ments (GMM). The estimated standard errors are adjusted for heteroscedas-ticity and serial correlation with the Newey-West (1987) covariance matrix correction. The introduction of the change of the interdealer market price may give rise to an endogeneity problem. Of course, from the microstructure literature it is concluded that customer order flow ultimately drives exchange rates in the interdealer market and not vice versa. In market microstructure models like Evans and Lyons (2004), however, the incorporation of order flow information into interdealer prices tends to be slowly in market setups where a large number of competitive dealers trade among each other simultaneously. The reason is that every dealer accounts for only a small fraction of the en-tire customer order flow making his trade a very noisy signal of market-wide dynamics. In real-world interdealer markets an information hierarchy may exist in the sense that large banks represent a substantial fraction of the en-tire customer order flow implying that their trades exhibit a significant price impact. Empirical support for this view is provided by Bjønnes et al. (2008) showing that trades by smaller banks have a lower, often statistically insignif-icant, estimated price impact than trades by large banks. Given the average size of our bank, interdealer exchange rates are used by the dealer as de-scribed above. Econometrically, this implies that price changes of our dealer should not Granger-cause price changes in the interdealer market, which is
confirmed by the data.11 Since the focus of this paper is to investigate the
importance of cross-sectional differences in customer order flow, Table 2 pro-vides estimation results of the baseline model, the model including deal size and counterparty-type dummies.
[Table 2 about here]
The coefficient on deal size is statistically significant and has the appro-priate sign in the baseline model. At first glance the data set seem to provide evidence in favour of the standard hypothesis that, due to asymmetric infor-mation, a dealer increases spreads in response to a larger order and moves prices accordingly. When disaggregating the order flow by means of deal size dummies and counterparty dummies, however, we find the relationship be-tween deal size and price movements to be concentrated on small deals with commercial or internal customers. This is surprising, because order flows from these types of customers are generally not regarded as very informative since these customers trade currencies for hedging and liquidity purposes. Moreover, the statistical insignificance of deal size parameters within the group of large deals and within the group of financial customers indicates that there is no residual linear variation of spreads according to deal size. Consistent with the results reported in Bjønnes and Rime (2005) our findings suggest that deal size is relatively unimportant. The statistical insignificance of the deal size parameters may be due to traders’ response to the strategy of dealers inferring information from order flow (Huang and Stoll, 1997).
In line with recent studies such as Bjønnes and Rime (2005) and Osler et al. (2011), we find that existing inventories have little influence, particularly when accounting for trade size or counterparty type on prices our dealer quotes to customers. This contrasts with earlier studies of interdealer trading, where evidence is provided that dealers did engage in inventory-based price shading towards other dealers (Lyons, 1995). Obviously, the dealer mostly used electronic brokered trades to unload undesired inventory because it is less expensive and faster than price shading.12
The estimated coefficient of the lagged direction dummy implies an aver-age half-spread of 6.2 pips, which is quite large compared to those reported in Bjønnes and Rime (2005) (2.95 pips) or Lyons (1995) (0.92 pips).13 We sug-gest that this result reflects fixed processing costs in a dealing environment dominated by small deal sizes. Support for this interpretation can be pro-vided by re-estimating the model using binary variables for small and large deal sizes and binary variables for counterparty types. In the case of orders with a deal size smaller than EUR 0.5 million, the estimated half-spread is 10.4 pips, while orders with a deal size greater than EUR 0.5 million were executed at an average half-spread of 1.8 pips.14 When order flow is
differ-12Re-estimation of the model omitting inventory data leave parameter estimates of the other variables unchanged.
13With the exchange rate defined as dollars per euro, a pip is equal to one hundredth of a US cent.
14We also experimented with the log of deal size as a measure of transaction costs ap-proximating transaction costs that contains fixed component and a size-varying component with moderate slope. The estimation results indicated that the transaction costs vary lin-early with log of the deal size implying that transaction costs per million EUR of deal size decline. Moreover, commercial and internal customers still pay larger spreads than
entiated by counterparty type, the half-spread is just 1.58 pips for financial customers, but 9.8 (15.3) pips if the counterparty is a commercial (internal) customer.15
So far, the numbers presented in Table 2 appear to be reasonable com-pared to those reported in previous studies. Regarding the innovation of the paper, we find strong evidence in favour of our approach. Measuring cus-tomers’ relative market power vis-´a-vis the market maker by the fraction of the exchange rate change which is explained by the change of the interdealer market price leads to statistically significant and economically meaningful coefficients. We find that financial customers exert massive market power vis-´a-vis the market maker, while market power of commercial and internal customers is somewhat lower, but still strong. The Wald test of the Null hypothesis of identical market power coefficients of financial and commercial customers yields a t-statistic of 2.56, statistically significant at the one per-cent level. From the perspective of the market maker the different coefficients are also economically significant. The market maker’s negotiation leverage vis--vis commercial customers (0.14) is roughly five times larger than vis--vis financial customers (0.03).16
financial customers. Since the overall fit of the model worsens and all other coefficients remain largely unchanged we refrain from reporting these results.
15The estimated half-spreads are quite close to those reported in Osler et al. (2011) implying that the order flow investigated here seems to be representative for customer trading in foreign exchange.
16It might be argued that lower market power of commercial customers is largely due to small deal sizes. Re-estimation of the model excluding trades with deal size below 1 million EUR results in an even lower market power of commercial customers, while the remaining coefficients remain largely unchanged.
This implies that even in case of commercial customers trading in the foreign exchange market leaves little room for market maker’s price discrim-ination. It seems that market makers in a competitive two-tier market envi-ronment post quotes that follow quite closely developments in the interdealer market.17
Our results provide an explanation for some earlier findings on foreign currency pricing. In particular, the estimated coefficients of the direction dummies along the lines of the standard Madhavan and Smidt (1991) model have been proven to be contradictory to the standard adverse selection ar-gumentation as the potential information content - measured by trade size or counterparty type - and customer spreads are negatively correlated (Osler et al., 2006; Reitz et al., 2007). Of course, a statistically significant negative relationship between trade size and spreads is observed in other quote-driven markets, too. For example, Harris and Piwowar (2006) find that spreads average 2.23 percent for small trades and 0.10 percent for large trades in the municipal bond market. A similar result is found for the U.S. corporate bond market (Goldstein et al., 2007) and for the London Stock Exchange (Hansch et al., 1999). From the perspective of our model, wider spreads paid by less well informed customers can be explained, in large part, due to relatively low market power. This becomes obvious when analysing the theoretical coeffi-cient of the lagged direction dummy in equation (16). The second term of
17These results provide empirical evidence for the Evans and Lyons (2006) model of information aggregation in a two-tier foreign exchange market. There, a market maker trading in the customer market segment posts quotes based on interdealer market prices.
the coefficient is negligible as it represents transaction costs in the interdealer market corrected by relative market power of customers. When extracting transaction costs in the customer market using the estimated coefficients of counterparty-type market power, we find that ψ = 69.64 in the case of com-mercial customers and ψ = 52.66 in the case of financial customers - i.e. they are in a similar range.18 These results are confirmed by empirical con-tributions investigating transparent markets with little or no opportunity of price discrimination. For example, Harris and Hasbrouck (1996), Bernhardt and Hughson (2002), Peterson and Sirri (2003) find spreads to be positively related to transaction size on the (more transparent) floor-trading New York Stock Exchange. Moreover, the negative relationship between trade size and FX customer spreads does not extend to the FX interbank market either, for which Lyons (1995) finds a positive relationship between trade size and spreads, and Bjønnes and Rime (2005) find little or no relationship. Thus, the empirical evidence from different asset markets supports our view that it is price discrimination that primarily determines the sign of the relationship between the potential information content and spreads of trades.
In standard applications of the Madhavan and Smidt (1991) model the ratio of the lagged and current direction coefficient gives the average weight put on prior information (π). Although the ratio may only give a slightly
18Indeed, considering interdealer transaction costs within a reasonable range would somewhat increase the difference between the two estimates for ψ. This is a natural consequence of the fact that narrowing down the difference of transaction costs between customer and interdealer markets would diminish the opportunities for price discrimina-tion.
biased measure due to market power considerations, we find that the coeffi-cientπ is generally close to unity implying that the dealer does not perceive his order flow to be very informative. This is in line with the interpretation of our results regarding the deal size qt.
4
Robustness checks
4.1
Is there a Time-of-Day effect on Price
Discrimina-tion?
Empirical studies od financial markets repeatedly reveal time-varying trad-ing volume throughout a tradtrad-ing day. Tradtrad-ing volume is supposed to be high in the morning hours, when market participants adjust their portfo-lios to new (overnight) information. Around lunch time, less trading occurs when dealers are away from their desks. Trading volume again increases in the afternoon session. Admati and Pfleiderer (1988) provide a model of U-shaped trading volumes, where informed traders are dealing with uninformed liquidity traders, who are either discretionary as regards the time they are trading in the course of the day or non-discretionary in this respect. In this model, high-volume periods are obtained when (i) informed traders are at-tracted by the presence of many uninformed traders, so informed flows can easily be camouflaged and (ii) discretionary liquidity traders attend because of relatively low trading costs amid increased price competition due to high trading-activity. However, subsequent empirical contributions challenged the view that trading costs are low when informed agents trade in the market.
Bollerslev and Domowitz (1993) argue that the U-shaped pattern in trading volume largely stems from non-discretionary liquidity trading that is most pronounced at the beginning and the end of the trading day.
The time-varying nature of market liquidity may in fact influence the ne-gotiation leverage of the market maker. To deal with this potential variation of market power we separately estimate the model using three sub-periods, a morning session ranging from 8.00 am. to 11.00 am., a noon session between 11.00 am. and 2 pm., and an afternoon session between 2 pm. and 6.00 pm. Aggregation over the full sample yield a turnover 3.9 billion EUR in the morning sessions, 3.1 billion EUR stem from the noon sessions, and 5.1 billion EUR arise from the afternoon trading sessions, which is in line with the above suggestion of time-varying market liquidity.
[Table 3 about here]
When comparing the estimation results represented in Table 3 we find that, in general, the parameter coefficients change slightly over different trad-ing sessions. However, the market power coefficients reveal some stronger time variation. The negotiation leverage of the dealer increases as market liquidity declines around lunch time. It subsequently declines again in case of financial customers, but increases even further in case of commercial cus-tomers. We interpret these estimation results as an indication for a generally negative relationship between market liquidity and market makers’ negotia-tion leverage, which may be interfered by a cross-secnegotia-tionally differing pressure
to minimize open position before markets close. Additionally, the structure of market power vis-´a-vis different counterparty types remains unchanged. This provides further support for the market power hypothesis of FX trading.
4.2
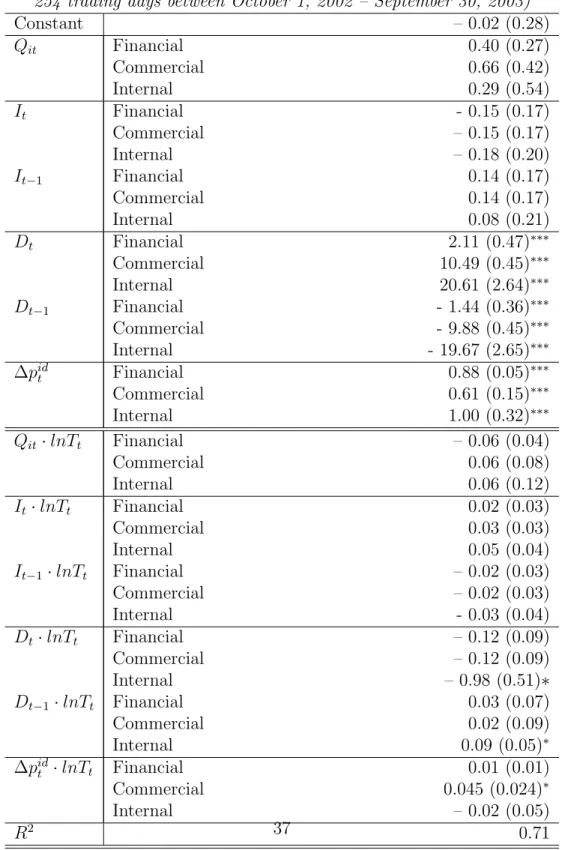
Is there a Role for Intertrade Time Durations?
Like many empirical contributions to the market microstructure literature our data set is non-standard in the sense that the transactions are not equidis-tant. Of course, decreasing or increasing time durations between transactions may be an indicator of a changing market environment and might alter the pricing behavior of a market maker. For example, Dufour and Engle (2000) find that as waiting times between transactions decrease, the price impact of trades and the speed of price adjustment to trade-related information in-crease. Consistent with Easley and O’Hara (1992) these periods of increased market activity may be due to a strengthened presence of informed traders incurring elevated adverse selection costs. Conversely, one can easily imag-ine situations where price movements influence subsequent arrival rates of trades. For example, a sudden drop of the exchange rate might trigger a number of stop-loss orders, or, the market maker might react by widening spreads thereby discouraging order submissions. However, as the empirical importance of these feedback effects is not clear, we maintain the exogeneity assumption for the time process and treat intertrade time durations Tt as
strongly exogeneous (Dufour and Engle, 2000). Under these circumstances, equation (16) can be augmented by the impact of intertrade time durations
as follows:
∆pt=α+ (β0+β1lnTt)·Xt+ut, (17)
where β0 and β1 are vectors of coefficients and Xt is the vector of the regressors as contained in equation (16). Table 4 reports the estimation results of the model specification using counterparty dummies.
[Table 4 about here]
While the coefficients of the regressors remain in the same range as be-fore, the interaction terms of regressors and intertrade time durations are statistically insignificant at the five percent level. This suggests that time variation of intertrade durations does not substantially change the pricing behavior of the market maker.
5
Conclusion
In this paper we provide a new pricing model which allows for a hetero-geneous market structure. In contrast to most microstructural models of financial markets, our approach accounts for the existence of two-tier mar-ket structure consisting of a customer segment and an interdealer segment. Because separated market segments give rise to the possibility of price dis-crimination our model incorporates market power considerations. We analyze a database of a German dealer and his cross section of end-user customers’
dealer’s bargaining power and find that financial customers exert massive market power vis-´a-vis the market maker, while the market power of com-mercial customers is somewhat lower, but still strong. Consequently, the dealer earns lower average spreads on trades with financial customers than with commercial customers. The dealer tolerates lower spreads in trades with well informed customers because he is able immediately to unload order flow into the interdealer market.
The stylized FX trading model we outlined in this paper is focussed on the role of price discrimination in the foreign exchange market. From this perspective, market makers provide interdealer market liquidity to end-user customers with cross-sectionally differing spreads. The results suggest that price discrimination is an important aspect of dealers’ pricing behavior. This does not neglect other incentives to trade in the foreign exchange market. For instance, the strategic-dealing hypothesis, where currency dealers strate-gically subsidize trades with privately informed customers in order to learn the direction and magnitude of future order flow, seems to be an important route of further research.
References
Admati, A. and P. Pfleiderer, 1988, A Theory of Intraday Patterns: Volume and Price Variability. Review of Financial Studies 1, 3 - 40.
Bank of International Settlements, 2002, Triennial Central Bank Survey -Foreign Exchange and Derivatives Market Activity, December 2002. Bank of International Settlements, 2007, Triennial Central Bank Survey
-Foreign Exchange and Derivatives Market Activity, December 2007. Berger, D., A. Chaboud, S. Chernenko, E. Howorka, R. Iyer, D. Liu, and J.
Wright, 2008, Order Flow and Exchange Rate Dynamics in Electronic brokerage System data,Journal of International Economics 75, 93 - 109. Bernhardt, D., and E. Hughson, 2002, Intraday trade in dealership markets,
European Economic Review 46, 1697 - 1732.
Bjønnes, G., C. Osler and D. Rime, 2008, Asymmetric information in the in-terbank foreign exchange market, Norges Bank Working Paper 2008/25. Bjønnes, G., and D. Rime, 2005, Dealer Behavior and Trading Systems in Foreign Exchange Markets, Journal of Financial Economics 75, 571 -605.
Bollerslev, T. and I. Domowitz, 1993, Trading Patterns and Prices in the Interbank Foreign Exchange Market, Journal of Finance 48, 1421 - 43. Chakravarty, S., and A. Sarkar, 1999, Liquidity in U.S. Fixed Income
Mar-kets: A Comparison of the Bid-Ask Spread in Corporate, Government and Municipal Bond Markets, Working Paper, Federal Reserve Bank of New York.
Dominguez, K. M., 1999, The Market Microstructure of Central Bank Inter-vention. NBER Working Paper No. 7337.
Duffie, D., N. Garleanu, and L. H. Pedersen, 2005, Over-the-Counter Mar-kets, Econometrica 73, pp. 1815 - 1847.
Over-the-Dufour, A. and R. Engle, 2000, Time and the Price Impact of a Trade,
Journal of Finance 55, 2467 – 2498.
Dunne, P., Hau, H., and M. Moore, 2008, A Tale of Two platforms: Dealer Intermediation in the European Sovereign Bond Market, CEPR Discus-sion Paper No. 6969.
Easley, D., and M. O’Hara, 1987, Price, Trade Size, and Information in Securities Markets, Journal of Financial Economics 19, 69 - 90.
Easley, D., and M. O’Hara, 1992, Time and the Process of Security Price Adjustment, Journal of Finance 47, 577 – 605.
Evans, M., and R. Lyons, 2002, Order Flow and Exchange Rate Dynamics,
Journal of Political Economy 110, 170 - 180.
Evans, M., and R. Lyons, 2004, A New Micro Model of Exchange Rate Dynamics, NBER Working Paper No. 10379.
Evans, M., and R. Lyons, 2005, Meese-Rogoff Redux: Micro-Based
Exchange-Rate Forecasting, American Economic Review, Papers and
Proceedings 95, 405 - 414.
Evans, M., and R. Lyons, 2006, Understanding Order Flow, International Journal of Finance and Economics 11, 3 - 23.
Gallardo, P. and A. Heath, 2009, Execution Methods in Foreign Exchange Markets, Bank of International Settlements Quarterly Review, March 2009, 83 - 91.
Goldstein, M., E. Hotchkiss, and E. Sirri, 2007, Transparency and liquidity: A controlled experiment on corporate bonds,Review of Financial Studies
20, 235 - 273.
Glosten, L., 1989, Insider Trading, Liquidity, and the Role of the Monopolist Specialist, Journal of Business 62, 211 - 235.
Glosten, L., and P. Milgrom, 1985, Bid, Ask, and Transaction Prices in a Specialist Market With Heterogeneously Informed Agents, Journal of Financial Economics 14, 71 - 100.
Green, R., B. Hollifield, and N. Schurhoff, 2006, Financial Intermediation and the Costs of Trading in an Opaque Market, Review of Financial Studies 20, 275 - 314.
Hansch, O., N. Naik, and S. Viswanathan, 1999, Preferencing, internaliza-tion, best execuinternaliza-tion, and dealer profits, Journal of Finance 54, 1799 -1828.
Hansen, L., 1982, Large Sample Properties of Generalized Method of Mo-ments Estimators, Econometrica 50, 1029 - 1054.
Harris, L., and J. Hasbrouck, 1996, Market vs. limit orders: The Super-DOT evidence on order submission strategy, Journal of Financial and Quantitative Analysis 31, 213 - 231.
Harris, L., and M. Piwowar, 2006, Secondary Trading Costs in the Municipal Bonds Market, Journal of Finance 61, 1361 - 1397.
Hong, G., and A. Warga, 2000, An Empirical Study of Bond Market Trans-actions, Financial Analysts Journal 56, 32 - 46.
Huang, R., and H. Stoll, 1997, The Components of the Bid-Ask Spread: A General Approach, Review of Financial Studies 10, 995 - 1034.
King, M., C. Osler, and D. Rime, 2011, Foreign Exchange Market Structure, Players, and Evolution, Norges Bank Research Department Working Paper no. 2011-10.
Kyle, A., 1985, Continuous Auctions and Insider Trading, Econometrica 53, 1315 - 1335.
Lyons, R., 1995, Tests of microstructural hypotheses in the foreign exchange market, Journal of Financial Economics 39, 321 - 351.
Lyons, R., 2002, Theoretical Perspective on Euro Liquidity.Economic Policy
17, 35, 572-597.
Madhavan, A. and S. Smidt, 1991, A Bayesian Model of Intraday Specialist Pricing, Journal of Financial Economics 30, 99 - 134.
Newey, W., and K. West, 1987, A Simple positive Semi-Definite, Het-eroscedasticity and Autocorrelation Consistent Covariance Matrix,
Econometrica 55, 703 - 708.
Osler, C., A. Mende, and L. Menkhoff, 2011, Price discovery in currency markets, Journal of International Money and Finance 30, 1696 - 1718. Payne, R., 2003, Informed Trade in Spot Foreign Exchange Markets: An
Empirical Investigation, Journal of International Economics 61, 307 -329.
Peterson, M. A. and E. Sirri, 2003, Order preferencing and market quality on U.S. equity exchanges, Review of Financial Studies 16, 385 - 415. Reitz, S., Schmidt, M. A., and M. P. Taylor, 2011, End-User Order Flow and
Exchange Rate Dynamics, European Journal of Finance.
Sager, M., and M.P. Taylor, 2006, Under the Microscope: the Structure of the Foreign Exchange Market, International Journal of Finance and Economics 11, 81-95.
Schultz, P., 2001, Corporate Bond Trading Costs: A Peek Behind the Cur-tain, Journal of Finance 56, 677 - 698.
T able 1: T rading activit y of a German bank 254 tr ading days betwe en Octob er 1, 2002 and Septemb er 30, 2003 Financial Cust. Commercial Cust. In ternal Cust. In terbank Cust. All Cust. Incoming transactions 189 5,229 639 5,773 11,83 P ercen t 1.6% 44.2% 5.4% 48.8% 100.0% p er trading da y 0.8 20.8 2.5 23 47.1 T urno v er (EUR mi llion) 841 1,118 1,044 9 ,049 12,052 Mean size sp ot (EUR million ) 4.4 0.2 1.6 1.6 1.2
T able 2: Spread v ariatio n across deal siz e and coun terpart y typ e 254 tr ading days betwe en Octob er 1, 2002 – Septemb er 30, 2003 (11,830 obs.) Baseline MS Size Dummies Coun terpart y Dummies Constan t 0.03 (0.03) 0.02 (0.03) -0.01 (0.27) Deal Size Qit 0.33 (0.12) ∗∗∗ Large 0.01 (0.02) Financial 0.05 (0.04) Small 21.1 (1.72) ∗∗∗ Commercial 0.94 (0.16) ∗∗∗ In ternal 0.33 (0.12) ∗∗∗ In v en tory It 0.03 (0.01) ∗ Large -0.006 (0.015) Financial -0.006 (0.018) Small 0.004 (0.015) Commercial 0.001 (0.017) In ternal 0.037 (0.044) Lagged In v en tory It− 1 – 0.04 (0.01) ∗∗ Large 0.005 (0.015) Financial 0.005 (0.017) Small – 0.007 (0.014) Commercial – 0.003 (0.016) In ternal -0.096 (0.04) ∗∗ Direction Dt 6.46 (0.15) ∗∗∗ Large 1.62 (0.12) ∗∗∗ Financial 1.49 (0.11) ∗∗∗ Small 11.9 (0.21) ∗∗∗ Commercial 9.84 (0.15) ∗∗∗ In ternal 15.4 (0.99) ∗∗∗ Lagged Direction Dt − 1 -6.18 (0.22) ∗∗∗ Large -1.79 (0.11) ∗∗∗ Financial -1.58 (0.11) ∗∗∗ Small -10.4 (0.20) ∗∗∗ Commercial -9.75 (0.14) ∗∗∗ In ternal -15.3 (1.03) ∗∗∗ In terdealer price ∆ p id t 0.92 (0.02) ∗∗∗ Large 0.97 (0.02) ∗∗∗ Financial 0.97 (0.02) ∗∗∗ Small 0.86 (0.03) ∗∗∗ Commercial 0.86 (0.04) ∗∗∗ In ternal 0.87 (0.09) ∗∗∗ R 2 0.58 0.69 0.70 Notes: The dep enden t v ariable is the change of the currency price measured in pips b et w een tw o incoming deals. The set of instrumen ts equals the set of regressors implying that the par ameter estimates parallel OLS estima tes (see Bjønnes and Rime, 2005). ∗ ( ∗∗ , ∗∗∗ ) denote significa nce at the 10% (5%, 1%) lev el.
T able 3: Spread v ariation across da ytime and coun terpart y typ e 254 tr ading days betwe en Octob er 1, 2002 – Septemb er 30, 2003 (11,830 obs.) Morning No on Afterno on Constan t 0.01 (0.19) -0.21 (0.23) 0.11 (0.22) Deal Size Qit Financial 0.08 (0.08) 0.69 (0.16) ∗∗∗ 0.26 (0.22) Commercial 1.12 (0.26) ∗∗∗ 0.65 (0.18) ∗∗∗ 1.81 (0.39) ∗∗∗ In ternal -0.20 (0.13) 2.33 (0.87) ∗∗∗ 0.40 (0.23) ∗ Direction Dt Financial 1.40 (0.19) ∗∗∗ 2.72 (0.26) ∗∗∗ 1.41 (0.17) ∗∗∗ Commercial 10.18 (0.29) ∗∗∗ 10.21 (0.22) ∗∗∗ 9.32 (0.23) ∗∗∗ In ternal 2.90 (1.19) ∗∗ 20.82 (1.19) ∗∗∗ 10.75 (1.50) ∗∗∗ Lagged Direction Dt − 1 Financial -1.43 (0.19) ∗∗∗ -1.87 (0.17) ∗∗∗ -1.55 (0.16) ∗∗∗ Commercial -10.00 (0.32) ∗∗∗ -10.39 (0.21) ∗∗∗ -9.00 (0.22) ∗∗∗ In ternal -2.88 (1.08) ∗∗∗ -20.51 (1.12) ∗∗∗ -10.14 (1.51) ∗∗∗ In terdealer price ∆ p id t Financial 0.98 (0.01) ∗∗∗ 0.87 (0.04) ∗∗∗ 0.92 (0.03) ∗∗∗ Commercial 0.91 (0.04) ∗∗∗ 0.76 (0.04) ∗∗∗ 0.68 (0.03) ∗∗∗ In ternal 0.97 (0.03) ∗∗∗ 0.83 (0.14) ∗∗∗ 0.59 (0.15) ∗∗∗ R 2 0.80 0.71 0.61 Notes: The dep enden t v ariable is the change of the currency price measured in pips b et w een tw o incoming deals. The set of instrumen ts equals the set of regressors implying that the parameter estimates parallel OLS estimates (Bjønnes and Rime, 2005). ∗ ( ∗∗ , ∗∗∗ ) denote significanc e at the 10 % (5%, 1%) lev el.
Table 4: Spread variation and Intertrade Time Durations
254 trading days between October 1, 2002 – September 30, 2003)
Constant – 0.02 (0.28) Qit Financial 0.40 (0.27) Commercial 0.66 (0.42) Internal 0.29 (0.54) It Financial - 0.15 (0.17) Commercial – 0.15 (0.17) Internal – 0.18 (0.20) It−1 Financial 0.14 (0.17) Commercial 0.14 (0.17) Internal 0.08 (0.21) Dt Financial 2.11 (0.47)∗∗∗ Commercial 10.49 (0.45)∗∗∗ Internal 20.61 (2.64)∗∗∗ Dt−1 Financial - 1.44 (0.36)∗∗∗ Commercial - 9.88 (0.45)∗∗∗ Internal - 19.67 (2.65)∗∗∗ ∆pid t Financial 0.88 (0.05) ∗∗∗ Commercial 0.61 (0.15)∗∗∗ Internal 1.00 (0.32)∗∗∗ Qit·lnTt Financial – 0.06 (0.04) Commercial 0.06 (0.08) Internal 0.06 (0.12) It·lnTt Financial 0.02 (0.03) Commercial 0.03 (0.03) Internal 0.05 (0.04) It−1·lnTt Financial – 0.02 (0.03) Commercial – 0.02 (0.03) Internal - 0.03 (0.04) Dt·lnTt Financial – 0.12 (0.09) Commercial – 0.12 (0.09) Internal – 0.98 (0.51)∗ Dt−1 ·lnTt Financial 0.03 (0.07) Commercial 0.02 (0.09) Internal 0.09 (0.05)∗ ∆pid t ·lnTt Financial 0.01 (0.01) Commercial 0.045 (0.024)∗ Internal – 0.02 (0.05) R2 0.71
Notes: The dependent variable is the change of the currency price measured in pips between two incoming deals. The set of instruments equals the set of regressors implying that the parameter estimates parallel OLS estimates (see Bjønnes and Rime, 2005).