Middlesex University Research Repository
An open access repository of
Middlesex University research
http://eprints.mdx.ac.ukNguyen, Bang and Ekinci, Yuksel and Simkin, Lyndon and Melewar, T.
C. (2015) The brand likeability scale: an exploratory study of likeability
in firm-level brands. International Journal of Market Research, 57 (5).
pp. 777-800. ISSN 1470-7853
http://dx.doi.org/10.2501/IJMR-2015-063
Final accepted version (with author's formatting)
Available from Middlesex University’s Research Repository at
http://eprints.mdx.ac.uk/18970/
Copyright:
Middlesex University Research Repository makes the University’s research available electronically.
Copyright and moral rights to this thesis/research project are retained by the author and/or other copyright owners. The work is supplied on the understanding that any use for
commercial gain is strictly forbidden. A copy may be downloaded for personal,
non-commercial, research or study without prior permission and without charge. Any use of the thesis/research project for private study or research must be properly acknowledged with reference to the work’s full bibliographic details.
This thesis/research project may not be reproduced in any format or medium, or extensive quotations taken from it, or its content changed in any way, without first obtaining permission in writing from the copyright holder(s).
If you believe that any material held in the repository infringes copyright law, please contact the Repository Team at Middlesex University via the following email address:
1
The Brand Likeability Scale: An Exploratory Study of Likeability in
Firm-Level Brands
Bang Nguyen
East China University of Science and Technology, Marketing, School of Business, 130 Meilong Road, Shanghai 200237, China
T.C. Melewar
Department of Marketing and Strategy, The Business School, Middlesex University, London, UK
Yuksel Ekinci
Reading University, Henley Business, Reading, UK
Lyndon Simkin
2
The Brand Likeability Scale: An Exploratory Study of Likeability in
Firm-Level Brands
ABSTRACT
We develop a new measurement scale to assess consumers’ brand likeability in firm-level brands. We present brand likeability as a multi-dimensional construct. In the context of service experience purchases, we find that increased likeability in brands results in (1) greater amount of positive association, (2) increased interaction interest, (3) more personified quality, and (4) increased brand contentment. The four-dimensional multiple-item scale demonstrates good psychometric properties, showing strong evidence of reliability as well as convergent,
discriminant, and nomological validity. Our findings reveal that brand likeability is positively associated with satisfaction and positive word-of-mouth. The scale extends existing branding research, providing brand managers with a metric so that likeability can be managed strategically. It addresses the need for firms to act more likeable in an interaction-dominated economy.
3 We present theoretical implications and future research directions on the holistic brand
likeability concept.
4
1. INTRODUCTION
Researchers advocate the importance of creating, managing, and evaluating consumer-brand relationships (e.g. Schmitt 2013; Tuškej, Golob, and Podnar 2013). Scholars stipulate more research to understand the quality of these relationships by investigating topics such as brand perceptions (Brunk 2012) and brand attitudes (Woo and Winterich 2013). In the current study, we conceptualize, develop, refine, and test a new multi-dimensional scale of brand likeability to measure consumers’ likeability perceptions of firm-level brands1. We posit that likeability is a cognitive process that preludes important outcomes such as brand attachment (Park et al. 2010), brand love (Batra et al. 2012), and brand satisfaction (Fornell, Rust, and Dekimpe 2010), and used to evaluate the quality of consumer-brand relationships (Lam et al. 2013; Park et al. 2010).
Our conceptualization of brand likeability submits an innovative scale that encapsulates a broader domain than existing measures. For example, while satisfaction provides a good measure for customers’ overall evaluation of the offerings’ performance (e.g. Fornell et al. 2010; Johnson and Fornell 1991), we recognize that satisfaction is a post-experience measure (Ekinci, Dawes, and Massey 2008), which is a condition that is not necessary for likeability to occur (Reinhard and Messner 2009). Researchers posit that likeability concerns all phases, that is, pre-, during, and post-purchase and consumption (Nguyen et al. 2012; Reysen 2005). Developing a likeability scale, thus, has the potential to measure preceding perceptions, giving brand managers an
important and early indication of brand approval among their consumers. In the present study, however, we focus exclusively on the post-purchase condition. We note that for purposes of our
1
We focus on firm-level brands, and define these to include services- and retail firms, from the perspectives of end-consumers, which is not to be confused with retail product-level brands.
5 exploratory study and due to the nature of scale development (Bearden et al. 2011), we used a sample with actual brand service experiences, thus, we did not focus on a pre-purchase condition, but rather on post-purchase brand likeability.
We posit that, to date, few studies have measured the factors influencing consumers’
perceptions of brand likeability in firm-level brands (e.g. Albert et al. 2008; Nguyen et al. 2013a; Reysen 2005). Thus, we respond to this gap with the brand likeability scale, assisting brand managers with the assessment, measurement, and evaluation of likeability, which in turn, may predict the quality of the consumer-brand relationship. Our emerging brand likeability concept thus contributes to the brand personality concept (Aaker 1997; Lee 2013) and enhances more long-term consumer-brand relationships (Schmitt 2013), considered as vital in this interactive market (Santos-Vijande et al. 2013). It is particularly a priority for firms focusing on a positive brand image (Romaniuk 2013) and brand reputation (Akdeniz, Calantone and Voorhees 2013). In the next section, we present our scale in detail. The process of developing a new measure starts with the scale development process (Parasuraman et al. 2005). This process must be
associated with the conceptual development of construct (Lages et al. 2005). Hence, in our study, we provide: (1) a conceptualization that captures the domains of the construct, (2) a brand
likeability measure from the customers’ point of view, and (3) a validation of psychometric properties of the brand likeability scale.
6 The likeability of a brand plays an important role for firms that rely on their brands (Albert et al. 2008). In the psychology literature, likeability has been defined as “a persuasion tactic and a scheme of self-presentation” (e.g. Cialdini 1993; Kenrick, Neuberg, and Cialdini 2002; Reysen 2005). Researchers find that likeability is described by a multidimensional construct with cognitive and affective components (Alwitt 1987). For example, Reysen (2005) constructed a scale to study features of a person’s likeability by looking at factors such as friendliness, approachability, attractiveness, levels of knowledge, similarity to oneself, and agreeableness.
In line with past studies, we consider likeability as a construct made of multiple dimensions (Chaiken and Eagly 1983; Nguyen et al. 2013a). We view brand likeability in the context of service experiences and adopt the consumer behavior approach. Thus, from the consumer behavioral perspective, brand likeability is defined as the assessment of appeal a customer has for a brand (Nguyen et al. 2013a). The context, which led developing a multi-dimensional measure, builds on several key points. Scholars put forward that (1) commonly used single item measures lack reliability and validity (e.g. Hair et al. 2006); (2) single item scales do not
contribute to understanding likeability as a multidimensional concept (Reysen 2005); (3) in the marketing context, the dominant focus has been on satisfaction or brand reputation, which does not encapsulate the broad dimensionality of likeability perceptions (Nguyen et al. 2013b). The conceptual model of brand likeability used for our study draws from existing studies in
likeability and aims to refine these existing conceptualizations. We propose to develop a measure of brand likeability and a corresponding model of likeability that include both psychological and functional brand attributes that influences consumer attitudes and purchase intentions. It will aid researchers and practitioners in understanding and handling likeability differently and efficiently.
7 As resources invested in consumer-brand relationships and interactive brand personalities are increasing, we suggest that evaluation of likeability is essential. This preludes the objective of assessing impact of likeability on key outcomes such as satisfaction and increased loyalty.
3. DEVELOPMENT OF A BRAND LIKEABILITY SCALE
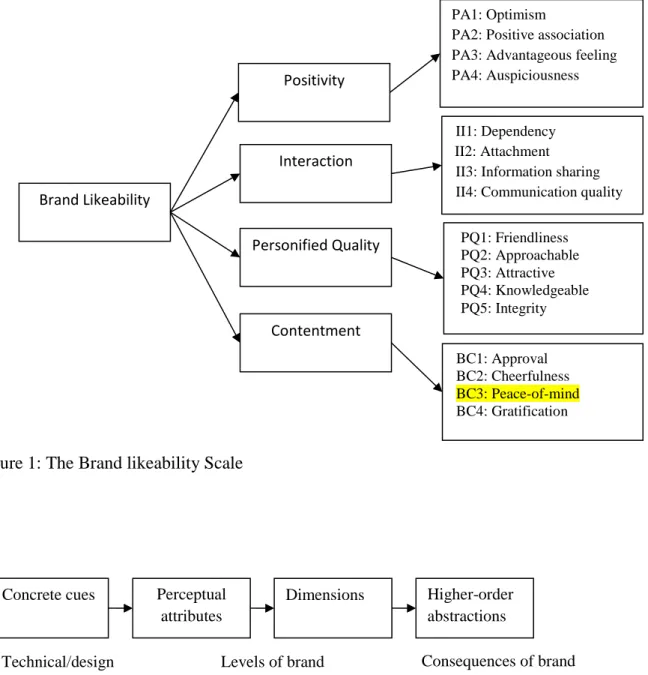
We build on validated and reliable measurement scales from cognitive psychology (Reysen 2005) and branding (Nguyen et al. 2013a) to propose a multi-dimensional scale to assess brand likeability in a service experience context. We conceptualize brand likeability in Figure 1. Our new brand likeability scale comprises four dimensions: (1) positivity, (2) interaction, (3),
personified quality, and (4) brand contentment. We further previous studies by adapting, refining, and testing the four scales in an integrated model and scale (Klaus and Maklan 2012;
Parasuraman et al. 2005; Reysen 2005). Our definition of brand likeability corresponds to our conceptualization and the verified brand likeability scale: “Brand likeability is the assessment of positivity, interaction, personification, and contentment in a multi-dimensional framework.” We propose likeability as an underlying commonality among the four dimensions and integrate previously isolated measures into a unique multi-dimensional scale. We explain these in detail next.
< INSERT FIGURE 1 ABOUT HERE >
8 We define the positivity-dimension as the extent to which associations directed towards the source are optimistic and positive. Based on the positivity scale (Narvaez, 2006), our definition emphasizes the amount of optimistic attitude a customer has for a brand. In addition, we draw from the positive aspect of attributions theory (Helson 1948), and provide guidance in
understanding the inferences that people make when they wonder why an event occurred
(Campbell 1999; Folkes 1988; Weiner 1985). Heider (1958) proposed the importance of looking at how individuals interpret events and how it relates to their thinking and behavior. The
attributions concept, therefore, suggests that likeability occurs when customers have positive associations/inferences towards the firms’ activities. That is, when a positive motive is attributed to a firm, customers may find the firm likeable.
The positivity-construct comprises four items, namely: (1) optimism, (2) positive association, (3) advantageous feeling, and (4) auspiciousness. Positivity is a crucial element of likeability. Consumers with optimistic attitudes (Narvaez 2006); positive associations and inferences
towards the brands (Campbell 1999); feelings of being advantageous (Nguyen and Simkin 2012) and; assertions on auspiciousness, that is, brands’ continued fulfillment of its promises (Ambler and Styles, 1996) characterize attributes, which provide positive likeability perceptions.
3.2 Interaction interest
Rather than traditional one-way communication, scholars suggest that communicating with customers is becoming more interactive (e.g. Kaplan and Haenlein 2010; Mamic and Almaraz, 2013). This interactional process is often known as dual creation of value (Boulding et al. 2005)
9 or value co-creation (Troye and Supphellen 2012). We define the interaction-dimension as customers’ interest to interact and communicate, i.e. share information with the brand. In our scale, we focus on those interactions that arise from interested customers, thereby, the sub-scale ‘interaction interest.’ We assume here that when customers are interested in building a
relationship through interaction (Boulding et al. 2005), they like the brand, which they interact with. We posit, for example, that the use of social media, customization of deals and offers, and personalized messages, make it vital to understand the importance of personalized
communication and interaction. Firms communicate with their customers on a one-to-one basis as part of their customer engagement tactics, using tools such as customer relationship
management (Bouldinget al. 2005) or customer experience management (Klaus and Maklan 2012a). This is especially popular via social media and web-communities such as Twitter, Facebook, or blogs, where firms interact with their customers individually (Kaplan and Haenlein 2010). The benefits include opportunities for a more engaging experience (Peppers, Rogers, and Dorf 1999), better service (Simonson 2005), and more intimate relationships (Dibb and Simkin 2009). These elements directly link with increased loyalty, leading to opportunities for upselling and cross-selling (Frow et al. 2011; Peppers and Rogers 2010).
The interaction interest-construct comprises four items, namely: (1) dependency, (2) attachment, (3) information sharing, and (4) communication quality. It assesses the extent to which there is a permanent interaction between the consumer and brand (Lages et al. 2005). We adapt the interaction conceptualization from Lages et al. (2005) and Menon et al.’s (1999) work on communication quality. Communication is defined as the two-way exchange to achieve shared understanding (Duncan and Moriarty 1998). We extend the construct with dimensions
10 related to our study, namely, attachment (Ahuvia 2005) and dependency (Boulding et al. 2005), thus, advocating that both the level of attachment and dependency are attributes influencing interaction levels (e.g. Britton and Rose 2004; Kleine et al. 1995; Park et al. 2010). We consider interaction interest between consumer and brand to be an intrinsic element of likeability. Bleeke and Ernst (1993) suggest that communication is the most important element in successful inter-firm exchange and most relationships will crumble without good, frequent communication.
3.3 Personified quality
Researchers suggest that there is a personification of firm brands (e.g. Lee 2013; Park et al. 2010). As Reysen (2005) suggests, customers positively respond to individual treatment, things that interest them, and contents they like. Thus, we note that personification of firms entails a firm differentiation strategy to engage with customers individually. Scholars define personified quality as a scheme of self-presentation (e.g. Cialdini 1993; Kenrick, Neuberg, and Cialdini 2002), suggesting the conscious influence of consumers’ image perception (Reysen 2005). For example, in the context of celebrity endorsements, research suggests that using celebrities is a way for firms to induce likeability, aiming to create positive a personality of a firm’s services. Such a front figure captures customers’ attention and creates brand loyalty (McCracken 1989). The personified quality construct captures the brand’s desire to develop a likeable personality, by targeting customers appropriately and thereby, create consumer-brand relationships that are beyond those of today (Nguyen et al. 2013a).
11 The personified quality-construct comprises five items, namely: (1) friendliness, (2)
approachable, (3) attractive, and (4) knowledgeable, and (5) integrity. As identified by the source attractiveness model (McGuire 1985), a likeable personality depends on factors such as
attractiveness, friendliness, expertise, and credibility (Hovland and Weiss 1951; McCracken 1989; Reysen 2005). While many of the likeability theories often are in the context of people, researchers propose that if these likeability traits from individuals could be applied to a firm and its relationship with customers, the firm could be interpreted as striving to become more likeable (e.g. Park et al. 2010). Therefore, they would have to emphasize on friendliness, approachability, attractiveness, and use compliments and associations in order to attain likeability (Hovland and Weiss 1951; McGuire 1985; Reysen 2005). Furthermore, appropriate levels of knowledge, stirring customers’ interests, and generating agreeableness are key traits to being likeable (Chaiken and Eagly 1983).
3.4 Brand contentment
Researchers posit that consumers have ideas about what they consider as a likeable brand (Rahinel and Redden 2013). These ideas are based on reference points and are continuously developed from a number of sources including social norms, life, previous transactions, competing brands, and perceived value of the brand (Feinberg et al. 2002). For example, by keeping customers happy, a firm may be able to increase prices without being disliked by broadening their ‘likeability range’ and ‘likeable zone’ (Nguyen et al. 2013a). This can be done with charitable donations or other activities that builds their goodwill. Over time, these firms may increase their overall brand likeability. Drawing from the Sustainable Happiness Model
12 (Sheldon et al. 2009), we posit that the brand contentment dimension identifies the likeability range, and may be defined as the cognitive and emotional state of happiness, resulting from the evaluation of the brand. Researchers find that under certain conditions emotions are integral parts of brand likeability. Nguyen et al. (2013a) find that likeability occurs in stages, where some are more perceptual whereas others have elements of affect and emotion. Such complexity is
underpinned by the level of familiarity, commitment, and appeal that a consumer has for a brand (e.g. Aaker 1997). We support the conceptualization of a more holistic brand likeability concept, which is novel to the branding literatures.
The brand contentment-construct comprises four items, namely: (1) approval, (2) cheerfulness, (3) peace-of-mind, and (4) gratification. We posit that both approval and cheerfulness assess the emotional aspect of likeability. Peace-of-mind with the brand is considered a key attribute to inducing contentment. It is often implicitly assumed that when a consumer has peace-of-mind, it is probable that the customer likes what he or she has purchased and/or experienced (Fornell et al.
2010). Finally, when a consumer has feelings of gratification, it is suggested that his or her needs are fulfilled, which in turn, lead to contentment and subsequent, likeability.
< INSERT TABLE 1 ABOUT HERE >
4. METHOD
Our study employed the systematic scale development procedures suggested by Churchill (1979), DeVellis (2003), Lages et al. (2005), Netemeyer et al. (2003), and Parasuraman et al.
13 (2005). This process of scale development follows conventional guidelines for scale
development, consisting of systematic phases: articulate the meaning and domain, scale
generation, initial purification, refinement, and validation of the brand likeability scale. The scale resulted from in-depth interviews, literature review of likeability, and survey tests. In order to achieve a reliable and valid measure, scholars propose that the constructs of interest must have theoretical and observable meanings that satisfy psychometric analysis for unidimensionality, reliability, convergent validity, and discriminant validity (Churchill 1979; DeVellis 2003; Netemeyer et al. 2003; Nunnally 1978; Steenkamp and Trijp 1991).
To represent the wide range of possible criteria and ways to assess likeability from the literature, we propose a theoretical framework that is based on the means-end-chain approach to understand consumers’ cognitive structures (Parasuraman et al. 2005). This approach suggests that consumers retain information in memory at multiple levels of abstraction (Olson and Reynolds 1983; Young and Feigen 1975), and follows the established approach to explore and validate quality measures (Klaus and Maklan 2012b). Using the means-end framework allows a theoretical foundation for the exploration of brand likeability attributes and dimensions. The proposed means-end-chain approach is illustrated in Figure 2.
< INSERT FIGURE 2 ABOUT HERE >
As illustrated in Figure 2, we suggest that brand likeability’s antecedents are specific concrete cues, such as price, promotion, service, and experience that trigger perceptual attributes of brand likeability. These perceptual attributes, in turn, are the evaluation of brand likeability and join
14 together into evaluations along more abstract dimensions (Parasuraman et al. 2005). In
combination, these attribute- and dimension-level evaluations lead to a higher-order abstraction (Zeithaml et al. 2002). This more global and higher level of abstraction is the overall assessment of brand likeability, which influences behavioral intentions and actual behavior (Parasuraman et al. 2005). Scholars suggest that the specification of perceptual-level attributes as the domain of scale items is appropriate for several reasons: (1) compared to concrete cues, perceptual
attributes are more enduring evaluative aspects (Scholderer and Grunert 2004); (2) since concrete cues are generally of technical nature, customers may not be aware of them or have the
knowledge to assess how good they are. Perceptual attributes are more experiential and thus, more readily assessable by all customers (Aurifeille and Valette-Florence 1995). Researchers note that perceptual attributes are more ‘scalable’ than concrete cues, suggesting that they can be rate along a continuum, whereas concrete cues in contrast, are either present or absent
(Parasuraman et al. 2005); (3) perceptual attributes ratings are more specific than dimension-level assessments, thus capable of offering better insight of brand likeability areas that affect the outcomes most (Cohen and Warlop 2001); (4) as implied in theoretical framework, the links between the brand likeability evaluative process (perceptual/dimensional level) and its
consequences (higher-order abstractions) constitute the nomological net (Cronbach and Meehl 1955) for verifying the construct validity of the scale that consists of perceptual-attribute level items (Parasuraman et al. 2005) using empirical evidence. Thus, using the means-end-chain approach as the theoretical framework, we form a solid underpinning to link attributes of brand likeability and its consequences (Grunert, Beckmann, and Sørensen 2001).
15 A critical initial step in the scale development of brand likeability scale is the correct
specification of the domain from which items are drawn from in constructing the scale (Churchill 1979). Based on the review, we specify the domain construct to include four brand likeability categories. Specifically, we refer to brand likeability as “the extent to which a brand has appeal over four dimensions labeled positivity associations, interaction interest, personified quality, and brand contentment.”
In the initial stage of our research, we explore the perceptual attributes of brand likeability. This is to ensure that the scale measures cover the entire meanings of the construct for the study. We conduct 40 in-depth interviews using the soft-laddering technique (Grunert and Grunert 1995), which is a technique where the interviewer strives to assess internal attitudes, cognitive structures, feelings, and underlying purchasing motivations (e.g. Reynolds et al. 1995; Klaus and Maklan 2012a). Based on the qualitative study, we designed a set of items to measure each of the dimensions. We modified some original items and consequently, the names of the four
dimensions for purposes of clarity.
In conducting this step, the views and opinions from the respondents offered great insights into the phenomenon of brand likeability. This helped in generating and revising the appropriate measurement scale items. Based on the in-depth interviews, we refine the brand likeability items and adjust several measures to the present context. To assess for content and face validity of the generated items, we asked a panel of marketing experts and academics to comment on the readability of the items. Content validity refers to the degree a measure’s items represent a proper sample of the theoretical content domain of a construct. Face validity refers to the extent
16 to which a measure reflects what is it intended to measure (Nunnally and Berstein 1994; Hair et al. 2006).The panel of experts was also asked about the similarity of the items. Importance was given to aspects such as the breadth of theoretical content covered by the item, consistency of contents, and clarity of meaning, and comprehensiveness (Lages et al. 2005; Matsuno et al. 2000). This procedure generated 17 final items. Appendix A shows the full item measures. Table 1 presents the listing and their scale reliability scores. The average internal reliability is .84.
4.1 Data collection procedure
In the next stage of the scale-development process, we administered our questionnaire. We use respondents who are frequent users of a range of service experience vendors such as auto repair, supermarkets, and service providers, as these represent a ‘credence’ and ‘experience’ service (Iacobucci 1992). It was important that the vendors varied in perceived quality and product variety (apparel, books, CDs, computer hardware, drugs, electronics, flowers, groceries, and toys)(Parasuraman et al. 2005). We identified the respondents as appropriate, as they are “a sample who could offer some ideas and insights into the phenomenon of study” (Churchill 1979). We contacted and screened the respondents to determine if they had sufficient shopping
experience with the mentioned services. This was specified as having used a retail vendor at least 6 times during the past 3 months and made at least 3 purchases within that period. We note that the 3 purchases do not necessarily entail the same retailer or the same services or products. Rather, we sought to ensure that our sample had appropriate exposure to the retail services setting. In addition, as we focused on the post-purchase condition of brand likeability, their frequent use, aided in our conceptualization, and subsequent, scale validation. Respondents were
17 directed to a website containing the self-administered questionnaire and instructions given. To encourage participation, the respondents had the option to enter their details to participate in a prize draw with a £50 cash prize. This process generated 458 completed questionnaires, which were subsequently analyzed using SPSS 16 and AMOS. Appendix B presents the profile of the sample in detail.
5. DATA ANALYSIS
Gerbing and Anderson (1988) advocate the use of confirmatory factor analysis (CFA) to assess reliability and validity. Their work builds on Churchill’s (1979) approach to scale development. For our study, we use confirmatory factor analysis to validate the measurement scale items and to examine scale properties such as unidimensionality, reliability, and construct validity (convergent and discriminant validity). Using maximum likelihood estimation
procedures, tests are performed using LISREL (Joreskog and Sorbom 1996) and AMOS (Hair et al. 2006).
5.1 Confirmatory factor analysis
We restrict each item to load on a pre-specified factor (with the four first-order factors allowed to correlate freely) as advocated by Lages et al. (2005). We assess the fit of the measurement and structural models using multiple indices, as advocated by Hoyle and Panter (1995), Klaus and Maklan (2012a), and Lages et al. (2005). These include type 2 incremental fit index (IFI), type 3 comparative fit index (CFI), the root mean square error of approximation
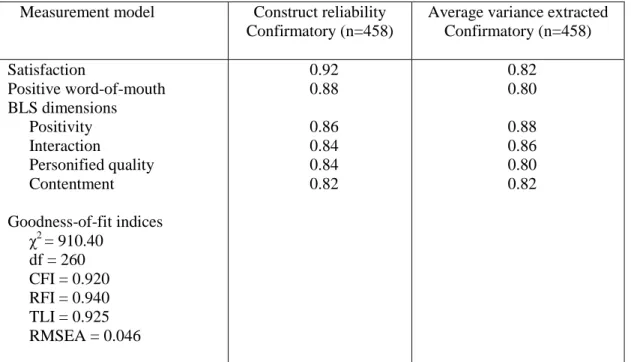
18 (RMSEA), and the Tucker-Lewis Index (TLI). Table 2 shows the fit statistics, indicating that the brand likeability scale is robust. The recommended thresholds are met for all measurement models: The chi-square is statistically significant (χ2 = 145.95, dʃ = 66, p = .05). IFI, CFI, and TLI are >0.90; RMSEA of 0.05 demonstrating excellent model fit (Hair et al. 2006).
< INSERT TABLE 2 ABOUT HERE >
< INSERT FIGURE 3 ABOUT HERE >
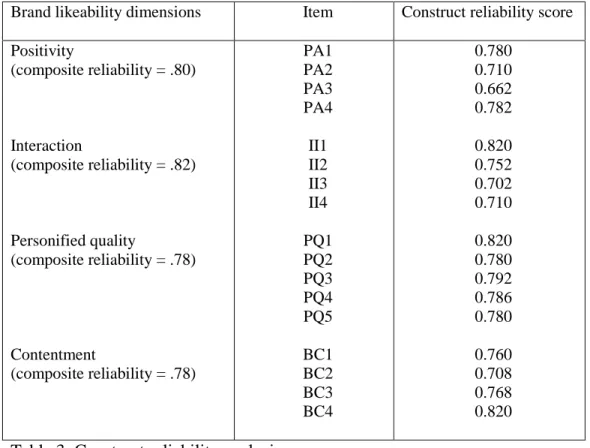
Table 2 and Table 3 show the psychometric properties using CFA. All items load on their respective factors, indicating high construct reliability. Specifically, all 4 dimensions have Cronbach alpha (α) values >60, composite reliability (ρс) values >60, and average variance extracted (ρave) values >50. Additionally, the results from the convergent reliability tests of the scale measures (Table 3) show that all 4 dimensions have factor loadings >0.70, all t-values are well above >1.96 and overall, show that the RMSEA and CFI are satisfactory, indicating an acceptable model fit (Fornell and Larcker 1981). The results from the discriminant validity tests (chi-square tests) also show that the dimensions are acceptable (Anderson and Gerbing 1988).
Unidimensionality is evidenced as each of them only load on one corresponding dimension (average loading size was .75). We subject the purified scales to validity tests including convergent validity and discriminant validity. For the convergent validity test, we examine the coefficients and their statistical significance. All coefficients are found to be above the
19 recommended values and statistically significant (Bagozzi 1980). We also show that Fornell and Larcker’s (1981) index of Average Variance Extracted (AVEs) was > .50 for all four constructs.
We reveal evidence of discriminant validity based on two results: (1) all construct inter-correlations are significantly different from 1, and (2) shared variance among any two constructs is less than the average variance explained in the items by the construct (Fornell and Larcker 1981; Lages et al. 2005; MacKenzie et al. 1999). We tested discriminant validity by carrying out a chi-square difference test (Klaus and Maklan 2012a). We compared chi-square values for every pair of estimated constructs, i.e. the values obtained from an unconstrained and a constrained model in which the correlation between the constructs was set to be zero (Peng 2006). Discriminant validity is revealed by non-significant correlations among the four first-order constructs and the new construct (Lages et al. 2005). We conclude that all constructs were found to have adequate discriminant validity (p-values <0.01).
5.2 Nomological validity
Once we established psychometric properties, we assess nomological validity by testing our measures with other theoretically related constructs (Churchill 1995). The purpose of
nomological validity is to ensure that the brand likeability measure works and correlates in the theoretically predicted way with measures of different, but related constructs (Hair et al. 2006). We model brand likeability as a formative construct with the dimensions driving brand
likeability perceptions reflectively (Jarvis et al. 2003; Parasuraman et al. 2005). Inspired by previous scale development studies (Klaus and Maklan 2012a), we utilized satisfaction and positive word-of-mouth for testing nomological validity. We thus expect a positive relationship
20 between brand likeability and satisfaction (Argyriou and Melewar 2011) and positive word of mouth (Nguyen et al. 2013a). The rationale for choosing these two constructs is mainly due to their popular use in the marketing literatures (Fornell et al. 2010), but also, given their theoretical relationship with brand likeability (Nguyen et al. 2013b). As shown in Table, 4, we demonstrate nomological validity as the brand likeability measures’ scores were positively and significantly correlated with satisfaction and positive word of mouth.
Overall, the CFA analysis and model fit statistics exhibit good fits (Table 2). All of the dimensions are shown to be reliable and valid as there are no offending estimates and all parameters are acceptable (Table 3). Thus, the CFA results specify scale items as reflective indicators of latent constructs, allowing them to inter-correlate. Table 4 shows the correlation coefficients between the four brand likeability dimensions and satisfaction and positive word-of-mouth. Given that all the coefficients are positive and significant at P<.05, we conclude that brand likeability has a positive impact on satisfaction and positive word of mouth. Hence, the nomological validity of the four measures is supported (Cadogan et al. 1999; Lages et al. 2005).
< INSERT FIGURE 4 ABOUT HERE >
6. DISCUSSION
We find that customers evaluate brand likeability at varying levels, namely, overall level, dimensional level, and attribute level. Perceptions on each level drive the next level (Klaus and Maklan 2012b). This finding improves our understanding of how customers evaluate services’
21 likeability as a more holistic concept. Based on our nomological validity test, our findings further existing understanding of how customers evaluate firms’ brand likeability linking their
evaluation to positive outcomes including satisfaction and positive word of mouth (Landwehr et al. 2011). By using the brand likeability scale to assess consumer-brand relationships, managers may define strategies that address likeability, increasing customers’ satisfaction (Nguyen et al. 2011b; Reysen 2005).
The hierarchical structure of brand likeability presents theoretical implications to the branding literatures. Our brand likeability conceptualization is a cognitive evaluation process of
psychological processes, thus, goes deeper in human cognition than surface judgments of service and product quality judgments (Schoderer and Grunert 2004). While we may not have captured all dimensions of brand likeability, we have extracted the underlying commonality among the dimensions using the means end chain approach (Parasuraman et al. 2005). Thus, we capture an overall assessment of the brand likeability including customers’ evaluation of the four
dimensions.
Unlike existing measures, there is not yet a scale of likeability that captures its dimensional attributes in branding. Our study fills this gap with an empirically validated multi-dimensional scale that assesses the likeability of a brand in a service experience context. Our findings support and extend previous research on a broad and holistic likeability
conceptualization (e.g. Nguyen et al. 2013a). We extend previous single dimensional likeability measures (e.g. Reysen 2005) with four dimensions. The four brand likeability dimensions support both credibility and attractiveness theories (Hovland and Weiss 1951; McGuire 1985)
22 and adopt several theories including attributions- and comparison theories. Our contribution is the extension of the above theories to a branding context and combining them into a multi-dimensional quality scale. We found new dimensions including positivity associations, interaction interests, personified quality, and contentment. The new dimensions incorporate relevant attributes that reflect customers’ likeability evaluations in a highly competitive service context, extending existing knowledge in branding literatures (Akdeniz, Calantone, and
Voorhees 2013; Romaniuk 2013).
For practitioners, we propose that our brand likeability concept and scale is utilized in the following ways: (1) to systematically focus on likeability as a differentiator between firms, (2) to identify consumers’ current attitudes and perceptions, and take appropriate action, (3) as a stimulator to increased interaction, (4) as an identification tool, built around the four dimensions, and increasing effort into specific areas, which may be lacking of likeability, (5) as a
segmentation tool to categorize consumers’ level of likeability and target those that may have perceptions of dislikeability, and (6) to increase the ‘likeability zone’, by linking likeability to brand personality, identity, and reputation. The latter can be achieved with a strategic focus on likeability and with continuous monitoring of consumers’ likeability perceptions.
7. CONCLUSION, LIMITATIONS, AND FUTURE RESEARCH
DIRECTIONS
Our research creates the brand likeability scale to assess firm-level brands’ likeability. We hope that our scale is used as an alternative to traditional measures including satisfaction and
23 reputation indices, as it captures perceptions that prelude these existing measures (Nguyen et al. 2013b). We advance existing research in branding and contribute to further advancement of consumer-brand relationships (Schmitt 2013). In this interactive age, a measure of brand likeability may be an important differentiator and contributor to successful firm-level brand personalities.
We acknowledge some research limitations. First, we recognize that our proposition of the brand likeability scale to be used as an early indicator and pre-purchase measure, needs further testing. We note that due to the nature of scale development (Bearden et al. 2011), we focused exclusively on post-purchase brand likeability, and used a sample with actual experiences of services for our development. Second, the study was conducted in a single setting i.e. services. It would be problematic to generalize the results to other settings (Hair et al. 2006). Third, the research design is cross-sectional, representing static relationships between the variables. Netemeyer et al. (2003) notes that in a cross-sectional study, the causality of the linkages between the constructs cannot be fully proven, so caution is required when inferring the cause and effect among the variables. Longitudinal studies will be more desirable, as they will allow better insight into consumers’ changing attitudes over a period of time. Another limitation is associated with the relatively small sample size. Consequently, our results may be regarded as suggestive rather than conclusive (Lages et al. 2005). Finally, we acknowledge that some researchers argue that higher-order reflective constructs and formative constructs cannot represent 'real' constructs in any ontology that makes coherent sense (Cadogan and Lee 2013) - despite their common use and discussion in methodological and applied literature (for a deeper
24 We encourage the adoption of our brand likeability scale for tests in other settings, including multiple industries and contexts. Using different samples and contexts (high vs. low involvement products) may prove the stability of the scale and enhance the generalizability of the model. We further encourage researchers to add new items and continue to refine the brand likeability scale. We also propose a new study that compares the performance of our brand likeability scale with other existing brand scales and scales developed commercially such as Millward Brown and Y&R in order to test the robustness and reliability. In addition, we further note that while satisfaction and likeability are conceptually different constructs, we initially found aspects of satisfaction in our multidimensional scale. However, this was expected. To avoid any confusion between the two concepts, we omitted satisfaction from our scale. We thus call for more research to compare and contrast these two concepts. Future research may develop an opposite consumer-level brand likeability scale to assess, from the firms’ point of view, how likeable certain
customers’ behaviors are. This approach will be useful in various segmentation schemes. Lastly, more research is warranted in understanding the consequences of likeability. A comprehensive framework may be developed linking past behaviors and other marketing outcomes such as brand identity, image, loyalty, trust, and purchase intentions.
25
REFERENCES
Aaker, J. L. (1997). Dimensions of brand personality. Journal of Marketing Research,34(6), 347-356.
Ahuvia, A. C. (2005). Beyond the extended self: loved objects and consumers’ identity narratives.
Journal of Consumer Research, 22(1), 171-184.
Ajzen, I. and Fishbein, M. (1980). Understanding attitudes and predicting social behavior. Upper Saddle River, New Jersey: Prentice-Hall.
Akdeniz, B., Calantone, R. J., & Voorhees, C. M. (2013). Effectiveness of marketing cues on consumer perceptions of quality: the moderating roles of brand reputation and third-party information. Psychology & Marketing, 30(1), 76-89.
Albert, N., Merunka, D., & Valette-Florence, P. (2008). When consumers love their brands: exploring the concept and its dimensions. Journal of Business Research, 61(10), 1062-1075.
Alwitt, L. F. (1987). Components of the likeability of advertising. Presentation to the Stellner Symposium on Uses of Cognitive Psychology in Advertising and Marketing, University of Illinois, May 1987.
Ambler, T., & Styles, C. (1996). Brand development versus new product development: towards a process model of extension decisions. Marketing Intelligence & Planning, 14(7), 10-19. Anderson, J. & Gerbing, D. (1988). Structural equation modeling in practice: a review and
recommended two-step approach. Psychological Bulletin, 103(3), 411-23.
Argyriou, E. & Melewar, T.C. (2011). Consumer attitudes revisited: a review of attitude theory in marketing research. International Journal of Management Reviews, 13, 431-451.
Aurifeille, J.-M. & Valette-Florence, P. (1995). Determination of the dominant means-end chain: a constrained clustering approach. International Journal of Research in Marketing, 12, 267-278.
Bagozzi, R. P. (1980). Causal models in marketing. New York: John Wiley, 1980.
Batra, R., Ahuvia, A., & Bagozzi, R.P. (2012). Brand love. Journal of Marketing,76(2), 1-16. Bearden, W. O., Netemeyer, R. E., and Haws, K.(2011).Handbook of Marketing Scales: Multi‐
Item Measures for Marketing and Consumer Behavior Research, 3nd Edition, Sage
Publications and the Association for ConsumerResearch.
Bleeke, J., & Ernst, D. (1993). Collaborating to compete. New York: Wiley, 1993.
Boulding, W., Staelin, R., Ehret, M., & Johnston, W. J. (2005). A customer relationship management roadmap: what is known, potential pitfalls, and where to go. Journal of Marketing, 69 (4), 155-166.
Britton, J. E., & Rose, J. (2004). Thinking about relationship theory. In Rogers, Peppers D. and Rogers, M. Managing Customer Relationships – A Strategic Framework, John Wiley and Sons, New Jersey, 38–50.
Brunk, K. (2012). Un/ethical Company and Brand Perceptions: Conceptualising and Operationalising Consumer Meanings. Journal Of Business Ethics, 111(4), 551-565. Cadogan, J. W., Diamantopoulos, A., & de Mortanges, C. P. (1993). A measure of export market
orientation: scale development and cross-cultural validation. Journal International
Business Studies, 30(4), 689 –707.
Cadogan, J. W., & Lee, N. (2013). Improper use of endogenous formative variables. Journal of
Business Research, 66, 233–241.
Campbell, M. C. (1999). Perceptions of price unfairness: antecedents and consequences. Journal
26 Chaiken, S. & Eagly, A. H. (1983). Communication modality as a determinant of persuasion: the
role of communicator salience. Journal of Personality and Social Psychology, 45(2), 241-256.
Churchill, G. A. Jr. (1995). Marketing research. Methodological foundations. The Drydeu Press, G. Edition, New York, USA.
Churchill, G. (1979). A paradigm for developing better measures of marketing constructs.
Journal of Marketing Research, 16(1), 64-73.
Cialdini, R. B. (1993). Influence: science and practice, 3rd ed. New York: Harper Collins. Cohen, J. B., & Warlop, L. (2001). A motivational perspective on means-end chains. In T. J.
Reynolds & J. C. Olson (Eds.), Understanding consumer decision making: The
means-end approach to marketing and advertising strategy. Mahwah, NJ: Lawrence Erlbaum.
Cronbach, L. J. (1951). Coefficient alpha and the internal structure of tests. Psychometrika, 16, 297– 334.
Cronbach, L. J. & Meehl, P. E. (1955). The validity of psychological tests. Psychological Bulletin, 52 (4), 281-302.
DeVellis, R. F. (2003). Scale development: theory and applications. 2nd Ed., Sage, London: UK. Dibb, S. & Simkin, L. (2009). Implementation rules to bridge the theory/practice in marketing
segmentation. Journal of Marketing Management, 25 (3/4), 375-396.
Duncan, T., & Moriarty, S. E. (1998). A communication-based marketing model for managing relationships. Journal of Marketing, 62(2), 1–13.
Ekinci, Y., Dawes, P. L., & Massey, G. R. (2008). An extended model of the antecedents and consequences of consumer satisfaction for hospitality services. European Journal of Marketing, 42(1/2), 35-68.
Feinberg, F. M., Krishna, A., & Zhang, Z. J. (2002). Do we care what others get? A behaviorist approach to targeted promotions. Journal of Marketing Research,39(3), 277-291. Folkes, V. S. (1988). Recent attribution research in consumer behavior: a review and new
directions. Journal of Consumer Research, 14 (March), 548-65.
Fornell, C. D., & Larcker, F. (1981). Evaluating structural equation models with unobservable variables and measurement errors. Journal of Marketing Research, 18(Feb), 39– 50. Fornell, C., Rust, R., & Dekimpe, M. (2010). The effect of customer satisfaction on consumer
spending growth. Journal of Marketing Research, 47(1), 28-35.
Frow, P. E., Payne, A., Wilkinson, I. F., & Young, L. (2011). Customer management and CRM: addressing the dark side. Journal of Services Marketing, 25(2), 79–89.
Garretson, J. A., Fisher, D. & Burton, S. (2002). Antecedents of private label attitude and national brand attitude: similarities and differences. Journal of Retailing, 78, 91-99.
Gerbing, D. W. & Anderson, J. C. (1988). An updated paradigm for scale development incorporating unidimensionality and its assessment. Journal Marketing Research, 25 (May), 186– 92.
Grunert, K. G., Beckmann, S. C. & Sørensen, E. (2001). Means-end chains and laddering: an inventory of problems and an agenda for research. In T. Reynolds & J. C. Olson (Eds.), Understanding consumer decision-making: The means-end approach to marketing and
advertising strategy (63-90). Mahwah, NJ: Erlbaum.
Grunert, K. & Grunert, S. (1995). Measuring subjective meaning structures by the laddering method: theoretical considerations and methodological problems. International Journal
of Research in Marketing, 12(3), 209-25.
Hair, J. F., Black, W. C., Babin, B. J., Anderson, R. E., & Tatham, R. L. (2006). Multivariate
data analysis. Englewood Cliffs, NJ: Prentice Hall.
Heider, F. (1958). The Psychology of Interpersonal Relations. New York: Wiley.
Hovland, C. I. & Weiss, W. (1951). The influence of source credibility on communication effectiveness. Public Opinion Quarterly. 15(4), 635-50.
27 Hoyle, R. & Panter, A. (1995). Writing about structural equation models. In Hoyle, R. (Ed.)
Structural Equation Modelling, Sage, Thousand Oaks, CA, 158-76.
Iacobucci, D. (1992). An empirical examination of some basic tenets in services: goods-services continua? Advances in Services Marketing and Management 1, 23-52.
Jarvis, C., MacKenzie, S., & Podsakoff, P. (2003). A critical review of construct indicators and measurement model misspecification in marketing and consumer research. Journal of
Consumer Research, 30(2), 199-218.
Johnson, M. D. & Fornell, C. (1991). A framework for comparing customer satisfaction across individuals and product categories. Journal of Economic Psychology,12(2), 267–286. Joreskog, K. G, & Sorbom, D. (1993). LISREL 8: structural equation modeling with the SIMPLIS
command language. Hillsdale (NJ): Lawrence Erlbaum Associates.
Kano, N. (1984). Attractive quality and must-be quality. (in Japanese). Journal of the Japanese
Society for Quality Control, 14(2), 39-48.
Kaplan, A. & Haenlein, M. (2010). Users of the world unite. The challenges and opportunities of social media. Business Horizons, 53(1), 59-68.
Kenrick, D. T., Neuberg, S. L., & Cialdini, R. B. (2002). Social psychology: unraveling the mystery. 2nd ed. Boston: Allyn & Bacon.
Klaus, P. & Maklan, S. (2012a). EXQ: a multiple-scale for assessing service experience. Journal
of Service Management 23 (1), 5-33.
Klaus, P. & Maklan, S. (2012b). Towards a better measure of customer experience. International
Journal of Market Research, 55(2), 227-246.
Klaus, P. & Nguyen, B. (2013). Exploring the role of the online customer experience in the firm's multichannel strategy - an empirical analysis of the retail banking sector. Journal of
Strategic Marketing, 21(5), 429-442.
Kleine, S. S., Kleine III, R. E., & Allen, C. T. (1995). How is a possession me or not me? Characterizing types and an antecedent of material possession attachment. Journal of
Consumer Research, 22(3), 327-43.
Lages, C., Lages, C.R., & Lages, L.F. (2004). The RELQUAL scale: a measure of relationship quality in export market ventures. Journal of Business Research, 58, 1040-1048.
Lam, S., Ahearne, M., Mullins, R., Hayati, B., & Schillewaert, N. (2013). Exploring the dynamics of antecedents to consumer-brand identification with a new brand. Journal of The
Academy of Marketing Science, 41(2), 234-252.
Landwehr, J., McGill, A., & Herrmann, A. (2011). It's got the look: the effect of friendly and aggressive 'facial' expressions on product liking and sales. Journal of Marketing, 75(3), 132-146.
Lee, E. (2013). A prototype of multicomponent brand personality structure: a consumption synmbolism approach. Psychology & Marketing, 30(2), 173-186.
Lee, N. & Cadogan, J. W. (2013). Problems with formative and higher-order reflective variables.
Journal of Business Research, 66, 242-247.
Lee-Wingate, S. N. & Stern, B. B. (2007). Perceived fairness: conceptual framework and scale development. Advances in Consumer Behavior,34, 400-402.
Lin, C. Y, Marshall, D., & Dawson, J. (2009). Consumer attitudes towards a European retailerʼs private brand food products: an integrated model of Taiwanese consumers. Journal of
Marketing Management, 25(9), 875-891.
Lind, E. A. & Tyler, T. R. (1988). The social psychology of procedural justice. N.Y.: Plenum. MacKenzie, S. B., Podsakoff, P. M., & Rich, G. A. (1999). Transformational and transactional
leadership and salesperson performance. Journal of the Academy of Marketing Science, 29(2), 115–34.
Mamic, L. I. and Almaraz, I. A. (2013). How the larger corporations engage with stakeholders thought Twitter. International Journal of Market Research, 55(6), 851-872.
28 Matsuno, K., Mentzer, J. T., & Rentz, J. O. (2000). A refinement and validation of the MARKOR
scale. Journal of the Academy of Marketing Science,28(4),527– 39.
McCracken, G. (1989). Who is the celebrity endorser? Cultural foundation of the endorsement process. Journal of Consumer Research, 16(December), 310-321.
McGuire, W. J. (1985). Attitudes and attitude change. In Lindzey, G. and Aronson, E. Handbook of Social Psychology, Random House, New York, NY, 233-346.
Menon, A., Bharadwaj, S. G., & Howell, R. D. (1999). The quality and effectiveness of marketing strategy: effect of functional and dysfunctional conflict in intraorganizational relationships. Journal of the Academy of Marketing Science, 24(Fall), 299– 313.
Narvaez, D. (2006). Guide for using the Positivity Scale. Center For Ethical Education, University of Notre Dame, Notre Dame: France.
Netemeyer, R. G., Bearden, W. O., & Sharma, S. (2003). Scaling procedures: issues and
applications, Sage, London: UK.
Nguyen, B., Melewar, T. C., & Chen, J. (2013a). A framework of brand likeability: exploring likeability in firm-level brands. Journal of Strategic Marketing, 21(4), 368-390.
Nguyen, B., Melewar, T. C., & Chen, J. (2013b). Brand likeability: can firms make themselves more likeable?. Journal of General Management, 38(3), 25-50.
Nunnally, J. C. (1978). Psychometric theory. 2nd ed. New York: McGraw-Hill.
Nunnally, J. C. & Berstein, I. H. (1994). Psychometric theory. 3rd ed. New York: McGraw-Hill. Olson, J. & Reynolds, T. (1983). Understanding consumers’ cognitive structures: implications for
advertising strategy. In Percy, L. and Woodside, A. (Eds), Advertising and Consumer
Psychology, Lexington Books, Lexington, MA.
Parasuraman, A., Zeithaml, V., & Malhotra, A. (2005). E-S-QUAL: a multiple-item scale for assessing electronic service quality. Journal of Service Research, 7(3), 213-34.
Park, C. W., MacInnis, D. J., Priester, J., Eisengerich, A. B., & Iacabucci, D. (2010). Brand attachment and brand attitude strength: conceptual and empirical differentiation of two critical brand equity drivers. Journal of Marketing, 74(6), 1-17.
Peppers, D. & Rogers, M. (2010). Managing customer relationships – a strategic framework. John Wiley and Sons, New Jersey.
Peppers, D., Rogers, M., & Dorf, B. (1999). Is your company ready for one-to-one marketing?
Harvard Business Review, 77(January-February), 151-60.
Rahinel, R., & Redden, J. P. (2013). Brands as product coordinators: matching brands make joint consumption experiences more enjoyable. Journal of Consumer Research, 39(6), 1290-1299.
Reinhard, M. A. & Messner, M. (2009). The effects of source likeability and need for cognition on advertising effectives under explicit persuasion. Journal of Consumer Behavior, 8(July/August), 179-191.
Reynolds, T., Gengler, C., & Howard, D. (1995). The means-end analysis of brand persuasion through advertising. International Journal of Research in Marketing, 12(3), 257-66. Reysen, S. (2005). Construction of a new scale: the reysen likeability scale. Social Behavior and
Personality, 33,201-208.
Rigdon, E. E., Preacher, K. J., Lee, N., Howell, R. D., Franke, G. R., & Borsboom, D., (2011). Avoiding measurement dogma: a response to Rossiter. European Journal of Marketing, 46 (11/12), 1589-1600.
Romaniuk, J. (2013). How healthy is your brand-health tracker? A five-point checklist to build returns on a critical research investment. Journal of Advertising Research, 53(1), 11-13. Santos-Vijande, M., del Río-Lanza, A., Suárez-Álvarez, L., & Díaz-Martín, A. (2013). The brand
management system and service firm competitiveness. Journal of Business Research, 66(2), 148-157.
Schmitt, B. (2013). The consumer psychology of customer–brand relationships: extending the AA relationship model. Journal of Consumer Psychology, 23(2), 249-252.
29 Scholderer, J. & Grunert, K. G. (2004). The validity of the means-end chain model of consumer
behavior. Report, MAPP project paper no. 05/04, Aarhus School of Business.
Sheldon, K.M., Boehm, J.K., & Lyubomirsky, S. (2009). Variety is the spice of happiness: the hedonic adaptation prevention (HAP) model. Oxford handbook of happiness. Oxford: Oxford University Press.
Simonson, I. (2005). Determinants of customers’ responses to customized offers: conceptual framework and research propositions. Journal of Marketing, 69, 32 – 45.
Stapel, J. (1994). Observations – a brief observation about likeability and interestingness of advertising. Journal of Advertising Research, 34(2), 79-80.
Steenkamp, J. & Trijp, H. V. (1991). The use of LISREL in validating marketing constructs.
International Journal of Research in Marketing, 8(4), 283-299.
Thibaut, J. & Walker, L. (1975). Procedural justice: a psychological analysis. Lawrence Erlbaum Associates, Hillsdale, NJ
Troye, S. & Supphellen, M. (2012). Consumer participation in coproduction: 'I made it myself' effects on consumers' sensory perceptions and evaluations of outcome and input product.
Journal of Marketing,76(2), 33-46.
Tuncay, Z. L. (2012). Consumer-brand relationships theory and practice. International Journal of
Advertising, 31(4), 921-923.
Tuškej, U., Golob, U., & Podnar, K. (2013). The role of consumer-brand identification in building brand relationships. Journal of Business Research, in press.
Young, S. & Feigen, B. (1975). Using the benefit chain for improved strategy formulation.
Journal of Marketing, 39(4), 72-74.
Weiner, B. (1985). Spontaneous causal thinking. Psychological Bulletin, 97(Jan), 74-84.
Woo Jin, C., & Winterich, K. (2013). Can brands move in from the outside? How moral identity enhances out-group brand attitudes. Journal of Marketing, 77(2), 96-111.
Zeithaml, V., Parasuraman, A., & Malhotra, A. (2002). Service quality delivery through web sites, a critical review of extant knowledge. Journal of the Academy of Marketing Science, 30(4), 362–75.
30 TABLES
Brand Likeability Dimensions
Positivity associations Interaction interest Personified quality Brand contentment
PA1: Optimism
PA2: Positive association PA3: Advantageous PA4: Auspiciousness
II1: Dependency II2: Attachment II3: Information sharing II4: Communication quality PQ1: Friendliness PQ2: Approachable PQ3: Attractive PQ4: Knowledgeable PQ5: Integrity BC1: Approval BC2: Cheerfulness BC3: Peace-of-mind BC4: Gratification
Table 1: Dimensions of the Brand Likeability Scale
Measurement model Construct reliability Confirmatory (n=458)
Average variance extracted Confirmatory (n=458) Satisfaction Positive word-of-mouth BLS dimensions Positivity Interaction Personified quality Contentment Goodness-of-fit indices χ2 = 910.40 df = 260 CFI = 0.920 RFI = 0.940 TLI = 0.925 RMSEA = 0.046 0.92 0.88 0.86 0.84 0.84 0.82 0.82 0.80 0.88 0.86 0.80 0.82
Table 2: Measurement, reliability and validity
31 Brand likeability dimensions Item Construct reliability score
Positivity (composite reliability = .80) Interaction (composite reliability = .82) Personified quality (composite reliability = .78) Contentment (composite reliability = .78) PA1 PA2 PA3 PA4 II1 II2 II3 II4 PQ1 PQ2 PQ3 PQ4 PQ5 BC1 BC2 BC3 BC4 0.780 0.710 0.662 0.782 0.820 0.752 0.702 0.710 0.820 0.780 0.792 0.786 0.780 0.760 0.708 0.768 0.820
Table 3: Construct reliability analysis
Note: Internal reliability (Cronbach 1951); composite reliability (Bagozzi 1980)
Satisfaction Positive word of mouth Positivity Interaction Personified quality Contentment 0.84** 0.74** 0.76* 0.90** 0.92** 0.74* 0.70* 0.82**
Table 4: Brand likeability dimensions and outcomes Note: * P< .05 (two-tailed test); **P< .01 (two-tailed test)
32 FIGURES
Figure 1: The Brand likeability Scale
Figure 2: A means-end framework of the brand likeability scale (Parasuraman et al. 2005; Scholderer and Grunert 2004)
Positivity Interaction Personified Quality Contentment Brand Likeability PA1: Optimism
PA2: Positive association PA3: Advantageous feeling PA4: Auspiciousness
II1: Dependency II2: Attachment II3: Information sharing II4: Communication quality
PQ1: Friendliness PQ2: Approachable PQ3: Attractive PQ4: Knowledgeable PQ5: Integrity BC1: Approval BC2: Cheerfulness BC3: Peace-of-mind BC4: Gratification
Concrete cues Perceptual attributes Dimensions Higher-order abstractions Technical/design aspects that influence brand likeability Levels of brand likeability evaluation Consequences of brand likeability – overall brand likeability driving behavioral intentions and actual
33 APPENDIX A – MEASURES OF CONSTRUCT
Brand Likeability Scale
Each scale item use a 7-point scale (1 = Strongly Disagree, 7 = Strongly Agree) or as Do not know/Not applicable. The items below are grouped by dimensions for expositional convenience; they appeared in random order in the survey. The codes preceding the items correspond to the variables named in Table 1.
Dimensions Item measures posass
PA1 PA2 PA3 PA4
Process leading to positive associations
I strongly believe that the brand can keep its promise to me. The brand is associated with a positive motive.
I feel that I am favored and given priority by the brand. I believe that the brand continues to getting better and better. intint
II1 II2 II3 II4
Interest to interact between customers and brand I stay with this brand because I am dependent on them. I feel attached to the brand.
The brand openly shares information with me. I have continuous interaction with the brand. perqua PQ1 PQ2 PQ3 PQ4 PQ5
Quality associated with the brand’s personality I would describe the brand as friendly.
I would say that the brand is approachable. This brand is very attractive.
I would ask for advice because the brand is knowledgeable. It is important that the brand has high level of integrity. bracon
BC1 BC2 BC3 BC3
Consumers’ content with the brand Overall, I approve of this brand.
I feel cheerful when shopping at this brand. The brand takes care of everything for me. I am grateful for the brand’s offering of services.
34 APPENDIX B – SAMPLE PROFILE
Variable Percentage (n=458) Age <25 25-40 41-55 >55 Sex Male Female Level of education High school or less Some college College graduate Other
Annual household income <$25,000-$49,999 $50,000-74,999 $75,000 or more 36.46% (167) 42.58% (195) 13.32% (61) 7.64% (35) 39,96% (183) 60.04% (275) 25.76% (118) 27.07% (124) 43.02% (197) 4.15% (19) 62.66% (287) 30.79% (141) 6.55% (30)