Effects of Holding Time, Storage, and
the Preservation of Samples on
Sample Integrity for the Detection of
Fecal Indicator Bacteria by
Quantitative Polymerase Chain
Reaction
EPA/600/R-10/150 December 2010
EPA/600/R-10/150 December 2010
Effects of Holding Time, Storage, and the
Preservation of Samples on Sample Integrity
for the Detection of Fecal Indicator Bacteria by
Quantitative Polymerase Chain Reaction
(qPCR)-based Assays
Larry Wymer1, Kevin Oshima1, Jack Paar III2, Mark Doolittle3, Jennifer Lavender4, Manju Varma1 and Rich Haugland1
1
U. S. Environmental Protection Agency National Exposure Research Laboratory
Cincinnati, OH 45268
2
U. S. Environmental Protection Agency New England Regional Laboratory
North Chelmsford, MA, 01853
3
TechLaw, Inc.
Environmental Services Assistance Team (ESAT) U.S. EPA Region 1
Lowell, MA 01853
4
Student Services Contractor to the U. S. Environmental Protection Agency National Exposure Research Laboratory
Cincinnati, OH 45268
National Exposure Research Laboratory Office of Research and Development
Disclaimer
Although this work was reviewed by U.S. EPA and approved for publication, it may not
necessarily reflect official Agency policy. Mention of trade names or commercial products does not constitute endorsement or recommendation for use.
Executive Summary
The purpose of this project was to answer questions related to storage of samples to be analyzed by the quantitative polymerase chain reaction (qPCR)-based assays for fecal indicator bacteria. The report is divided into two parts. The first part describes studies that were performed to determine if filters that are used to collect fecal indicator bacteria can be stored frozen and analyzed at a later date. These studies were primarily directed at a specific, targeted question: can qPCR results from freezer archived samples be used to establish valid relationships between fecal indicator densities and health effects data collected from previous epidemiological studies. The second part describes studies that were performed to determine if refrigerated water samples can be held for 24 to 48 hours prior to analysis by qPCR. These studies addressed a question that may be relevant to the implementation of the qPCR method for water quality monitoring at remote locations where immediate analysis of the samples is not possible.
Part 1.
Archived Sample Stability Study and Long-Term Holding Time Study: Evaluation of effects of freezer-storage on the preservation of filter samples for qPCR analysis
The Beach Environmental Assessment and Coastal Health (BEACH) Act of 2000 directed the U.S. EPA to conduct studies concerning pathogen indicators in coastal recreation waters. The results of these studies are to be used by U.S. EPA to publish new or revised water quality criteria for the purpose of protecting human health in coastal recreational waters. U.S. EPA has conducted a number of studies pursuant to the BEACH Act including studies:
• To develop new rapid methods for measuring water quality
• To establish the relationship between water quality and health using the rapid methods • To develop a system for monitoring water quality
• To provide guidance to states on the application of the new methods
The U.S. EPA has conducted the National Epidemiological and Environmental Assessment Research (NEEAR) Water Study at four beaches on the Great Lakes and three on the Atlantic and Gulf Coasts. Water quality at each of the beaches was impacted by point sources that
received combined treated sewage discharges from communities with populations of at least 15,000.
The NEEAR studies contained a health data collection component as described in Wade et al. (2006, 2008, 2010). The objective of the health portion of the studies was to quantify the symptomatological observations of illnesses in the swimmer vs. non-swimmer groups. The second component of the studies was to collect exposure data based on fecal indicator bacteria (FIB) densities in the water as determined by rapid methods such as quantitative polymerase chain reaction (qPCR) for Enterococcus. Data from the two components of the studies were compared to assess the relationships between risk of swimming-related illness and exposure (Wade et al. 2006, 2008, 2010).
As part of the NEEAR study design, additional replicate aliquots of each water sample were filtered and the filters were archived by freezing at -40 °C. The ultimate objective of the archived NEEAR sample stability study was to establish if the results of several more recently developed qPCR methods (e.g., for alternative indicators such as Escherichia coli and
Bacteroidales) or method modifications might be suitable for generating meaningful health
relationship assessments. If the archived sample results did not show a change with respect to the original sample results using the original qPCR methods, this would lend credibility to using the results of the newer qPCR methods employed in the analyses of the archived samples for also assessing health relationships using the health data collected from the original NEEAR studies. To address the question of archived sample stability, the analysis results from each of the qPCR methods that were performed from 2003–2007 on the original NEEAR study samples
(Enterococcus for both fresh water and marine beach samples and Bacteroidales for marine
beach samples only) were compared with corresponding results obtained two to six years later in 2009 from the archived samples.
To further evaluate the effects of filter freezer storage on qPCR analysis results, a supplemental long-term holding time study was also conducted by the U.S. EPA, Region 1 Research
Laboratory in North Chelmsford, MA. In this study, replicate filters from 29 fresh water and 23 marine water samples from diverse non-recreational beach locations in the Boston, MA area
were held in freezer storage for varying lengths of time from 1 day up to 2 years prior to analysis. In addition to qPCR analysis for Enterococcus, this study also sought to provide data for some of the newer qPCR-based methods that were not included in the original NEEAR studies (specifically Bacteroidales in fresh water and E. coli in both fresh and marine waters). A demonstration that the filter analysis results in this study did not show a change over time, would lend further credibility to using the analysis results of the archived NEEAR study samples by these newer qPCR methods to assess health relationships.
Results from the NEEAR archived sample stability study showed, however, that substantial and statistically significant degradation of samples had occurred. The highly significant changes and low or absent correlation between archived and original sample analysis results indicate that the archived filters cannot be used in a credible manner to establish health relationships involving
Enterococcus qPCR or, by extension, any other indicator, pathogen, or method. Any health
relationships based on data derived from the archived samples is not useful because they do not reflect data that would have been obtained from the original samples in actual beach monitoring circumstances.
The results from the long-term holding time study, though of reduced importance due to the findings from the archived sample stability study, showed statistically significant decreases in qPCR estimates of Bacteroidales and E. coli after 2 years of freezer storage. These results complement the findings from the archived NEEAR study sample analyses for Enterococcus in indicating that archived sample analysis results for the two alternative indicator bacteria groups
(Bacteroidales and E. coli) cannot be used in a credible manner to establish health relationships.
It is noted that the holding temperature used in this study was -20 °C.
Part 2.
Short-Term Holding Time Study: Evaluation of holding refrigerated surface water samples for up to 48 h for qPCR analysis
The short-term holding time study was conducted to determine whether holding refrigerated surface water samples for 24 and 48 hours affects qPCR-determined density estimates of
processed within the currently accepted holding time limit of six hours. Additional subsamples of the same water samples, collected in the Boston, Massachusetts area for the U.S. EPA Region 1 long term holding study, were held with refrigeration for 24 and 48 hours prior to the collection of target organisms by filtration and qPCR analysis. A supplemental study, motivated by
ambiguous results from the main study of Boston area water samples, was also conducted using an Ohio River water sample.
Results from the short-term holding time study of Boston area water samples showed small but in some cases statistically significant changes in qPCR-estimated densities of the three different fecal indicator organism groups in subsamples of the water samples that were held for 24 and 48 hours prior to filtration compared to corresponding subsamples that were filtered within six hours. However, these changes were not consistent for the 24 and 48 hour holding times nor were they consistent between indicators. In comparisons with subsamples of the Ohio River water sample held for just one hour prior to filtration, statistically significant declines in density estimates of one of the indicator groups were observed in subsamples held for 24 hours and of all three indicator groups in subsamples held for 48 hours. Overall, the results of these studies were inconclusive and, as a result, can neither support nor refute recommendations to hold
Table of Contents
Disclaimer ... i Executive Summary ... ii Table of Contents ... vi Part 1
Archived Sample Stability Study and Long-Term Holding Time Study: Evaluation of effects of freezer-storage on the preservation of filter samples for qPCR analysis ... 1-1
Introduction ... 1-1 Material and Methods ... 1-2 Materials and methods for archived sample stability study ... 1-2 Water samples. ... 1-2 Sample collection and distribution. ... 1-3 Sample archiving. ... 1-4 Sample analyses. ... 1-4 Materials and methods for long-term holding time study ... 1-5 Water samples. ... 1-5 Sample collection and archiving. ... 1-6 Sample analyses. ... 1-7 Computational methods ... 1-7 Statistical analyses ... 1-9 Quality control/ Quality assurance ... 1-10 Laboratory ... 1-10 Cultures ... 1-10 Water samples ... 1-11 Instruments ... 1-11 Microscopes and general laboratory equipment. ... 1-11 Real-time sequence detection instruments. ... 1-11 Data ... 1-11 qPCR data. ... 1-11 Quality controls, QC acceptance criteria and responses ... 1-12 CFU enumeration. ... 1-12 qPCR analyses. ... 1-12 QC failures and responses. ... 1-12 Results ... 1-14 Archived sample stability study ... 1-14 Long-term holding time study ... 1-19 Discussion ... 1-20 Conclusions ... 1-25 References ... 1-26 Part 2
Short-Term Holding Study: Evaluation of holding refrigerated water samples for up to 48 hours for qPCR analysis... 2-1
Introduction ... 2-1 Material and Methods ... 2-2
Water samples ... 2-2 Sample treatments ... 2-2 Sample analyses ... 2-5 Computational methods ... 2-5 Statistical analyses ... 2-6 Ohio River water holding time study ... 2-7 Quality control/ Quality assurance ... 2-7 Results ... 2-7 Discussion ... 2-11 Conclusions ... 2-15 References ... 2-16
Tables
Table 1-1. Master standard curve variables for qPCR assays ... 1-8 Table 1-2. QC acceptance criteria for current U.S. EPA Enterococcus and Bacteroidales
qPCR methods ... 1-12 Table 1-3. NEEAR study archived sample characteristics ... 1-13 Table 1-4. NEEAR study mean log10(qPCR calibrator cell equivalents) based on qPCR
calibrator cell equivalents ÷ 2 for non-detects ... 1-15 Table 1-5. Maximum likelihood estimates of difference between archived and original
samples ... 1-17 Table 1-6. Long-term holding time study samples mean log10(qPCR calibrator cell equivalents) and change from initial results (24 hr) for samples held for two years ... 1-20 Table 2-1. Boston, MA area sample locations and descriptions ... 2-3 Table 2-2. Description of sample treatments ... 2-4 Table 2-3. Primers and probes for qPCR assays ... 2-6 Table 2-4. Holding time effects: qPCR recovery comparisons between refrigerated water
(RW) and the recovery standards (RS) ... 2-9 Table 2-5. Evaluation of difference in holding time effects between fresh and marine waters 2-10 Table 2-6. Ohio River holding time effects: qPCR recovery comparisons ... 2-11 Table 2-7. Holding time effects: qPCR recovery comparisons between refrigerated water
Figures
Figure 1-1. Probability plot of residuals from the MCMC model for differences in observed log10 qPCR analysis between archived and original samples ... 1-16 Figure 1-2. Scatter plots of archived sample stability study samples, Enterococcus qPCR
archived (“EPA”) vs. initial (“EMSL”) value... 1-18 Figure 1-3. Scatter plots of archived sample stability study samples, Bacteroidales qPCR
archived (“EPA”) vs. original (“EMSL”) values ... 1-19 Figure 2-1. Fresh water box and whisker plot1 of differences in log10(calibrator cell
equivalents per 100 ml): refrigerated water – recovery standards ... 2-8 Figure 2-2. Marine water box and whisker plot1 of differences in log10(calibrator cell
Part 1.
Archived Sample Stability Study and Long-Term Holding Time
Study: Evaluation of effects of freezer-storage on the preservation of
filter samples for qPCR analysis
Introduction
The Beach Environmental Assessment and Coastal Health (BEACH) Act of 2000 directed the U.S. EPA to conduct studies concerning pathogen indicators in coastal recreation waters. The results of these studies are to be used by the U.S. EPA to publish new or revised water quality criteria for the purpose of protecting human health in coastal recreational waters. The U.S. EPA has conducted a number of studies pursuant to the BEACH Act including studies:
• To develop new rapid methods for measuring water quality
• To establish the relationship between water quality and health using the rapid methods • To develop a system for monitoring water quality
• To provide guidance to states on the application of the new methods
The U.S. EPA has conducted the National Epidemiological and Environmental Assessment Research (NEEAR) Water Study at four beaches on the Great Lakes and three on the Atlantic and Gulf Coasts. Water quality at each of the beaches was impacted by point sources that received combined treated sewage discharges from communities with populations of at least 15,000.
The NEEAR studies contained a health data collection component as described in Wade et al. (2006, 2008, 2010). The objective of the health portion of the studies was to quantify the symptomatological observations in the swimmer vs. non-swimmer groups. The second
component of the studies was to collect water quality data on fecal indicator bacteria (FIB) using rapid methods such as quantitative polymerase chain reaction (qPCR) for Enterococcus and
As part of the NEEAR study design, additional replicate aliquots of each water sample were filtered and the filters were archived by freezing. The key objective of the archived NEEAR sample stability study was to establish if the results of several more recently developed qPCR methods (e.g., for alternative indicators such as E. coli and Bacteroidales) or using various method modifications might be suitable for generating meaningful health relationship
assessments. If the archived sample results did not show a change with respect to the original sample results using the original qPCR methods, this would lend credibility to using the results of the newer qPCR methods that were employed in the analyses of the archived samples for also assessing health relationships. To address the question of archived sample stability, the analysis results from each of the qPCR methods that were performed from 2003–2007 on the original NEEAR study samples (Enterococcus for both fresh water and marine beach samples and
Bacteroidales for marine beach samples only) were compared with corresponding results
obtained two to six years later in 2009 from the archived samples.
To further evaluate the effects of filter freezer storage on qPCR analysis results, a supplemental long-term holding time study was also conducted by the U.S. EPA, Region 1 Research
Laboratory in North Chelmsford, MA. In this study, replicate filters from 29 fresh water and 23 marine water samples from diverse non-recreational beach locations in the Boston, MA area were held in freezer storage for varying lengths of time from 24 hours up to2 years prior to analysis. In addition to qPCR analysis for Enterococcus, this study also sought to provide data for newer qPCR-based methods that were not included in the original NEEAR studies
(specifically Bacteroidales in fresh water and E. coli in both fresh and marine waters). A
demonstration that the filter analysis results in this study did not show a change over time, would lend further credibility to using the analysis results of the archived NEEAR study samples by these newer qPCR methods to assess health relationships.
Material and Methods
Materials and methods for archived sample stability study
Water samples. Water samples for the NEEAR study were collected over a four year period from 2003 to 2007. Sampling sites were West Beach at the Indiana Dunes National Lakeshore in
Porter, Indiana on Lake Michigan in 2003; Huntington Beach in Bay Village, Ohio on Lake Erie in 2003; Silver Beach, near St. Joseph, Michigan, and Washington Park Beach in Michigan City, Indiana on Lake Michigan in 2004; Edgewater Beach in Biloxi, MS on the Gulf of Mexico in 2005; Fairhope Municipal Beach in Fairhope, AL on the Gulf of Mexico in 2007; and Goddard State Memorial Park Beach in West Warwick, RI on Long Island Sound in 2007.
Sampling designs were similar at each of the sites. Sampling visits occurred on Saturdays, Sundays and holidays over time periods varying from approximately 10 to 12 weeks from either May through August or June through September. Sampling occurred three times daily, at 8 AM, 11 AM, and 3 PM in waist-level (1 m deep) and shin-level water (0.3 m deep) locations along three transects perpendicular to the shoreline. The sampling design at Huntington Beach included three additional shin-level locations.
Sample collection and distribution. One liter water samples were collected at each location by standard methods as recommended in Section 9060 of Standard Methods for the Examination of
Water and Wastewater, American Public Health Association (1998). Following collection, all
samples were placed in coolers and maintained on ice during transport to a local laboratory and at 1–4°C during the time interval before they were processed. Processing of all samples by filtration was performed within six hours of collection.
Duplicate 50 or 100 ml volumes of each water sample (either 50 or 100 ml was used consistently for all samples within a beach) were filtered through 47-mm, 0.4-μm pore size polycarbonate filters (catalog #K04CP04700, Osmonics Inc., Minnetonka, MN) and the sides of the funnels were rinsed twice with 20 ml of sterile, phosphate buffered saline. The filters were transferred to a Petri dish with the sample side facing up. Using sterile forceps, each filter was folded into a cylinder with the sample side facing inward, and then inserted into a 2 ml semiconical screw-cap microcentrifuge tube (extraction tube; catalog #506-636, PGC Scientific, Gaithersburg, MD) containing 0.3 g of acid-washed glass beads (catalog #G-1277, Sigma, St. Louis, MO). The filters were held at -20 °C for no more than three days until shipment to the analytical
Inc., Cinnaminson, NJ for analysis within seven days while the duplicate was shipped to the U.S. EPA’s National Exposure Research Laboratory (NERL), Cincinnati, OH for archiving.
Sample archiving. Filters received by the U.S. EPA NERL laboratory were immediately transferred to a -40°C, 25 cubic ft. capacity, 208V upright freezer (model A25-40T, So-Low Environmental Equipment Co., Cincinnati, OH) where they were stored continuously (except as noted below) until analysis in 2009. The freezer temperature was continuously monitored by a centralized monitoring system within the Cincinnati facility. On several occasions samples were briefly removed from the freezer for reorganization and/or while defrosting of the freezer and on one occasion they were temporarily transferred to other freezers due to a facility power outage. Possible temperature changes of the filters during these activities were not determined.
Sample analyses. Original filters sent to the EMSL lab and archived filters stored at the NERL laboratory were extracted to recover total DNA and the DNA extracts were subjected to qPCR analysis by the basic procedures described in Haugland et al. (2005). Briefly, cells were suspended from the filters and lysed in a bead mill for 60 seconds at maximum speed and the debris was removed by centrifugation. For all samples analyzed after 2004, including the archived samples, the published DNA extraction procedure was modified slightly by increasing the total volume of extraction buffer, containing 0.2 µg ml-1 salmon DNA in AE buffer (Qiagen, Valencia, CA), from 0.3 ml to 0.6 ml and decreasing the dilution of extracts prior to analysis from 10-fold to 5-fold. Calibrator samples (three to six replicates), consisting of clean polycarbonate filters amended with known cell quantities of Enterococcus faecalis (ATCC# 29212) and/or Bacteroides thetaiotaomicron (ATCC # 29741), and negative control samples (three to six replicates), consisting of clean filters only, were extracted in the same manner with each batch of test samples. Cells used by EMSL in the calibrator samples originated from laboratory grown cultures and were enumerated as previously described (Haugland et al. 2005, Siefring et al. 2008). Cells used by U.S. EPA NERL were enumerated by flow cytometry and were acquired in the form of commercially available, lyophilized pellets (Bioballs™, BTF, Sydney Australia). QPCR analyses were performed using previously described primer and TaqMan™ hybridization probe assays for Enterococcus and Oncorhynchus keta (salmon) DNA target sequences (Haugland et al. 2005) on all samples (Great Lakes and marine) and a
previously described primer and TaqMan™ hybridization probe assay for total Bacteroidales
target sequences (Siefring et al. 2008) were performed on marine samples only. Primer and probe characteristics of each of these assays are listed in part II of this report. QPCR
amplification of water sample and calibrator sample DNA extracts, and negative control samples, was performed by using 5 µL of equally diluted extracts in a total reaction volume of 25 µL. Reagent mixes were prepared by combining 12.5 µL of TaqMan® Universal Master Mix
(Applied Biosystems, Foster City, CA), 2.5 µL of 2 mg/ml bovine serum albumin, 1 µM of each primer, and 80 nM of probe for each reaction. Amplification occurred with an initial start at 50 °C for 2 min followed by 95 °C for 10 min, then forty PCR cyclesof 95 °C for 15 s and 60 °C for 1 min. All analyses of the fresh samples were performed by EMSL Analytical Inc., Cherry Hill, NJ in a Cepheid SmartCycler® II(Cepheid, Sunnyvale, CA). All analyses of the archived samples were performed in the U.S. EPA NERL laboratory in either a Cepheid SmartCycler® II (freshwater samples) or in an Applied Biosystems StepOnePlus® (marine samples). Results obtained on these two instruments have been previously compared in simultaneous analyses of DNA extracts from multiple, replicate filter retentates of 12 marine and 12 freshwater samples from diverse locations. No significant difference (p > .05) in log10 target sequence copy recovery estimates, based on three-way ANOVA with fixed factors: instrument, matrix, instrument*matrix; and random factors: sample (nested in matrix) and inst*sample (nested in matrix), nor in precision among these estimates (p > .05), based on the one-way ANOVA of Levene's Test for Homogeneity of Variance was observed in the results from the two instruments (unpublished data). For this reason results from the present study treated results from both instruments as equivalent or interchangeable.
Materials and methods for long-term holding time study
Water samples. Water samples analyzed in this study were collected from 29 freshwater sites and 23 marine water sites in the Boston, MA area. Different subsamples of the same water samples used in this study were used for the short term holding study, presented in part II of this report. Sampling locations and considerations in the selection of these locations are described in part II of this report. Although 25 samples from both marine and freshwater sites were planned for, some sites thought to be saltwater were later reclassified after measurements revealed low levels of salinity.
Sample collection and archiving. Either three or four water samples were simultaneously collected in 1 liter bottles at each site by standard methods as recommended in Section 9060 of
Standard Methods for the Examination of Water and Wastewater, American Public Health
Association (1998). Following collection, all samples were placed in coolers and maintained on ice during transport to the U.S. EPA Region 1 laboratory and at 1–4°C during the time interval before they were processed.
Upon arrival to the laboratory, and within six hours of collection, the contents of the individual 1 liter collection bottles for each sampling site were combined in a carboy and mixed. A total of eight 50 ml, or for some samples 100 ml, volume aliquots of each composite water sample were filtered through 47-mm, 0.4-μm pore size polycarbonate filters (catalog #K04CP04700,
Osmonics Inc., Minnetonka, MN) and the sides of the funnels were rinsed twice with 20 ml of sterile, phosphate buffered saline. The filters were then transferred to a Petri dish with the sample side facing up. Using sterile forceps, each filter was folded in half three times to form an umbrella and then inserted into a 2 ml semiconical screw-cap extraction tubes, containing 0.3 g of siliconized ceramic beads (Roche MagNA Lyser Green BeadsTM). All filter samples were flash frozen by placing the tubes in a cooling block, pre-chilled to -20 °C for 1 hour, and then held in a -20 °C freezer until they were extracted and analyzed. Duplicate filter samples from each site were extracted and analyzed after being held for 1 day, and 6, 12, and 24 months. Multiple replicate calibrator sample filters were prepared just prior to the study by placing aliquots of a single mixed cell suspension containing pre-determined cell quantities of laboratory-grown, representative target strains of each of the assays (E. faecalis, B.
thetaiotaomicron and E. coli) on clean filters. These calibrator filter samples were held at -20 °C
and replicate filters were extracted and analyzed in parallel with each batch of test samples at each time point in the holding study. Since the calibrator sample filters were held in freezer storage for the same lengths of time as the water sample filters, the holding time effects presented in this report are specific to the water samples and do not take into account any potential holding time effects on the cultured calibrator cells. However, target sequence
on comparisons of raw CT values and after calibration of the CT results with standard curve data.
Sample analyses. Filter samples were extracted to recover total DNA and the DNA extracts were subjected to qPCR analysis as described for the NEEAR study samples. Duplicate analyses were performed on each filter sample extract. In addition, analyses for E. coli 23S rRNA gene target sequences were performed in the same manner except using Gene Expression PCR Master Mix (Applied Biosystems) and an unpublished TaqMan® probe and primer set (Primer and probe characteristics of this assay are listed in part II of this report). All of the qPCR analyses were conducted by the U.S. EPA Region 1 laboratory in a Cepheid SmartCycler® II.
Computational methods
Analysis data consisted of paired observations of filters from each sample: (1) a qPCR measurement soon after the sample had been collected and (2) a qPCR measurement after archival and storage over a six month to two year period (long-term holding time study) or a two to six year period (archived sample stability study). Statistical analysis was performed on log transformed calibrator cell equivalents (CCE) estimated by qPCR using the “∆∆CT” approach as previously described (Haugland et al. 2005) and as used in the NEEAR study analysis of
swimmers’ risk-exposure relationship (Wade et al. 2006, 2008, 2010).
The ∆∆CT computational approach, which is derived from the comparative cycle threshold (CT)
method (Applied Biosystems 1997), employs an arithmetic formula to determine the ratio of target sequence quantities in DNA extracts from test sample filters relative to those in similarly-prepared DNA extracts from calibrator sample filters containing a known quantity of target organism cells based on the difference in CT values obtained from qPCR analyses of these samples. Similar comparisons of CT values from qPCR assays for an exogenous target sequence from salmon sperm DNA, added in equal quantities to both the test and calibrator sample filters before DNA extraction, were used both as a reference to normalize results for differences in the amount of total DNA recovered from each sample (e.g., caused by test sample effects on DNA recovery) and as a sample processing control (SPC) to signal potentially non-quantifiable test sample results caused by PCR inhibition or low DNA recoveries (Haugland et al. 2005). The calculation can be expressed by the following equations:
∆∆CT = ∆CT,target - ∆CT,reference (1)
CCE = NCalibrator⋅A-∆∆CT (2)
in which ∆CT,target represents CT,sample - Mean CT,calibrator for the target sequence (e.g., enterococci)
and ∆CT,reference represents the corresponding difference for the salmon sperm reference sequence.
Ncalibrator is the known number of cells in the calibrator sample and A is the amplification factor
for the assay. Ideally, A=2 but typically it is in the range 1.9 – 2.0 with values less than 2 resulting from less than 100% replication of the target sequence at each cycle. In practice, A is either assumed to be 2 or is calculated based on the slope of a standard curve (Applied
Biosystems 1997). The calculation can be expressed by the following equation:
A = 10^(1/-stand curve slope) (3)
For both the archived sample stability and the long-term holding time studies, slope values were obtained from standard curves generated by each of the laboratories from pooled results of repeated qPCR analyses of serially diluted DNA standards nominally containing target
sequences in a range from 10 to 4 x 10⁴ copies per analysis. Table 1-1 shows the Y-intercept, slope and amplification factors calculated by each of the laboratories from their respective master standard curves from each of the qPCR assays.
Table 1-1. Master standard curve variables for qPCR assays
Laboratory (instrument) Indicator qPCR Assay Y-intercept Slope A
EMSL (Smart Cycler) Enterococcus 38.32 -3.42 1.96
Bacteroidales 38.61 -3.34 1.99
NERL (Smart Cycler) Enterococcus 38.16 -3.62 1.89
NERL (StepOnePlus)) Enterococcus 38.94 -3.50 1.95
Bacteroidales 39.19 -3.62 1.89
U.S. EPA Region 1 (Smart Cycler) Enterococcus 37.01 -3.24 2.05
Bacteroidales 37.41 -3.22 2.05
Statistical analyses
For both the archived sample stability and the long-term holding time studies, the analyses were conceptually the same, although differences in the designs of the respective studies necessitated slightly different treatment of the data. In the long-term holding time study, duplicate filters were analyzed for each sample and the extract from each filter was analyzed by qPCR in
duplicate reactions at each time point. All of the results were well above the detection limit, this having been a criterion of sample selection in the first place. Therefore, for each water type, a nesting sampling scheme was present (duplicate analysis nested within filter and filter nested within sample). A mixed model was used to account for these as nested random effects. Data from the Frozen Storage study were analyzed using the MIXED procedure in SAS v. 9 for Windows (SAS Institute, Cary, NC 2009). Explicitly, the model used was:
∆∆CT= W + T + WT + Sample(W) + S*T(W) +Filter(W*T*S) + ε(0,σ2) (4)
in which W represents water type (fresh, marine), T represents time (0, 6 m, 12 m, 24 m), S uniquely identifies an individual random sample within each water type, and F is a uniquely identified filter (filter 1 or 2) within each sample. Within filter, there is random variability
represented by ε(0,σ2), which is assumed normal with mean zero and variance σ2
of the duplicate runs performed on each filter.
In the archived sample stability study, a single analysis of a single filter of each sample was performed shortly after collection and again for an archived filter two to six years later. The samples were not collected with the intention that they would necessarily all contain sufficiently high densities of the target fecal indicator organisms to allow their detection and, in fact, many samples were non-detects (up to 20% depending on beach). Data from the archived sample stability study could thus be analyzed for differences (archived result minus original result), but it was necessary to consider the non-detects as censored results. If the censored result was the original analysis, the difference was right censored, that is representing a lower bound on the actual difference since the original result could be lower than the stated value. Similarly, if the censored result was the archived analysis, the difference was left-censored, that is, likely to be smaller than the stated value. Sufficient statistics comprised the set of samples for which one or
both results were quantifiable so that samples for which both analyses yielded non-quantifiable results were ignored.
Maximum likelihood estimation (“Tobit analysis”) was used for the archived sample stability study analysis where the difference in log (base 10) between the qPCR results before and after archival were censored as above. Monte Carlo Markov Chain (MCMC) estimation using WinBUGS v. 1.4 (Lunn et al. 2000, Ntzoufras 2009) with diffuse priors was employed for this purpose because of the software’s ability to capture estimates of individual differences. These estimates were useful for evaluating the reasonableness of the normality model used and for further evaluating paired observations, particularly in terms of prediction of archived results based on the original results.
Other data analyses and summaries were performed in R v. 2.8 (2008) and Excel 2003 for Windows. An alpha level of 0.05 is used to determine statistical significance of differences or effects.
Quality control/ Quality assurance Laboratory
General guidance for overall laboratory quality assurance for environmental PCR analyses have been developed (U.S. EPA 2004) and was followed in this project.
Cultures
Culture collection strains of representative target species E. faecalis, B. thetaiotaomicron, and E
.coli were maintained as cell suspension freezer stocks. Fresh cultures of these strains were
prepared as described in the qPCR methods (U.S. EPA 2010a, 2010b, Chern et al. 2010) and routinely checked for evidence of contamination by microscopic examination of cell morphology and by examination of colony morphology on the appropriate agar plates. Freezer stocks were maintained at -80 °C. For NERL Cincinnati analyses, lyophilized BioballTM cell preparations were used to prepare positive control (calibrator) samples rather than lab-grown cell
Water samples
Collection and storage of water samples were conducted following general quality control guidelines described in sections 9060 A and B of Standard Methods for the Examination of Water and Wastewater (1998) and specific guidelines for the qPCR methods (U.S. EPA 2010a, 2010b).
Instruments
Microscopes and general laboratory equipment. General guidelines described in section 9030 of Standard Methods for the Examination of Water and Wastewater (1998) were followed for the maintenance of microscopes and general laboratory equipment.
Real-time sequence detection instruments. Calibrations of instruments were performed on-site or off-site as specified by the instrument manufacturers. Potential instrument performance problems were identified from positive control QC sample results. Service contracts for the instruments were maintained which included telephone troubleshooting support and on-site or off-site instrument service by a factory trained technician when required.
Data
qPCR data. Raw fluorescence growth curve data and other diagnostic information generated by the sequence detectors (run files) were archived on compact disks or flash drives that were specifically designated for this purpose. Run files were labeled with the date of the analysis and the analyst’s initials. CT results tables from each instrument run were exported and saved as
Excel files. Data from analyses performed by the sequence detectors consisted of CT values
from the different assays for positive control (calibrator), negative control, and test samples. The CT data were copied into Excel template worksheets that were custom designed for performing
comparative cycle threshold analysis and simple descriptive statistics tests (e.g., means and standard deviations of replicate samples).
1 Quality controls, QC acceptance criteria and responses
CFU enumeration. Quality controls for Enterococcus,B. thetaiotaomicron and E. coli cultured cell enumeration were performed as described in the qPCR methods (U.S. EPA 2010a, 2010b, Chern et al. 2010). Certificates of analyses indicating mean and standard deviations of cell quantities per BioballTM for each lot were either provided directly by the manufacturer or are available online at: http://www.btfbio.com/cofa.php?nav=BioBall.
qPCR analyses. Quality controls and QC acceptance criteria used in the Enterococcus and
Bacteroidales qPCR methods have been reported (U.S. EPA 2010a, 2010b). The same quality
controls and QC acceptance criteria were employed in qPCR analyses for E. coli. These QC acceptance criteria are identified in Table 1-2.
QC failures and responses. Frequencies of samples that failed the QC acceptance criterion for the salmon DNA SPC in the archived sample stability study are indicated in Table 1-3. These samples were excluded from further analyses. All other QC acceptance criteria for sample analyses by qPCR were consistently met.
Table 1-2. QC acceptance criteria for current U.S. EPA Enterococcus and Bacteroidales qPCR methods
Control Method QC acceptance criteria
Negative controls qPCR assay for target sequences in no template controls
At least 66% of analyses yield no logarithmic amplification traces. All analyses yield CT values >35.
qPCR assay for target sequences in method blanks
At least 66% of analyses yield no logarithmic amplification traces. All analyses yield CT values >35.
Positive controls qPCR assay for SPC sequences
Test sample analyses are within 3 CT units of mean value from daily
analyses of at least 3 equally diluted calibrator samples. qPCR assay for target
sequences in calibrator samples
Baseline mean CT value and standard deviation are determined from
analyses of a minimum of 9 calibrator samples. Mean CT values from
daily analyses of calibrator samples from same source are within 3 standard deviations of the laboratory’s baseline mean CT value.
Standard Curves Baseline slope values are determined from linear regression analysis of CT values from a minimum of three separate analyses (performed
in duplicate) of DNA standards. Slope values determined from subsequent analyses are within 95% confidence range of baseline values.
Table 1-3. NEEAR study archived sample characteristics West Beach Huntington Beach Silver Beach Washington Park Beach Edgewater Beach Fairhope Beach Goddard Beach Years stored 6 6 5 5 4 2 2 Enterococcus qPCR-CCE Total Samples 294 420 423 421 396 438 426 - Failed QC1 11 5 16 19 29 36 8 - Both times < DL2 8 10 18 7 9 49 35 Samples Used 275 405 389 395 358 353 383 # samples - Original < DL 5 7 38 23 38 74 24 - Archived < DL 102 111 105 113 46 85 109 - Neither < DL 168 287 246 259 274 194 250 % < DL before or after archival3 38.9 29.1 36.8 34.4 23.5 45.0 34.7 Bacteroidales qPCR-CCE Total Samples -4 - - - 396 438 426 - Failed QC - - - - 16 5 12 - Both times < DL - - - - 26 36 5 Samples Used - - - - 354 397 409 # samples - - - - - Original < DL - - - - 14 36 29 - Archived < DL - - - - 33 14 20 - Never < DL - - - - 307 347 360 % < DL before or after archival - - - - 13.3 12.6 12.0
1 Sample Processing Control out of range of ±3 cycle thresholds from mean.
2 Detection limit (DL) of 40 cycles reached without a positive signal in analyses for both the initial and archive
sample.
3 Among samples used.
Results
Archived sample stability study
Table 1-3 summarizes sample characteristics from the NEEAR original and archived data analyses. A total of 2818 samples were collected at the four fresh water and three marine water beach sites. An average of 4% and 5% of these samples did not meet quality control standards or gave assay values below the detection limit for both the original and archived samples, analyzed by EMSL Analytical Inc. and U.S. EPA, respectively. These samples were excluded from further analyses. Quality control failure and unusable data rates were similar for both fresh and marine samples (Table 1-3).
Of particular note is the relative number of sample data that were below the detection limit (“censored”) in the original analysis vs. when they were reanalyzed after a period of archival. For the Enterococcus assay, 24 to 45% of the samples from the different beaches yielded at least one qPCR result that was below the limit of detection. Among the Great Lakes samples, as well as Goddard Beach, non-detects were much more frequent after archival than before. This is as expected if there is a decline in the qPCR signal as a result of archival. However, at the other two marine beaches, non-detects were about as likely to occur after as they were before being archived. The imbalance in results below the limit of detection in original vs. archived samples was one more impetus to incorporate the non-detects in the analysis. Otherwise, results would be biased by discarding more samples that had declined than those that had increased.
Non-detect results for Bacteroidales were considerably less prevalent because of the larger number of these organisms, generally amounting to about an order-of-magnitude. Assays for
Bacteroidales were performed at only the three marine beaches, where non-detect results
amounted to only about 13% of all usable samples. While the percentage of non-detects may be small in comparison to those for Enterococcus, a 13% non-detect rate is still substantial. Note that samples with non-detects both before and after archival do not inform the estimation of an archival effect. We may infer that where this occurred, there was increased likelihood that that particular sample was devoid of the target DNA for the respective qPCR assay.
Using one-half the detection limit for non-detect results, Table 1-4 shows that when qPCR-CCE are calculated for the fresh and archived samples at each beach, the mean values for archived samples are consistently lower than those of fresh samples, although this decline was relatively small at Edgewater and Fairhope compared to the other beaches. These mean differences by beach, as well as a pooled precision parameter based on substituting one-half of the detection limit for censored data, were used as initial values in the MCMC estimation procedure.
Table 1-4. NEEAR study mean log10(qPCR calibrator cell equivalents) based on qPCR calibrator cell equivalents ÷ 2 for non-detects
West Beach Huntington Beach Silver Beach Washington Park Beach Edgewater Beach Fairhope Beach Goddard Beach Enterococcus qPCR-CCE Original 2.201 2.244 1.696 1.746 2.062 1.847 2.239 Archived 0.831 1.246 1.098 0.965 1.935 1.670 1.451 Change -1.370 -0.998 -0.598 -0.781 -0.128 -0.178 -0.788 Bacteroidales qPCR-CCE Original -1 - - - 2.999 3.050 3.120 Archived - - - - 2.494 2.862 2.807 Change - - - - -0.505 -0.187 -0.313
1Bacteroidales qPCR was not performed at the 4 freshwater beaches.
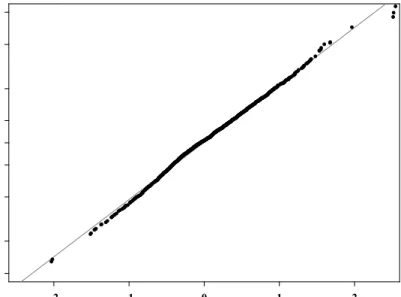
A probability plot of the residuals from the MCMC estimation procedure, that is, log10(∆∆CT, archived) – log10(∆∆CT, fresh) less it’s respective MCMC mean, is given in Figure 1-1. The plot
Residual Value -2 -1 0 1 2 C u mu la ti v e F req u en cy ( % ) 0.1 1 10 30 50 70 90 99 99.9
Figure 1-1. Probability plot of residuals from the MCMC model for differences in observed log10 qPCR analysis between archived and original samples
Final analytical results from MCMC estimation that explicitly accounted for values below their respective limits of detection (Table 1-5) indicated strong, statistically significant declines in qPCR-CCE yields from the archived NEEAR samples from most beaches. Samples from all but Edgewater Beach in Biloxi and Fairhope Beach exhibited highly significant declines with respect
to Enterococcus recoveries. With respect to Bacteroidales qPCR-CCE, Edgewater and Goddard
Beach samples exhibited highly significant changes. The analysis was performed on logarithm-transformed qPCR-CCE. To put these numbers in perspective, Table 1-5 also shows the equivalent percent declines that corresponded to the differences in geometric means (the
antilogarithms of the mean log differences). In many cases, these declines imply that only 10% or less of the original DNA remained in the archived samples.
Pearson product moment correlations based on the MCMC estimates are given in the last column of Table 1-5. For enterococci, the correlations were particularly low where there was any
correlation whatsoever. A common measure of predictability in regression analysis is R2, which is equal to the square of the Pearson correlation. Multiplied by 100, an R2 indicates the percent
Table 1-5. Maximum likelihood estimates of difference between archived and original samples Log10 change P-value1 Equivalent % change Pearson correlation Enterococcus qPCR-CCE West Beach -1.65 < 0.001 -98% 0.36 Huntington Beach -1.19 < 0.001 -94% 0.39 Silver Beach -0.70 < 0.001 -81% -0.01
Washington Park Beach -0.94 < 0.001 -89% -0.04
Edgewater Beach -0.14 0.195 -28% 0.11 Fairhope Beach -0.21 0.113 -38% -0.04 Goddard Beach -1.00 < 0.001 -90% 0.11 Bacteroidales qPCR-CCE Edgewater Beach -0.51 < 0.001 -69% 0.52 Fairhope Beach -0.06 0.255 -12% 0.46 Goddard Beach -0.28 < 0.001 -47% 0.48
1 P-values in bold-face indicate statistically significant differences.
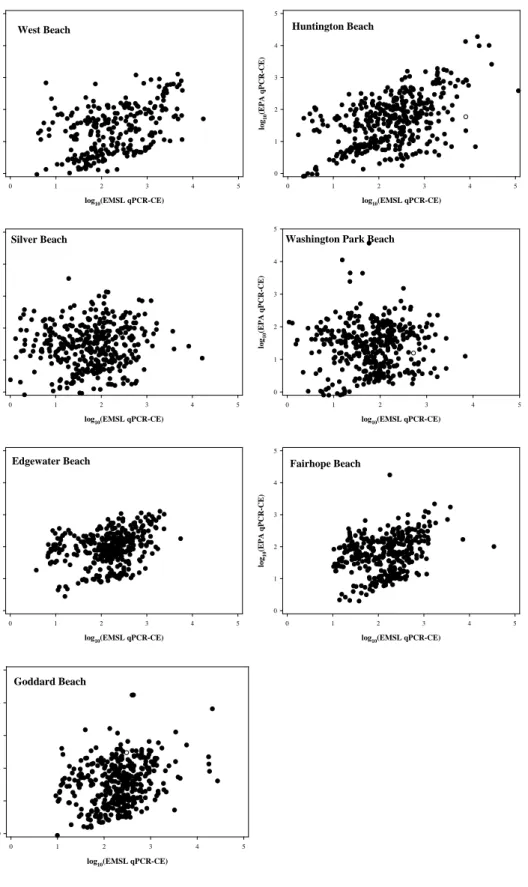
of variation explained by the independent variable. In this study, the independent variable would be regarded as the initial qPCR-CCE result, and knowing this value was seen to account for only 10% or less in the variation among archived sample qPCR results. Scatter plots of archived vs. original log10(qPCR-CCE) results for Enterococcus are shown by beach in Figure 1-2.
Bacteroidales qPCR-CCE results from the archived samples show much better correlation with
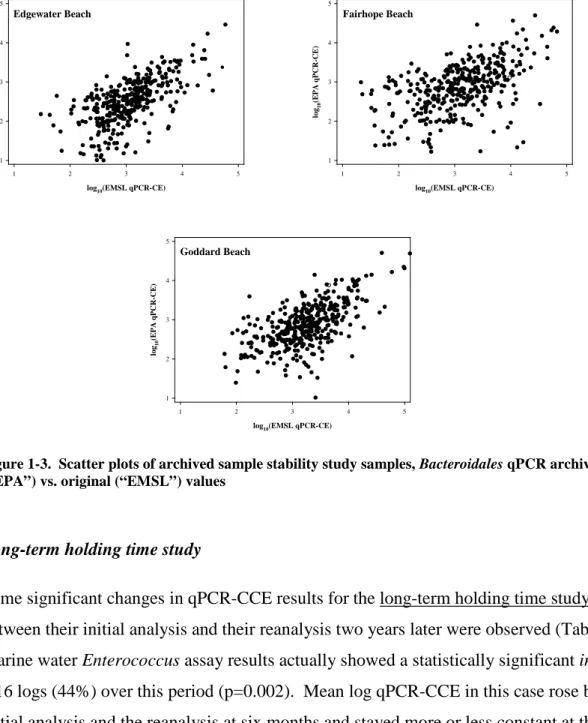
their respective initial analyses compared to the Enterococcus analyses. These correlations still are not substantial, however, and amount to R2 values on the order of 0.25, thus explaining only 25% of the variation among archived sample analyses for Bacteroidales. We show the scatter of archived vs. original log10 qPCR-CCE results for Bacteroidales in Figure 1-3.
log10(EMSL qPCR-CE) 0 1 2 3 4 5 log 1 0 (E P A q P C R-CE ) 0 1 2 3 4 5 West Beach
log10(EMSL qPCR-CE)
0 1 2 3 4 5 log 1 0 (E P A q P C R-CE ) 0 1 2 3 4 5 Huntington Beach
log10(EMSL qPCR-CE)
0 1 2 3 4 5 log 1 0 (E P A q P C R-CE ) 0 1 2 3 4 5 Silver Beach
log10(EMSL qPCR-CE)
0 1 2 3 4 5 log 1 0 (E P A q P C R-CE ) 0 1 2 3 4 5
Washington Park Beach
log10(EMSL qPCR-CE)
0 1 2 3 4 5 log 1 0 (E P A q P C R-CE ) 0 1 2 3 4 5 Edgewater Beach
log10(EMSL qPCR-CE)
0 1 2 3 4 5 log 1 0 (E P A q P C R-CE ) 0 1 2 3 4 5 Fairhope Beach
log10(EMSL qPCR-CE)
0 1 2 3 4 5 log 1 0 (E P A q P C R-CE ) 0 1 2 3 4 5 Goddard Beach
Figure 1-2. Scatter plots of archived sample stability study samples, Enterococcus qPCR archived (“EPA”) vs. initial (“EMSL”) value
log10(EMSL qPCR-CE) 1 2 3 4 5 log 1 0 (E P A q P C R-CE ) 1 2 3 4 5 Edgewater Beach
log10(EMSL qPCR-CE)
1 2 3 4 5 log 1 0 (E P A q P C R-CE ) 1 2 3 4 5 Fairhope Beach
log10(EMSL qPCR-CE)
1 2 3 4 5 log 1 0 (E P A q P C R-CE ) 1 2 3 4 5 Goddard Beach
Figure 1-3. Scatter plots of archived sample stability study samples, Bacteroidales qPCR archived (“EPA”) vs. original (“EMSL”) values
Long-term holding time study
Some significant changes in qPCR-CCE results for the long-term holding time study samples between their initial analysis and their reanalysis two years later were observed (Table 1-6). Marine water Enterococcus assay results actually showed a statistically significant increase of 0.16 logs (44%) over this period (p=0.002). Mean log qPCR-CCE in this case rose between the initial analysis and the reanalysis at six months and stayed more or less constant at that level at the one and two year marks. Meanwhile, Enterococcus qPCR-CCE results from freshwater samples exhibited a small “marginally significant” (p=0.063) decline. Among the other assays, both Bacteroidales (p<0.001) and E. coli (p=0.022) re-analyses indicated significant declines in the PCR target in freshwater samples after two years amounting to 40% and 21% of their initial values (0.22 and 0.10 logs), respectively. The decrease in Bacteroidales signal was already evident at six months, but E. coli declined incrementally. Another decrease in qPCR results over the two year period was for Bacteroidales from marine water samples where the change was
Table 1-6. Long-term holding time study samples mean log10(qPCR calibrator cell equivalents) and change from initial results (24 hr) for samples held for two years
Mean log10(qPCR-CCE) 2 yr net
change1 P-value2 Equivalent % change Pearson correlation 24 h 6 mo 1 yr 2 yr Enterococcus qPCR-CCE Freshwater3 3.82 3.93 3.77 3.73 -0.08 0.063 -17 0.94 Marine4 3.34 3.61 3.45 3.50 0.16 0.002 44 0.92 Bacteroidales qPCR-CCE Freshwater 6.49 6.23 6.32 6.27 -0.22 < 0.001 -40 0.96 Marine 6.10 6.30 5.98 6.00 -0.10 0.056 -20 0.96 E. coli qPCR-CCE Freshwater 4.65 4.64 4.58 4.55 -0.10 0.022 -21 0.95 Marine 3.99 4.02 3.98 4.01 0.02 0.658 5 0.95
1 Difference from 24 h to 2 yr mean log
10(qPCR-CCE).
2 P-values in bold-face indicate statistically significant differences. 3 N=29.
4
N=23.
only marginally significant (p=0.056). Target sequence recoveries from the calibrator samples showed no decreases over this time period for any of the indicator organisms.
Pearson correlations between initial and two-year log10(qPCR-CCE) values were all above 0.9,
being in all but one case about 0.95 (Table 1-6). Correspondingly, R2 values were all 0.84 or higher. This fact is reflected in the plots of two-year vs. initial log10(qPCR-CCE) values in
Figure 1-3.
Discussion
The primary purpose of the present analysis is to evaluate the feasibility of using the archived NEEAR study samples as surrogates for fresh samples in determining relationships between results of new or revised methods for potential indicator bacteria of fecal pollution and swimmers’ health risks. New methods that were examined in the analyses of the archived
samples included qPCR assays for E. coli and total Bacteroidales (the former assay being of interest due to the widespread acceptance of E. coli as an indicator of fecal pollution in fresh waters and the latter assay being of interest due to its use in the original analyses of marine samples only). Modified methods included purification and concentration of DNA in the filter extracts as well as the incorporation of additional and/or improved positive controls for the detection of PCR inhibition. For the archived data to be used in this manner, the most desirable outcome would be for there to be no change between the original analyses and the archived sample analyses two to six years later. In addition there should be a relatively high correlation between the two sets of results (the latter implying a low variance of the difference). Lacking this, at least a high correlation between the two sets of results might allow some adjustment to be made to the archived data so that they would reliably reflect the fresh sample data. Devising an adjustment factor would necessarily involve non-provable, critical assumptions, such as that other qPCR assays would follow the predictive model established by the results that were available. Results from analyses of the archived samples by the new or revised methods may at least be more readily accepted if one or both of the conditions described above are indicated by the available data.
The analysis of the previous section shows, however, that suitability of the archived samples as surrogates for original samples is contraindicated by comparisons between archived and original sample results with respect to the available data, i.e., qPCR results for Enterococcus and marine
Bacteroidales. Not only are large, highly significant declines in qPCR-CCE recoveries
observed, but the differences are largely unpredictable from sample to sample as evidenced by the low correlation between results of archived and original sample analyses. This precludes the possibility of using any sort of “adjustment factor” to rectify this change.
A short-coming of the archived sample data from the archived sample stability study, with respect to the interpretation of their change, is that the initial analysis of original samples and analysis of archived samples two to six years later were performed by different laboratories. Thus, the effects of change over time may be confounded with effects of different analysts and equipment. However, even for the long-term holding time study data, time effects are
performed all of the qPCR analyses. An experiment designed to properly capture all of the between lab and between time variation would have to involve several labs performing both the original and archived sample qPCR analysis. The cost of doing so would be prohibitive and even then, one would have to assume that there were no systematic changes in labs and/or qPCR quality over time. By way of a rough comparison of the changes observed among the archived samples over time and the magnitude of changes that may be expected from lab-to-lab variation, some preliminary data on qPCR inter-laboratory variance are available (U.S. EPA Office of Water 2008, unpublished data; Ad Hoc multi-laboratory study 2010, unpublished data). These data indicate that a two standard deviation (i.e., 95% confidence level) difference on the order of about 0.5–0.7 logs might be expected between two labs analyzing the identical sample. Most of the significant changes observed in the archived samples are outside this range. Therefore, it does not seem likely that inter-laboratory differences themselves could have accounted for all of the observed changes.
Given the negative results for the archived sample stability study data, results from long-term holding time study have a greatly reduced relevance. The value of the long-term holding time information would have been in supporting the inference that the equivalency or predictability of the NEEAR archived sample data could be extrapolated to other qPCR targets (most notably E.
coli and fresh water Bacteroidales), but neither equivalency nor predictability were observed for
any of the NEEAR study results that could be directly compared. Even if one or both of these conditions had been met, there would have been additional challenges in making such
extrapolations. Results from the long-term holding time study, particularly the high correlations between held and initial sample qPCR-CCE values, indicate that archived samples may be capable of serving as surrogates for fresh samples under some circumstances, at least with a statistical correction. However, the predictive relationship observed in the long-term holding time study would need to have been extrapolated from two years out to as long as six years in order to be applicable to the archived sample stability study samples. The length of time that samples are held would logically seem to be an important factor, as is borne out by the archived data, except for enterococci results at Goddard Beach. The Goddard Beach data showed a 90% 2-year decline in mean log10 (qPCR-CCE) that was more in line with the five and six year
study data themselves, which were designed to track change over time, were not consistent among the different indicator and water matrix combinations with respect to showing progressive declines, if any at all, over time, nor were they consistent with the changes seen in the archived sample stability study Fairhope, and particularly Goddard marine beach, samples that were held for the same total amount of time of two years.
The finding of a lack of stability in the archived samples in this study does not preclude the possibility that more favorable results might have been achieved using alternative storage conditions. The conditions used for storing the archived NEEAR study samples were adopted primarily for practical reasons, such as the availability of freezer space in the NERL Cincinnati laboratory, rather than on the basis of what might have been the optimal storage conditions. Because of our intention of being able to link the results of the two studies, the storage conditions used in the long-term holding study were also dictated in large part by the storage conditions used for the archived NEEAR study samples.
It was difficult to interpret results in the literature for their relevance to the specific questions posed in this study. Particularly important studies to consider would be those involving similar types of cells, similar influences of organic, chemical and other constituents in water samples, low copy numbers of the target of interest, and similarities in the conditions and duration of storage. However, no studies meeting all of these conditions were identified.
Recovery of DNA standards after storage under various conditions has been reported. Storage conditions that appeared to give the greatest recoveries included storage at -20 °C in buffer or glycerol or lyophilized at +4 or -20 °C (Podivinsky et al. 2009, Roder et al. 2010). A number of studies have characterized DNA recovery from cells that were in high abundance and not from environmental samples (Cannas et al. 2009, King et al. 2009, Rohland and Hofreiter 2007, Smith and Morin 2005, Wallenius et al. 2010, Wong et al. 2008). Some of these studies indicate better recovery at -80 °C compared to -20 °C. A number of additives have been studied however there is generally mixed results with some reporting that the recovery was just as efficient with no additives (Smith and Morin 2005). Recovery of DNA from urine samples stored for up to 28 days indicated a log or more loss of signal from storage at temperatures ranging for 4 °C to -80
°C (Cannas et al. 2009). Another study indicated more efficient recovery at -20 °C over -80 °C for DNA samples analyzed by RFLP from stomach tissue (Molbak et al. 2006). Recovery of DNA from ancient and forensic samples has also been studied (King et al. 2009, Rohland and Hofreiter 2007, Wallenius et al. 2010, Wong et al. 2008). However, the relevance of these studies is also questionable since the recovery efficiency requirements were generally not as great and the duration of storage was not comparable. Efficient recovery of viral DNA by qPCR was observed from clinical samples after storage of 16 months at -20 °C (Jerome et al. 2002).
Recovery and qPCR amplification of DNA from stored bacterial cells have been reported, however, there were still significant differences in the types of cells, samples and storage conditions examined in these studies as compared to those examined in the present study. Efficient recoveries have been reported from Bacillus anthraces spores stored at 4 °C for 182 days (Alemeida et al. 2007). However spores may be more stable to environmental influences and the duration of storage was much shorter. Studies on the recovery of bacterial DNA from stored soil samples reported efficient recoveries in samples stored at -20 or -80 °C with (phenol– chloroform–isoamyl alcohol) or without additives for storage for 14–30 days (Lauber et al. 2010, Rissenen et al. 2010).
As a final point in the comparison of original and archived sample results from the NEEAR study, we note that Enterococcus and Bacteroides target organism cells used for the preparation of calibrator sample filters by the two laboratories came from different sources. Cells used by EMSL originated from laboratory grown cultures and were enumerated as previously described (Haugland et al. 2005, Siefring et al. 2008). Cells used by U.S. EPA NERL were enumerated by flow cytometry and were acquired in the form of commercially available, lyophilized pellets (Bioballs™, BTF, Sydney Australia). To evaluate the comparability of target organism CCE estimates in the test samples using calibrator samples prepared from these two cell sources, target sequence recoveries from calibrator sample DNA extracts prepared by each of the
laboratories were examined. Quantitative estimates of target sequence recoveries per calibrator cell were obtained by interpolating qPCR CT values from analyses of the calibrator extracts on master standard curves generated by each of the laboratories from pooled results of repeated qPCR analyses of DNA standards nominally containing from 101 to 4x10⁴ target sequence copies
per analysis. Results from these analyses indicated that the mean target sequence recoveries from the laboratory grown Enterococcus cells used by EMSL were approximately two-fold higher than those from the Bioball™ Enterococcus cells used by U.S. EPA NERL. This apparent difference may have been related to uncertainty in the applicability of the EMSL standard curves. Uncertainty in the EMSL recovery estimates was associated with the fact that known concentration DNA standards were only analyzed by this lab during one year of the study. In other years only slope (amplification efficiency) values were determined from serial dilutions of the calibrator sample extracts. The slope values from this laboratory were not considered to be different from year to year as indicated by overlapping 95% confidence ranges. If real, the observed difference in target sequence recovery estimates from the two sources of cells would result in a systematic bias towards relatively high CCE estimates for the archived U.S. EPA NERL test samples compared to those obtained for the original EMSL samples implying that, if anything, the actual difference between initial and archived data were even greater than the differences in enterococci results of Table 1-5. In contrast, the mean target sequence recoveries from the laboratory grown Bacteriodes calibrator cells used by EMSL were nearly identical to those from the Bioball™ cells used by U.S. EPA NERL as determined from the master standard curves generated by the respective laboratories, a condition that does not lead to change in Table 1-5 for Bacteroidales.
Conclusions
The archived sample stability study results from Great Lakes and marine beaches indicate that significant degradation of samples had occurred. The highly significant changes and low or absent correlation between archived and original sample analyses indicate that the archived filters cannot be used in a credible manner to establish health relationships involving
Enterococcus qPCR or, by extension, any other indicator, pathogen, or method. Any health
relationship based on data derived from the archived samples is not useful because these do not reflect data that would have been obtained from fresh samples in actual beach monitoring circumstances.
The results from the long-term holding time study, though minor in importance compared to the analysis of the archived sample stability study samples, showed small but significant differences
in the 24-month holding time study for Bacteroidales and E. coli that further complement the findings of the archived sample stability study samples that differences are observed between the original and archived samples.
References
Almeida, J. L., B. Harper, and K. D. Cole. 2008. Bacillus anthracis spore suspensions: determination of stability and comparison of enumeration techniques. J. Appl. Microbiol. 104:1442-1448.
American Public Health Association (APHA). 1998. Standard Methods for Examination of Water and Wastewater. 20th ed. Washington, D.C.
Applied Biosystems. 1997. User Bulletin #2. ABI PRISM 7700 Sequence Detection System. http://www3.appliedbiosystems.com/cms/groups/mcb_support/documents/generaldocuments/cm s_040980.pdf.
Cannas, A., G. Kalunga, C. Green, L. Calvo, P. Katemangwe, K. Reither, M. D. Perkins, L. Maboko, M. Hoelscher, E. A. Talbot, P. Mwaba, A. I. Zumla, E. Girardi, and J. F. Huggett. 2009. Implications of Storing Urinary DNA from Different Populations for Molecular Analyses.
PLoS ONE 4(9): e6985.
Chern, E. C., S. C. Siefring, J. Paar, M. Doolittle, and R.A. Haugland. 2010. Comparison of quantitative PCR assays for Escherichia coli targeting ribosomal RNA and single copy genes. Manuscript Submitted.
Haugland R. A., S. C. Siefring, L. J. Wymer, K. P. Brenner, and A. P. Dufour. 2005. Comparison
of Enterococcus measurements in freshwater at two recreational beaches by quantitative
Jerome, K. R., M-L. Huang, A. Wald, S. Selke, and L. Corey. 2002. Quantitative stability of DNA after extended storage of clinical specimens as determined by real-time PCR. J. Clin. Microbiol. 40:2609-2611.
Lauber C. L., N. Zhou, J. I. Gordon, R. Knight, and N. Fierer. 2010. Effect of storage conditions on the assessment of bacterial community structure in soil and human-associated samples. FEMS Microbiol. Lett. 307:80-86.
Lunn, D. J., A. Thomas, N. Best, and D. Spiegelhalter. 2000. WinBUGS -- a Bayesian modelling framework: concepts, structure, and extensibility. Stat. Comput. 10:325-337.
Ntzoufras I. 2009. Bayesian Modeling Using WinBUGS, John Wiley & Sons, Hoboken, NJ.
Molbak, L., H. M. Sommer, K. Johnsen, M. Boye, M. Jahansen, K. Moller, and T. D. Leser. 2006. Freezing at -80 ºC distorts the DNA composition of bacterial communities in intestinal samples. Curr. Issues Intestinal Microbiol. 7(1):29-34.
Podivinsky, E., J. L. Love, L. van der Colff, and L. Samuel. 2009. Effect of storage regime on the stability of DNA used as calibration standard for real-time polymerase chain reaction. Anal. Biochem. 394:132-134.
R Foundation for Statistical Computing. 2008. R: A Language and Environment for Statistical Computing, Vienna, Austria.
Röder B., K. Frühwirth, C. Vogl, M. Wagner, and P. Rossmanith. 2010. Impact of long-term storage on the stability of standard DNA for nucleic acid based methods. J. Clin. Microbiol. 48:4260-4262.
Siefring S. C., M. Varma, E. Atikovic, L. J. Wymer, R. A. Haugland. 2008. Improved real-time PCR assays for the detection of fecal indicator bacteria in surface waters with different