Bruk av indekslinjer i overvåking av gaupebestander (2007)
1
Instruks for bruk av indekslinjer i
overvåking av gaupebestander
Del 2 – Utvikling av metodikk
Nasjonalt overvåkingsprogram for rovvilt (www.rovdata.no)
Datasimuleringer
Det skandinaviske gaupeprosjektet, SCANDLYNX (http://scandlynx.nina.no/), hadde
i perioden 1995–2000 radiosender på en stor andel av gaupene innenfor de sentrale
deler av Hedmark. For å vurdere hvor godt egnet indekslinjer er til å påvise
endringer i gaupebestanden har vi benyttet data på forflytningene til de
radiomerkede gaupene i et GIS system (geografisk informasjonssystem) der vi
simulerer kryssingen av indekslinjer (med ulik tetthet og plassering). Vi har dermed
kunne teste ut ulike metoder for utlegging av indekslinjer, og sett på hvilke endringer
i bestandsstørrelse som fanges opp med ulike tettheter og plassering av linjer. Dette
har vi igjen brukt til å utvikle en instruks for bruk av indekslinjer for overvåking av
gaupebestander.
Nedenfor beskrives i korte trekk metodikk og resultater av disse datasimuleringene.
En mer detaljert beskrivelse av analysene og resultatene er gitt i artikkelen ”An
evaluation of structured snow-track surveys to monitor Eurasian lynx
Lynx lynx
populations” (Linnell m. fl., vedlegg).
Materiale og metode
Data på forflytning hos radiomerkede gauper ble samlet inn i de sentrale deler av
Hedmark fra 1995 til 2001. I studieområdet på 10 173 km
2ble det plassert ut et tenkt
nettverk av indekslinjer innenfor et GIS-system. Indekslinjene ble plassert ut på 2
måter. Først brukte vi vår egen erfaring fra vårt arbeid med gauper til å plassere ut
linjer som vi mente økte sjansene for å finne gaupe (heretter kalt ”plasserte linjer”). I
de fleste tilfellene ville dette si fra dalbunn og rett opp lia, gjerne i tilknytning til bratte
åser vi erfaringsmessig viste ofte ble brukt som dagleier for gaupa. Linjene ble satt til
å være 3 km lange i luftlinje mellom start og sluttpunkt, noe som erfaringsmessig er
lik den lengden man kan forvente å få frivillige mannskaper til å gå i bratt og ulendt
terreng. Totalt ble 264 linjer plassert ut innenfor studieområdet, noe som tilsvarer en
tetthet på 1 linje per 38 km
2. I tillegg ble så 259 3-km linjer (1 per 39 km
2) plassert ut
tilfeldig (tilfeldig plassering og orientering, men uten overlapp) utover hele
studieområdet (heretter kalt ”tilfeldige linjer”).
Vi benyttet data på forflytningen til 31 ulike gauper på vinterstid (november-mars).
Gaupene ble i hovedsak lokalisert på dagleiet, og gaupenes forflytning ble satt lik en
rett linje mellom dagleiene. På denne måten lagde vi 4 ulike datasett som skulle
reflektere antall netter mellom siste snøfall og en tenkt registreringsdag. De fire
datasettene tilsvarte forflytning (sporløype) i henholdsvis 1, 2, 3 og 5 netter siden
Bruk av indekslinjer i overvåking av gaupebestander (2007)
2
snøfall. For hver forflytning beregnet vi så hvor mange av indekslinjene gaupene
hadde krysset.
Et av målene var å beregne hvilket oppsett av linjer som er best i stand til å fange
opp gauper. Dette ble gjort ved å beregne sannsynligheten for at en sporløype
krysset minst en indekslinje. Beregningene ble gjort med tilfeldige og plasserte linjer
for ulike netter etter snøfall (1, 2, 3 og 5), og for ulike tettheter av indekslinjer (100%,
75%, 50% og 25% av original tetthet).
Videre testet vi sannsynligheter for at sporindeksen fanger opp en reduksjon i
gaupebestanden mellom 2 registreringer. Vi antok en startbestand på 30 gauper
innenfor studieområdet. Vi simulerte så en potensiell reduksjon i bestanden ved å ta
ut et gitt antall individer (med tilbakelegging), og kjøre gjentatte simuleringer av hvor
mange linjer som hadde kryssende spor. Simuleringene ble gjort 1000 ganger.
Indekslinjene skal gås over mange år. Vi testet derfor også hvordan et
takseringsoppsett er i stand til å oppdage trender i bestanden over flere år.
Resultater av simuleringene
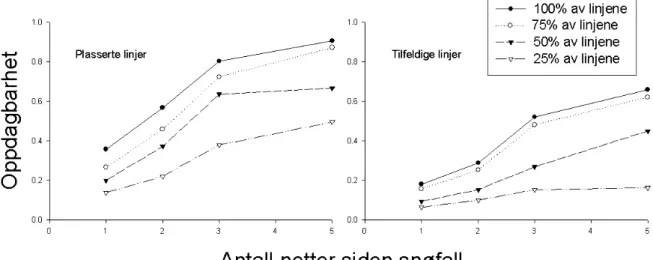
Sannsynlighet for å oppdage gauper var betraktelig høyere med nettverket av
plasserte linjer sammenlignet med de tilfeldige linjene. Sjansen for å oppdage
gauper økte også med antall netter etter snøfall (figur 1), og minsket etter som antall
linjer minsket. Resultatene viser at det vil være en 80 % sjanse for å oppdage en
gaupe hvis man foretar registreringene på 3 netter gammel sporsnø og med en
linjetetthet på 1 linje per 38 km
2.
Figur 1: Sannsynligheten for å oppdage gauper med plasserte linjer og tilfeldige linjer som en funksjon av dager etter snøfall. De ulike linjene i figuren representerer ulike tettheter av indekslinjer med 100 % lik 1 linje per 38 km2.
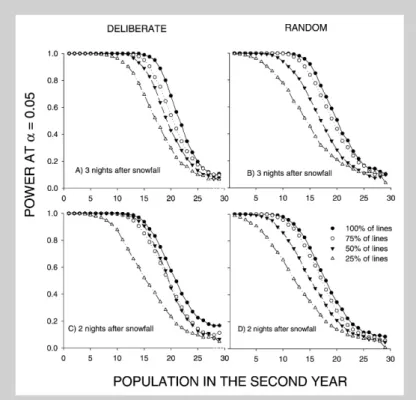
Plasserte linjer oppdaget også nedgang i bestanden bedre enn tilfeldige linjer (figur
2). Sannsynligheten for å oppdage en bestandsnedgang mellom to år økte også med
dager etter snøfall. Simuleringene viste at hvis alle de plasserte linjene (100 %) er
gått 3 dager etter snøfall, så vil man oppdage en bestandsnedgang fra 30 til 19
individer fra et år til et annet i 8 av 10 tilfeller (figur 2a). Hvis linjene er gått 2 dager
Bruk av indekslinjer i overvåking av gaupebestander (2007)
3
etter snøfall vil man oppdage en bestandsnedgang fra 30 til 17 individer fra et år til et
annet i 8 av 10 tilfeller (figur 2c). Vi så videre at sannsynligheten for å oppdage en
bestandsnedgang minsket ettersom antall linjer minsket.
Figur 2: Estimert statistisk styrke til en chi-square test for å oppdage nedgang i en gaupebestand fra et år til et annet som en funksjon av bestandsstørrelse for 2 og 3 dager etter snøfall. Bestanden første år ble satt til 30 individer. Den statistiske styrken er beregnet for plasserte og tilfeldige linjer og for 100 %, 75 %, 50 % og 25 % linjetettheter.
Konklusjon
Resultatet av simuleringene viser at det foreslåtte systemet med indekslinjer vil
kunne være et godt mål på evt. større variasjoner i en gaupebestand mellom
registreringsår. Systemet vil også kunne strukturere og øke antall registreringer av
familiegrupper av gaupe i Norge. Det synes helt klart at indekslinjer bør plasseres ut
slik at de maksimerer sannsynligheten for å oppdage gaupespor, dvs de bør
Bruk av indekslinjer i overvåking av gaupebestander (2007)
4
plasseres der man lokalt forventer at det er størst sjanse for å finne gaupespor.
Simuleringene viser også at en optimal tetthet av linjer ligger på rundt 3 linjer per
kvadratmil, og at en registrering optimalt sett bør skje på minst tre dager gammel
snø hvis dette er mulig.
•
3 km lange linjer (3 km i luftlinje fra start- til sluttpunkt).
•
3 linjer per 100 km
2.
•
Linjene legges ut av personer med god lokalkunnskap, på en slik måte at de
maksimaliserer sannsynligheten for kryssing av gaupespor.
•
Optimalt takseres linjene etter 3 netter siden siste snøfall.
•
De samme linjene takseres hvert år.
An evaluation of structured snow-track surveys to monitor Eurasian
lynx
Lynx lynx
populations
John D.C. Linnell, Peder Fiske, Ivar Herfindal, John Odden, Henrik Brøseth & Reidar Andersen
Linnell, J.D.C., Fiske, P., Herfindal, I., Odden, J., Brøseth, H. & Ander-sen, R. 2007: An evaluation of structured snow-track surveys to monitor Eurasian lynxLynx lynxpopulations. - Wildl. Biol. 13: 456-466. Counts of tracks that passively accumulate on a suitable substrate are commonly used to derive indices of large carnivore abundance. In this study we evaluate the suitability of a similar survey using multiple 3-km long transect-lines to detect changes in population size for Eurasian lynx
Lynx lynx in central Norway. We used GIS methods to simulate the crossing of transect lines by lynx using real telemetry data from the study area. We compared the effect of transect-line placement (deliberate vs random), transect-line density, and the number of nights over which tracks can accumulate in the snow. For each scenario we evaluated both the probability of detecting lynx that are present in the survey area, and the power of the index to detect changes between consecutive surveys. Deliberately placed lines performed significantly better than randomly placed lines, and as expected, increases in line density and the period of track accumulation improved the outcome. Using three nights of track accumulation and the highest density of deliberately placed lines that we simulated (1/38 km2) indicated that both the probability of detecting in-dividual lynx present within the survey area, and the power to detect a 33%change in population size between two surveys, were.80%.
Key words:Eurasian lynx, large carnivore, Lynx lynx, monitoring, popula-tion indices, snow-tracking
John D.C. Linnell, Peder Fiske, John Odden & Henrik Brøseth, Norwegian Institute for Nature Research, Tungasletta 2, N7485 Trondheim, Norway -e-mail addresses: [email protected] (John D.C. Linnell); peder.fiske@ nina.no (Peder Fiske); [email protected] (John Odden); henrik.broseth@ nina.no (Henrik Brøseth)
Ivar Herfindal & Reidar Andersen, Department of Biology, Norwegian University of Science and Technology, N-7491 Trondheim, Norway - e-mail addresses: [email protected] (Ivar Herfindal); reidar.andersen@ vm.ntnu.no (Reidar Andersen)
Corresponding author: John D.C. Linnell
Received 26 March 2004, accepted 10 September 2007 Associate Editor: Urs Breitenmoser
Monitoring large carnivore populations is always a challenging task for researchers and managers, as conflicts over population size and conservation sta-tus often arise (Blanco & Corte´s 2002). Low
densi-ties and cryptic habits make direct enumeration or statistical estimates of population size logistically difficult, and economically prohibitive, to obtain from large areas on a regular basis. As a result many
studies have moved away from direct sampling methods (where the carnivores are counted) to in-direct sampling methods (where scats, tracks and other signs are counted) that are usually used to gen-erate indices of carnivore activity or abundance (Thompson et al. 1998). While attractants are often used to generate density indices for medium and small carnivores (Zielinski & Stauffer 1996), surveys for larger carnivores are often based on searching networks of transects for tracks or other signs (Smallwood & Fitzhugh 1995, Beier & Cunningham 1996, Clevenger & Purroy 1996, Stander 1998, Edwards et al. 2000, Wilson & Delahay 2001, Choate et al. 2006). Recent evaluations have revealed that these line-intercept indices are relatively useful as they correlate well with real density (Stander 1998), but few studies have calculated the power of the sur-vey to detect population changes (e.g. Beier & Cun-ningham 1996, Clevenger & Purroy 1996). Further-more, the applicability of a given method to a given species will likely depend on the density and move-ment patterns of the species in question as well as the habitat configuration of the study area. There is, therefore, a need to shape the sampling intensity and design to the specific circumstances.
The Eurasian lynxLynx lynxis a large carnivore species found throughout Eurasia. In Norway, lynx are heavily harvested, partly to limit depredation on livestock and partly to provide hunter opportu-nities (Pedersen et al. 1999, Odden et al. 2002). As there are no wilderness areas or other unhunted refuges left in Norway that could serve to buffer overharvest (Linnell et al. 2001), there is a need for high-quality data on population size and trend to set annual hunting quotas.
The main monitoring method for lynx in Norway is a minimum count of family groups (adult females with dependent kittens) based on separating obser-vations of tracks in the snow from each other using a set of distance rules (Andre´n et al. 2002, Linnell et al. 2007). Although minimum counts may be accept-able for many purposes (Knight et al. 1995), it was considered desirable to supplement the monitoring with an independent index that might offer a better foundation for statistical tests of trend and be inde-pendent of reproduction. As track counts have been used for ecologically similar cougarsFelis concolor
and leopardsPanthera pardus(Smallwood & Fitz-hugh 1995, Stander 1998, Choate et al. 2006) we wanted to evaluate the potential of using a network of transects along which lynx tracks (in the snow) are recorded.
Our general approach was to use a Geographic Information System (GIS) to simulate the crossing of simulated transects lines (with different densi-ties and placement) by the actual movements of lynx derived from telemetry data from lynx in the study area. More specifically we had the following objectives: 1) to determine how the distribution pattern of transects would affect the power to de-tect changes between two surveys, 2) to determine how different densities of transects would affect the power to detect changes between two surveys, 3) to calculate the probability of the design to detect the presence of individual lynx present in the area, and 4) to evaluate the power of the sys-tem to detect trends in population size over time based on annual surveys. As tracks accumulate with time, we repeated the simulations using sev-eral track accumulation periods (i.e. number of nights since last snowfall). Finally, we compared the simulated results with those obtained from large-scale one-day censuses conducted by the local wildlife management agency using volunteer hun-ters in the study area using similar methodology.
Study area
Movement data were collected in the central part of the county of Hedmark in south-central Nor-way (61u30'N) during 1995-2001. Lynx were cap-tured for radio-collaring using a combination of snares placed at kills, walk-through box-traps, darting from helicopters, treeing using trained dogs and implanting in neonates (Nybakk et al. 1996, Arnemo et al. 1999). The habitat has been described in detail elsewhere (Linnell et al. 2001), but basically consists of intensively exploited boreal forest habitat, with some few patches of agricultural land dispersed along valley bottoms. The topography consists of north-south orientated valleys separated from each other by hills. The altitude varies between 200 and 900 m a.s.l. Lynx have very large home ranges in the region (500-1,500 km2) probably because their main prey, roe deerCapreolus capreolus, occur at very low densi-ties and are confined to valley bottoms and artifi-cial feeding sites during winter (Linnell et al. 2001, Herfindal et al. 2005), however, they still main-tained a territorial social system similar to other lynx populations. In this region snow is the only substrate likely to record tracks as the soil does not record tracks on roads and trails during the snow-free season.
Methods
Placement of simulated transects
The 10,173-km2study area was defined by the outer limits of the composite home ranges of the radio-collared lynx plus a buffer of 5 km. This area rep-resented a saturated mosaic of neighbouring terri-tories, with all lynx radio-collared. Within this area we defined a network of virtual transects within a GIS layer of our study area, placed in two differ-ent manners. First, we used our own experience from working with lynx to place transects in a man-ner that maximises the probability of a lynx cross-ing a transect if it is passcross-ing through the area. In most cases these'deliberate'lines stretched from the valley bottom up the side of the valleys, as lynx generally travel along valleys, or where associated with steep terrain that lynx favour for day beds. The lines were placed in such a manner as to provide a fairly regular distribution of lines throughout the whole study area. We set the standard length to be 3 km as this stretches from the valley bottom to an altitude higher than that normally used by lynx during winter, and corresponds with the max-imum length of transect which it is reasonable to expect volunteers to ski. A total of 264 lines were placed within the study area for a density of 1/38 km2. Secondly, we scattered 259 3-km transects (1/39 km2) using a random point function (random placement and orientation, but without overlap) throughout the same study area at the same density.
Lynx movement and transect intercepts
For the purposes of our analysis, we only used movement data from winter (November-March) as this corresponds to the season when snow is most likely to be on the ground. Data were collected from 31 individual lynx during the study period. Lynx were mainly located during day time when they were inactive, i.e. in their day beds. We created four different data sets, designed to reflect the effect of the number of nights since snowfall during which tracks could accumulate. The one-night set con-tained all observations where lynx were located on consecutive days (1,378 movements for 31 lynx). The sets of two, three and five nights consisted of all sequences where lynx were located daily for three, four and six days, respectively (951 move-ments for 29 lynx, 810 movemove-ments for 27 lynx and 598 movements for 24 lynx, respectively). On nights when lynx did not move, we added a circle of 500-m radius to simulate movement between a day bed
and a kill. This distance corresponds to the area around a kill in which most movements occur (Øv-rum 2000). Data from all types of lynx that were present in the area were included in our analysis, thus including adults and subadults (yearlings) of both sexes. Sex ratio was approximately even, al-though it varied somewhat for the different accu-mulation periods. Dependent kittens were not in-cluded in our analysis.
For each night’s movement we calculated how often each lynx crossed each virtual transect. By representing these movements as linear (as the crow flies) we will underestimate the actual distance trav-elled by lynx during their night-time travels. We partly allowed for this by buffering all lynx move-ments with 100 m on each side. Furthermore, be-cause of the very large home ranges and long move-ment distances of lynx in our study area, the dif-ference between straight-line distance travelled and actual distance travelled is likely to be less than that found in other studies (Je˛drzejewska et al. 2002). We simply regarded each transect as being crossed or not, in line with Beier & Cunningham (1996).
Computation of detection probabilities
To check how well the survey designs were able to detect the presence of lynx in the study area we computed the probability of a track crossing at least one census line if a lynx was present. In the calcu-lation, each observation (the number of lines crossed by each lynx during the one, two, three or five night track accumulation periods) was given the value one if the lynx had crossed at least one line and the value zero if the lynx had crossed no lines. Detection probabilities was computed for both sampling strategies (random and deliberate), for different number of days since the last snowfall (one, two, three and five), and for different densities of sampling lines (100, 75, 50 and 25%of original density).
Because the number of tracking sequences varied greatly among individuals (1-129 one-day periods, 0-45 two-day periods, 0-28 three-day periods, and 0-14 five-day periods) the computation of detection probabilities could be biased by the behaviour of certain individuals with many observations, and thus would not be representative of the lynx popu-lation in the study area as a whole. To avoid such bias we computed the detection probabilities as a two-step process. First, we computed the detec-tion probability for each individual as the
tion of sequences where it had crossed at least one line. Then we computed the mean of those propor-tions as an estimate of the detection probability in the population. An individual was included in these com-putations if at least five sequences were available.
Detection probability was expected to increase with increasing number of days since last snowfall (see Results). Practical considerations (snowfall dis-tribution and availability of personnel) suggest that performing censuses two to three nights after snow-fall is the most likely scenario. We therefore per-formed our simulations of different sampling strat-egies for two and three nights after snowfall only.
Detecting differences in track-count index between two periods
We assumed a starting population of 30 lynx in the study area (representing 0.3 individuals 100 km-2, which corresponds to our estimates based on having all animals radio-collared within the study area). Because this is close to a saturated lynx population in the study area, we only simulated potential re-ductions in the population. The index that we used was the number of lines crossed by at least one track during the period. We tested the change in popula-tion from year one to year two using ax2-test of the number of lines crossed by at least one lynx track. The simulations were performed as follows: 1) From the available lynx we drew randomly
with replacement N individuals, N represent-ing the simulated population size (30 in year one, 1-29 in year two).
2) For each individual, we drew one tracking se-quence from the available tracking sese-quences of that individual and the number of lines the lynx had crossed was counted.
3) In each year, the number of lines crossed by all lynx from the simulated population was summed.
4) The sums were tested with ax2-test.
5) Steps 1-4 were repeated 1,000 times and the number of significant test at a 5 0.05 was counted.
6) The power was computed as number of signif-icant tests divided by 1,000.
Trends - detection of a long-term population decline
If the censuses are performed across many years the results could be used to detect if there are any long-term trends occurring in the lynx populations.
Be-cause we assume that populations at present are close to saturation in the study area, we concentrated on detecting declines in populations over time. In these simulations we make the assumption that population decline is linear without any year-to-year variation. This is an unrealistic assumption, and any violations of that assumption are likely to reduce the power of the test. However, this simplification makes the simu-lations more tractable and the results should give an illustration of the maximal power one could expect with the present design. This power simulation was only performed for two days after snowfall with 100%of the census lines. To simplify the interpreta-tion of the power data we present them as decline from a starting population of 30 lynx that could be detected with a power of 0.8 ataof 0.05 for each time period from eight to 20 years. The simulations were performed as follows:
1) The number of years in the census period was set to seven.
2) The number of lynx in the starting popula-tions was set to 30.
3) The number of lynx in the final population was set to 15 (half the original population). 4) For each of the years in the census period a
population size was computed as a linear de-cline from 30 to 15 over the period. Popula-tion size was rounded to the nearest integer number (N).
5) From the available lynx movement paths we drew randomly with replacement N individu-als, N representing the simulated population size in that year.
6) For each individual we drew one tracking se-quence from the available sese-quences, overlaid this with the transect placement layer, and counted the number of lines the lynx had crossed. 7) In each of the years from the start to the end of the census period the number of lines crossed by all lynx from the simulated population were summed. 8) The sums over the period were tested for a
trend with linear regression.
9) Steps 1-8 were repeated 500 times, and the number of significant test ata(two tailed) 5
0.05 was counted.
10) Power was computed as the number of signifi-cant tests divided by 500.
11) If the power was.0.8 the final population size was increased, and if the power was , 0.8 the final population size was decreased and
steps 1-10 were repeated until the power was 0.8.
12) The number of years of the census period was increased with one and steps 2-11 were repeated until the length of the census period was 20.
Field trials
In January 1999 and January 2001 the local wildlife management agency organised two large field sur-veys that covered partly overlapping areas of Hed-mark including our study area (Odden et al. 2000, 2001). These surveys were based around a deliberate line distribution (similar to our deliberate lines used in the simulation, but in this case they were placed by local experts), with each transect 3 km in length. Each survey involved hundreds of volunteers, mainly local lynx hunters. For each survey we cal-culated: 1) the proportion of radio-collared lynx present within the sample area that were detected, 2) the proportion of index lines that contained lynx tracks, and 3) the ability of volunteers to make the correct species identification for lynx tracks. In ad-dition to the 3-km transects, many of the volunteers continued further along unstructured routes, and
chance observations from the public on the same day were also recorded. Although these additional data could not be used in evaluating a track-count index they could be used to increase the chance of detecting lynx presence.
Results
Detection probabilities
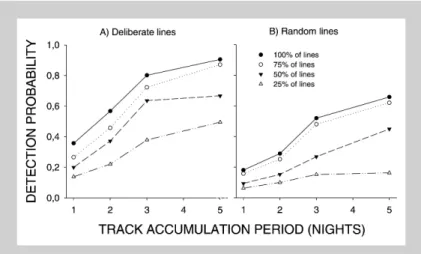
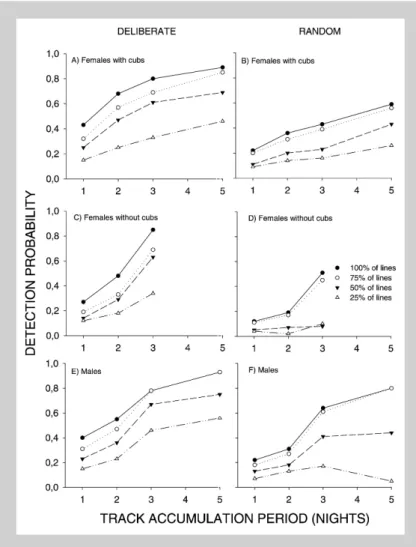
The probability of detecting a lynx that was present was significantly higher on a network of deliberate lines than for random lines for all track accumula-tion periods (Table 1). Detecaccumula-tion probability in-creased with increasing length of accumulation pe-riod (Figs. 1 and 2), and decreased as the number of census lines were decreased (see Figs. 1 and 2). Fe-males with kittens and Fe-males appeared to have a higher detection probability than females without kittens (see Fig. 2), however, the difference among groups was difficult to test in a satisfactory manner. With deliberate lines and 100%of the census lines we estimate that we are able to detect the presence of lynx in 80% of cases if the census is performed three nights after snowfall (see Fig. 1). If the num-Table 1. Detection probability computed for 100%of deliberate and random census lines for different track accumulation periods. The differences in detectability of individual lynx between the two census strategies was tested using a Wilcoxon pairwise test. A lynx was included in the computation of detectability, and in the test, if.5 observation sequences were available for the individual.
Nights since snowfall
Detectability of census lines
---Number of lynx z (Wilcoxon) P(Wilcoxon) Deliberate Random
1 0.35 0.17 29 4.31 ,0.001
2 0.57 0.30 21 3.92 ,0.001
3 0.80 0.52 11 2.67 0.008
5 0.91 0.68 8 2.37 0.018
Figure 1. Estimates of the probability of detecting lynx for deliberate (A) and ran-dom line (B) census strategies as a function of days (1-5) after snowfall. The different lines in the figure represent different densi-ties of census lines with 100%representing 1 line / 38 km2. Detection probability is mean of the detection probability for individual lynx. For each day after snowfall lynx was included in the computation if data were available for$5 periods.
ber of census lines is reduced to 75%, the presence of a lynx is estimated to be detected in 72%of cases with census three nights after snowfall, and if the density of census lines is reduced to 25%we esti-mate that a lynx will be detected in only 38% of cases (see Fig. 1).
Changes between two surveys
Lines chosen deliberately performed better at de-tecting population declines than lines chosen at ran-dom (Fig. 3). The ranking of the sampling regimes was similar across the various accumulation peri-ods. From our simulations it appears that power increases with days after snowfall. However, during a five-day period it is increasingly likely that more snow will fall, and furthermore it is difficult to have personnel that can perform census exactly five days after snowfall. Therefore the results for one, two and three night accumulation periods are probably most representative of conditions that will be met
when performing lynx censuses in the field. The simulations indicate that if all lines (100%) are cen-sused three nights after snowfall, we will detect a de-cline from 30 to 19 individuals from one year to the next in eight out of 10 times (see Fig. 3A). If the lines are censused two nights after snowfall, the number detected will decline from 30 to 17 individ-uals eight out of 10 times (see Fig. 3C). Deliberate lines gave higher power than random lines for both three (Fig. 3A vs Fig. 3B) and two night (Fig. 3C vs Fig. 3D) track accumulation periods. Power de-creased as the census line density dede-creased (see Fig. 3). For example, a reduction from 30 to 20 individuals will be detected in 69% of cases for three-night periods with 100%of the lines, in 54% of cases with 75%of the lines, in 43%of cases with 50%of the lines, and in only 30%of cases with 25% of the lines (see Fig. 3A). The apparently similar performance of 75 and 50% of the lines in Fig-ure 3C is probably a result of the selection of lines Figure 2. Estimates of the probability of detecting lynx for deliberate (A, C, E) and random line (B, D, F) census strategies as a function of days after snowfall. The dif-ferent lines in the figure represent difdif-ferent densities of census lines with 100% repre-senting 1 line / 38 km2. Detection
probabil-ity is mean of the detection probabilprobabil-ity for individual lynx. For each day after snowfall lynx was included in the computation if da-ta were available for$5 periods. Data are presented for females with kittens (A, B), females without kittens (C, D) and males (E, F).
(see Methods), and should not be interpreted as if 50 and 75%of the lines are equally good for detect-ing population declines.
Trends - detection of a population decline
The largest final population size that a decline could be detected for (i.e. the smallest detectable reduc-tion) at a power of 0.8 increased from five individ-uals (a decline from 30 to five) at seven years to 13 individuals (a decline from 30 to 13) at 20 years (Fig. 4). These results are simulated under the as-sumptions that the decline is linear, and can there-fore be tested with a linear regression, and that all deliberate lines are sampled two days after snowfall each year. These results means that over a period of 20 years a decline from 30 to 13 individuals will give a significant (at a 5 0.05) negative regression in eight out of 10 cases.
Field trials
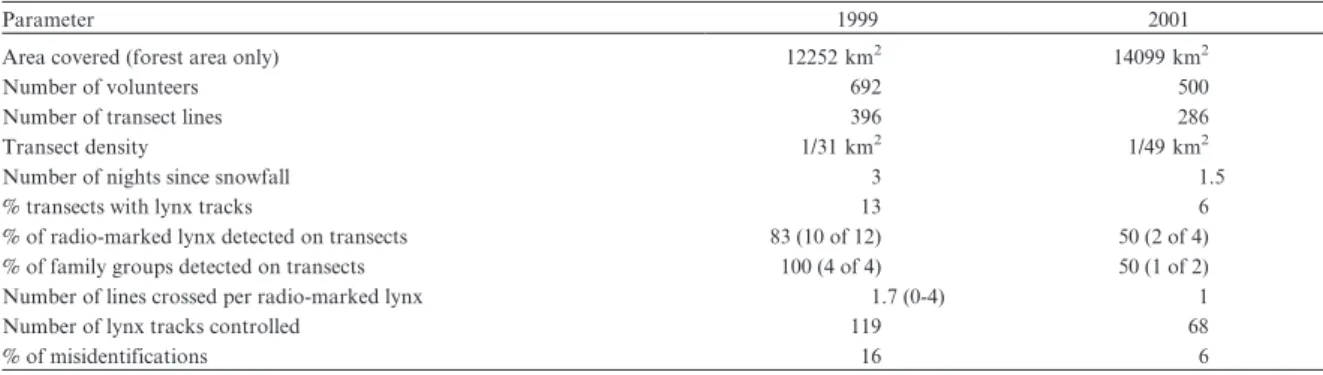
Details of the two surveys are presented in Table 2. Based on checking . 90% of the reports of lynx tracks, the data show that the majority of volun-teers were able to correctly identify lynx tracks, al-though there is room for improvement through ed-ucation and training. The species which caused con-fusion where wolverine Gulo gulo, red fox Vulpes
vulpes, mountain hareLepus timidus, and domestic dogCanis familiaris. In the 2001 survey, one more of the radio-marked lynx was detected by a member of the public who was only indirectly connected with the census, bringing the overall detectability to two of two for family groups and three of four overall.
Discussion
The results of both the simulations and the field trials demonstrate that the proposed system for monitoring lynx has potential both in theory and in practice. For both two and three nights of track accumulation on the most successful design (i.e. de-liberate lines) and with 75 or 100%of transects there was a . 80% power to detect a reduction of the population from 30 to 20, i.e. a 33%reduction from one survey to another in our simulations. This pow-er is somewhat strongpow-er than that estimated from similar studies on cougars (Beier & Cunningham 1996). The results, however, do agree with most similar evaluations of track-count methodology in that only large-scale changes in population size (25-50%) will be detectable (Kendall et al. 1992, Van Sickle & Lindzey 1992, Beier & Cunningham 1996, Figure 3. Estimated power of ax2-test ata5
0.05 to detect declines in the lynx popula-tion from one year to the next as a funcpopula-tion of population size in the second year for three (A, B) and two (C, D) days after snow-fall. The population in the first year was held constant at 30 individuals. The power is presented for deliberate (A, C) and ran-dom lines (B, D) and for 100, 75, 50 and 25%line densities.
Choate et al. 2006). As expected from statistical first principles the power of the survey design to detect changes between two surveys was far higher than its ability to detect trends over time. However, as lynx are hunted intensively (20-30%of population per year), and quotas are set annually based on updated census data (Linnell et al. 2007) it is unlikely that there will ever be a period of.10 years over which a constant decline can be expected (without being corrected), making this scenario unlikely in Nor-way, although it may apply in other situations.
Secondary, but equally important, products of these snow-track surveys are the collection of rec-ords of lynx family groups. While, the snow-track index may be a useful and statistically robust indi-cator of population trend, it is the minimum num-ber of family groups recorded in a region that is
used to set a realistic annual quota (Andre´n et al. 2002, Linnell et al. 2007). However, in any monitor-ing system that depends on records from the public, there is the problem of being able to control for survey effort. Variable survey effort and reporting frequency will lead to uncontrolled variation in re-sults (Mattson 1997). One effect that is common in large carnivore surveys is that the public are much more likely to report observations in the first years after lynx colonisation, but as observations become routine they are less likely to report them. It is there-fore highly desirable to secure at least some mini-mum search effort as a constant, and the results of our simulations and field trials indicate that even a single structured snow-track survey has a high probability of detecting family groups that are pres-ent.
The simulations of both power to detect trends and the detectability of individual lynx indicate that the reduction of survey intensity from 100%of the transect lines to 75%did not have dramatic effects on the results. This sample intensity corresponds to between 15 and 20 transect lines per family group home range. Reduction to 50%of the line density led to a clear reduction in survey effectiveness. The better results obtained from the use of deliberate lines versus random lines lies in the lower occur-rence of zero values in the deliberate lines as they are placed in areas where the chances of their being crossed by lynx are greater. Based on similar obser-vations from bears Ursus arctos, tigers Panthera tigris and cougars (Smallwood & Fitzhugh 1995, Clevenger & Purroy 1996, Carbone et al. 2001) it should be regarded as standard practice to selective-ly place transects to maximise encounters (Wilson & Delahay 2001). In addition, in rough terrain ran-dom lines are likely to be impossible to survey due to risks of avalanche or the presence of cliffs.
Table 2. Details of two field surveys conducted in the county of Hedmark in 1999 and 2001.
Parameter 1999 2001
Area covered (forest area only) 12252 km2
14099 km2
Number of volunteers 692 500
Number of transect lines 396 286
Transect density 1/31 km2 1/49 km2
Number of nights since snowfall 3 1.5
%transects with lynx tracks 13 6
%of radio-marked lynx detected on transects 83 (10 of 12) 50 (2 of 4) %of family groups detected on transects 100 (4 of 4) 50 (1 of 2) Number of lines crossed per radio-marked lynx 1.7 (0-4) 1 Number of lynx tracks controlled 119 68
%of misidentifications 16 6
Figure 4. Ability to detect a linear decrease in population size with a power of 0.8 expressed as the maximum population size (reflecting minimum change) to which an initial population of 30 must decrease in order to detect change for different time series lengths (years of survey). The simulations were performed under the assumption that all deliberate lines were sampled two days after snowfall in each year of the survey.
In some other track surveys an attempt has been made to score the number of individuals respon-sible for making tracks on each transect. These ef-forts are fraught with difficulty (Edwards et al. 2000, Wilson & Delahay 2001), so like Beier & Cun-ningham (1996) we opted to operate on a presence/ absence scoring. Snow is also a very labile medium such that track size and shape can vary through melting or differences in snow consistency making it hard to use measurements to separate between age classes and individuals (Smirnov & Miquelle 1996, Grigione et al. 1999). In addition, there is very little age or sexual dimorphism in lynx tracks (J.D.C. Linnell, unpubl. data). Snow does compen-sate in that as long as it has full coverage and con-ditions have been stable, there is a far better chance (near 100%) of any lynx that cross the transect leav-ing tracks than for other media such as sand or dust (Smallwood & Fitzhugh 1995, Stander 1998, Ed-wards et al. 2000).
It is important to remember that our results were obtained from a population that was basically a sat-urated mosaic of lynx territories. Application to a lower density population, or to one with more holes in the mosaic would require a higher sampling intensity to obtain similar power. If this methodol-ogy was applied to another population with shorter nightly movement rates, there would need to be an increase in transect density such that the same ratio of transects to nightly movement distance was main-tained. Furthermore, lynx movements are closely linked to whether they have a kill or not (Je˛drze-jewska et al. 2002). This implies that inter-popula-tion variainter-popula-tion in kill rate will greatly affect move-ment pattern and therefore lynx detectability. As the home ranges, and resultant movements in our study area are the largest ever documented for the species (Linnell et al. 2001, 2007) it is most likely that other study areas will contain lynx populations that have smaller home ranges and shorter move-ments (e.g. Je˛drzejewska et al. 2002, Linnell et al. 2007). Finally, the difference between the deliberate and random lines is clearly a product of the topog-raphy of the study area. The high snowfall in the region concentrated the lynx’s main prey, roe deer, into the valley bottoms, thus shaping the movement patterns of lynx. In a less rugged landscape, with a more uniform distribution of prey, the difference between the two designs would probably be far less (e.g. Stander 1998). Because of these inter-popula-tion differences in home-range size, movement rate and movement pattern in the landscape any
at-tempts to use indices to compare population densi-ty in different areas or extrapolate from index to absolute density (Danilov et al. 1996) must be ap-proached with caution.
In terms of practical application of this method-ology to large-scale surveys it is vital to recruit vol-unteers if the process is to be cost effective. In Fen-noscandia, hunters are regularly incorporated into wildlife monitoring systems for ungulates (Solberg & Sæther 1999) and small game (Linde´n et al. 1996) as well as large carnivores (Liberg & Glo¨rsen 1995). Given the proper organisation, it should be possi-ble, at least in Norway, to establish a tradition of hunter involvement in annual repeats of this struc-tured survey as was done during the two field trials (Odden et al. 2000, 2001). Given that there is some misidentification of tracks, there is clearly a need for further education and field controls of reported tracks. Snow conditions are rarely identical over very large areas, so a greater degree of regional flex-ibility in timing will make implementation even more practical. In principle, there is no need for widespread regional synchrony in survey timing, although it would make sense if as large blocks as possible were surveyed at the same time. Using local people in the survey can also help reduce some of the discussions and conflicts that constantly arise concerning the size or trend of a population of a controversial species (Skogen 2003).
The cost efficiency of this system could be further enhanced through the collection of data on other species. In our field trials, tracks from wolvesCanis lupusand wolverines were detected. As both these species occur at very low densities in our study site (Landa et al. 1998, Wabakken et al. 2001) any ob-servations of their presence are vital in mapping distributional changes. The possibility of collecting data for other wildlife species also needs to be con-sidered (Linde´n et al. 1996).
In conclusion, the results of our simulation in-dicate that a structured snow-track survey can pro-vide both a relatively effective index to monitor large changes in total population size and act as a minimum survey effort to detect tracks of family groups for annual minimum counts, given that a suitably large number of volunteers can be en-couraged to take part. However, it is important to not overestimate the method’s power. As all single methods associated with monitoring large carni-vores are generally associated with relatively poor precision and accuracy we consider that both mu-tually supportive methods should be used in
tion to other data, such as trends in livestock dep-redation and age, sex structure of harvested lynx should also be considered when adjusting annual hunting quotas. These results for lynx should have broad application to large carnivores moving in a landscape where a suitable track substrate occurs.
Acknowledgements- the data collection and analyses were funded by the Directorate for Nature Management, the Norwegian Research Council and the county gover-nor’s office in the county of Hedmark. We are grateful to the many volunteers and field workers who assisted in capturing and radio-tracking lynx, and to P. Wabakken, E. Maartmann, H. Haagenrud, O. Lundqvist, H.O. Sol-berg and the members of the Hedmark Hunter’s and An-gler’s Association for assistance with the field trials.
References
Andre´n, H., Linnell, J.D.C., Liberg, O., Ahlqvist, P., An-dersen, R., Danell, A., Franze´n, R., Kvam, T., Odden, J. & Segerstro¨m, P. 2002: Estimating total lynx (Lynx lynx) population size from censuses of family groups. - Wildlife Biology 8: 299-306.
Arnemo, J., Linnell, J.D.C., Wedul, S.J., Ranheim, B., Odden, J. & Andersen, R. 1999: Use of intraperitoneal radio-transmitters in lynx Lynx lynx kittens: anaesthe-sia, surgery and behaviour. - Wildlife Biology 5: 245-250.
Beier, P. & Cunningham, S.C. 1996: Power of track sur-veys to detect changes in cougar populations. - Wildlife Society Bulletin 24: 540-546.
Blanco, J.C. & Corte´s, Y. 2002: Ecologı´a, censos, percepcio´n y evolucio´n del lobos en Espan˜a: ana´lisis de un conflicto. - Sociedad Espan˜ola para la Conserva-cio´n y Estudio de los Mamı´feros (SECEM), Ma´laga, Spain, 176 pp. (In Spanish).
Carbone, C., Christie, S., Conforti, K., Coulson, T., Franklin, N., Ginsberg, J., Griffiths, M., Holden, J., Kawanishi, K., Kinnaird, M., Laidlaw, R., Lynam, A., Macdonald, D.W., Martyr, D., McDougal, C., Nath, L., O’Brien, T., Seidensticker, J., Smith, D.J.L., Sun-quist, M., Tilson, R. & Wan Shahruddin, W.N. 2001: The use of photographic rates to estimate densities of tigers and other cryptic mammals. - Animal Conserva-tion 4: 75-80.
Choate, D.C., Wolfe, M.L. & Stoner, D.C. 2006: Evalu-ation of cougar populEvalu-ation estimators in Utah. - Wild-life Society Bulletin 34: 782-799.
Clevenger, A.P. & Purroy, F.J. 1996: Sign surveys for estimating trend of a remnant brown bear Ursus arctos population in northern Spain. - Wildlife Biology 2: 275-281.
Danilov, P., Helle, P., Annenkov, V., Belkin, V., Bljud-nik, L., Helle, E., Kanshiev, V., Linde´n, H. &
Mar-kovsky, V. 1996: Status of game animal populations in Karelia and Finland according to winter track count data. - Finnish Game Research 49: 18-25.
Edwards, G.P., de Preu, N.D., Shakeshaft, B.J. & Crealy, I.V. 2000: An evaluation of two methods of assessing feral cat and dingo abundance in central Australia. - Wildlife Research 27: 143-149.
Grigione, M.M., Burman, P., Bleich, V.C. & Pierce, B.M. 1999: Identifying individual mountain lions Felis con-color by their tracks: refinement of an innovative tech-nique. - Biological Conservation 88: 25-32.
Herfindal, I., Linnell, J.D.C., Odden, J., Nilsen, E.B. & Andersen, R. 2005: Prey density, environmental pro-ductivity, and home range size in the Eurasian lynx (Lynx lynx). - Journal of Zoology (London) 265: 63-71. Je˛drzejewska, W., Schmidt, K., Okarma, H. & Kowal-czyk, R. 2002: Movement pattern and home range use by the Eurasian lynx in Białowiez_a Primeval Forest (Poland). - Annales Zoologica Fennici 39: 29-41. Kendall, K.C., Metzgar, L.H., Patterson, D.A. & Steele,
B.M. 1992: Power of sign surveys to monitor popula-tion trends. - Ecological Applicapopula-tions 2: 422-430. Knight, R.R., Blanchard, B.M. & Eberhardt, L.L. 1995:
Appraising status of the Yellowstone grizzly bear pop-ulation by counting females with cubs-of-the-year. - Wildlife Society Bulletin 23: 245-248.
Landa, A., Tufto, J., Franze´n, R., Bø, T., Linde´n, M. & Swenson, J.E. 1998: Active wolverine Gulo gulo dens as a minimum population estimator in Scandinavia. - Wildlife Biology 4: 159-168.
Liberg, O. & Glo¨rsen, G. 1995: Lodjurs - och varginven-teringar 1993-1995. - Viltforskningsrapporter fra Sven-ska Ja¨garefo¨rbundets, pp. 1-30. (In Swedish). Linde´n, H., Helle, E., Helle, P. & Wikman, M. 1996:
Wildlife triangle scheme in Finland: methods and aims for monitoring wildlife populations. - Finnish Game Research 49: 4-11.
Linnell, J.D.C., Andersen, R., Kvam, T., Andre´n, H., Liberg, O., Odden, J. & Moa, P. 2001: Home range size and choice of management strategy for lynx in Scandi-navia. - Environmental Management 27: 869-879. Linnell, J.D.C., Odden, J., Andre´n, H., Liberg, O.,
An-dersen, R., Moa, P., Kvam, T., Brøseth, H., Seger-stro¨m, P., Ahlqvist, P., Schmidt, K., Je˛drzejewski, W. & Okarma, H. 2007: Distance rules for minimum counts of Eurasian lynx Lynx lynx family groups under different ecological conditions. - Wildlife Biology 13: 447-455.
Mattson, D.J. 1997: Sustainable grizzly bear mortality cal-culated from counts of females with cubs-of-the-year: an evaluation. - Biological Conservation 81: 103-111. Nybakk, K., Kjørstad, M., Overskaug, K., Kvam, T.,
Linnell, J.D.C., Andersen, R. & Berntsen, F. 1996: Ex-periences with live-capture and radio-collaring of lynx Lynx lynx in Norway. - Fauna Norvegica 17A: 17-26. Odden, J., Linnell, J.D.C., Moa, P.F., Herfindal, I., Kvam, T. & Andersen, R. 2002: Lynx depredation on
domestic sheep in Norway. - Journal of Wildlife Man-agement 66: 98-105.
Odden, J., Solvang, H., Maartmann, E., Wabakken, P., Linnell, J.D.C., Andersen, R., Haagenrud, H., Lunqvist, O. & Solberg, H.O. 2000: Registrering av gaupe og ulv i Hedmark 1999. - Fylkesmannen i Hedmark Miljø-vernavdelingen Rapport 1/2000, 45 pp. (In Norwegian). Odden, J., Solvang, H., Maartmann, E., Wabakken, P., Linnell, J., Andersen, R., Haagenrud, H., Lundqvist, O. & Solberg, H.O. 2001: Registrering av ulv og gaupe i Hedmark 2001: Rapport fra registrering 13. januar 2001. - Fylkesmannen i Hedmark Miljøvernav-delingen Rapport 11/2001, pp. 1-26. (In Norwegian). Øvrum, L. 2000: At the scene of the crime; lynx handling
of prey in Hedmark. - M.Sc. thesis, Norwegian Uni-versity for Science and Technology, Trondheim, Nor-way, 34 pp.
Pedersen, V., Linnell, J.D.C., Andersen, R., Andre´n, H., Segerstro¨m, P. & Linde´n, M. 1999: Winter lynx Lynx lynx predation on semi-domestic reindeer Rangifer ta-randus in northern Sweden. - Wildlife Biology 5: 203-212.
Skogen, K. 2003: Adapting adaptive management to a cultural understanding of land use conflicts. - Society and Natural Resources 16: 435-450.
Smallwood, K.S. & Fitzhugh, E.L. 1995: A track count for estimating mountain lion Felis concolor californica pop-ulation trend. - Biological Conservation 71: 251-259.
Smirnov, E.N. & Miquelle, D.G. 1996: Population dy-namics of the Amur tiger (Panthera tigris altaica) in Sikote-Alin state biosphere reserve, Russia. - Journal of Wildlife Research 1: 233-239.
Solberg, E.J. & Sæther, B-E. 1999: Hunter observations of moose Alces alces as a management tool. - Wildlife Biology 5: 107-117.
Stander, P.E. 1998: Spoor counts as indices of large car-nivore populations: the relationship between spoor fre-quency, sampling effort and true density. - Journal of Applied Ecology 35: 378-385.
Thompson, W.L., White, G.C. & Gowan, C. 1998: Mon-itoring vertebrate populations. Academic Press, Inc., London, 365 pp.
Van Sickle, W.D. & Lindzey, F.G. 1992: Evaluation of road track surveys for cougars (Felis concolor). - Great Basin Naturalist 52: 232-236.
Wabakken, P., Sand, H., Liberg, O. & Bja¨rvall, A. 2001: The recovery, distribution, and population dynamics of wolves on the Scandinavian peninsula, 1978-1998. - Canadian Journal of Zoology 79: 710-725.
Wilson, G.J. & Delahay, R.J. 2001: A review of methods to estimate the abundance of terrestrial carnivores us-ing field signs and observation. - Wildlife Research 28: 151-164.
Zielinski, W.J. & Stauffer, H.B. 1996: Monitoring Martes populations in California: survey design and power analysis. - Ecological Applications 6: 1254-1267.