San Jose State University
SJSU ScholarWorks
Master's Projects
Master's Theses and Graduate Research
2008
Bibliography Data Mining and Data Visualization
Deepthi Pullannagari
San Jose State UniversityFollow this and additional works at:
https://scholarworks.sjsu.edu/etd_projects
Part of the
Computer Sciences Commons
This Master's Project is brought to you for free and open access by the Master's Theses and Graduate Research at SJSU ScholarWorks. It has been accepted for inclusion in Master's Projects by an authorized administrator of SJSU ScholarWorks. For more information, please contact
Recommended Citation
Pullannagari, Deepthi, "Bibliography Data Mining and Data Visualization" (2008).Master's Projects. 107. DOI: https://doi.org/10.31979/etd.m2qs-fr6g
BIBLIOGRAPHY DATA MINING AND DATA VISUALIZATION
A Project Report
Presented to
The Faculty of the Department of Computer Science
San Jose State University
In Partial Fulfillment
Of the Requirements for the Degree
Master of Computer Science
By
Deepthi Pullannagari
May 2008
©
2008
Deepthi Pullannagari
ALL RIGHTS RESERVED
Approved by: Department of Computer Science
College of Science
San José State University
San José, CA
_____________________________________________________________
Dr. Soon Tee Teoh
_____________________________________________________________
Dr. Mark Stamp
_____________________________________________________________
Dr. Robert Chun
ACKNOWLEDGEMENTS
I take this opportunity to thank Dr. Soon Tee Teoh for his valuable guidance, encouragement
and patience throughout this project. I would also like to thank Dr. Robert Chun and Dr. Mark
Stamp for consenting to be on my committee and for their valuable feedback and suggestions.
Finally I would like to thank my cousin Prashant Kumar, who provided me with valuable
suggestions and tips when I hit a road block during the course of the project.
Thanks to my husband for his patience and support throughout the project without which this
project would not have been possible
ABSTRACT
BIBLIOGRAPHY DATA MINING AND DATA VISUALIZATION
By Deepthi Pullannagari
Data mining is a concept of discovering meaningful patterns from large data
repositories, and Data visualization is a graphical representation of data using shapes, colors
and images for a better conceptualization. These two techniques have been in use for a long
time now and are used together in number of fields to gain a better perception of the data.
Bibliographic data is widely used in academic and scientific literature fields and this
project deals with data mining and data visualization of bibliographic data downloaded from
Citeseer Citation Indexing system.
The downloaded metadata is extracted into the database, looking for patterns in the
data. The extracted data is then queried for the search string and presented to the user using
interactive visualization where the user can navigate through the records for better
conceptualization of the data. The data is further color coded to define the importance of each
record extracted.
TABLE OF CONTENTS
1. INTRODUCTION………....1
2. DATA MINING………2
2.1 What is Data mining? ...2
2.2 History………..2
2.3 Steps in Data mining………..4
3. DATA VISUALIZATION………..5
3.1 What is Data Visualization? ...5
3.2 History………...5
3.3 Data Visualization Techniques……….7
4. CITESEER………...10
4.1 About Citeseer………...10
4.2 How Citeseer works………...11
4.3 Future of Citeseer………...14
5. STANDARDS USED BY CITESEER………..15
5.1 OAI-PMH (Open Archives initiative protocol for Metadata harvesting)……...15
5.1.1 Record Repository Configuration……….16
5.2 Dublin Core Metadata Standard……….17
5.3 Example of Citeseer record using the standards set forth by OAI & Dublin
Core………..18
6.2 Software Used………...28
6.2.1 Servlet………..29
6.2.2 Java Server Pages (JSP)……….30
6.2.3 Apache Tomcat………...30
6.2.4 Microsoft SQL Server 2005………31
6.3 Implementation Details……….31
6.3.1 Data Repository ………..31
6.3.2 Program Flow………..33
7. CONCLUSION……….38
8. FUTURE WORK………..38
REFERENCES………..40
APPENDIX A –Source Code………42
LIST OF FIGURES
Figure 1: Steps taken in Data Mining………..5
Figure 2: History of Data visualization………6
Figure 3: Visual presentation of News by Newsmap Application……….9
Figure 4: Visual display of books by Amaztype………10
Figure 5: Citation in different format………13
Figure 6: Citeseer Record………...20
Figure 7: Citeseer Record Header……….21
Figure 8: Namespace Declarations and Schema location………21
Figure 9: Citeseer References tag………..23
Figure 10: Screen displaying the results in textual format……….25
Figure 11: Screen displaying the details of the record in textual format………..26
Figure 12: Visual display of the record and its references (Paper centric view)……..27
Figure 13: Visual display of the author and his/her publications(Author Centric
view)……….28
Figure 14: Relation between a servlet, browser and the servlet engine……….30
Figure 15: Architecture of Data query from the database………..34
LIST OF TABLES
1. INTRODUCTION
Data mining is the process of extracting data from large datasets and can be applied to
any form of data, ranging from transactional data to Metadata. Similarly Data visualization is
the concept of presenting the data visually using shapes, colors and images for a better
conceptualization and can be used for data, processes, relations or concepts. Both the
techniques have been in use for a long time now and are still being used largely in various
fields like business, science, academics etc. There are various techniques available for both
data mining and data presentation, but it largely depends on the nature/format of the data that
we are working on.
In this project we dealt with the mining and visualization of Bibliographic data.
Bibliographic data is the details pertaining to articles that are used in creating a document. This
information can further be used to locate the article too. There are many citation indexing
systems available like DBLP, Citeseer, Scientific Citation index (SCI) etc, but for reasons
specific to the project implementation, this project uses Citeseer Citation indexing System.
The goal of this project is to enhance current bibliography web services with an
intuitive interactive visualization interface and to improve user understanding and
conceptualization. The project uses the downloadable records available as XML files from the
Citeseer database, extracts the data into the database and then queries the database for the
results. The same data is then presented visually to allow the user to conceptualize the results
in a better way and help him/her find the articles of interest with utmost ease. In addition the
user can interactively navigate the visual results to get more information about any of the
article or the author displayed.
Section 2, Section 3 and Section 4 of this report provides an overview of the Data
mining, Data visualization and Citeseer Citation Indexing system including the history,
techniques used etc respectively. Section 5 gives an overview of the Open archives initiative
protocol and Dublin core; the standards for presenting the data that would be used for
harvesting and used by Citeseer. Section 6 explains the implementation details of the project
such as the technology used the data flow, architectural diagrams etc and Section 7 presents the
conclusion and Section 8 lists the possible future enhancements.
2. DATA MINING
2.1 What is Data mining?
Data mining is the process of extracting relevant information from large databases and
repositories. Data mining is used in almost every field ranging from business intelligence, and
financial analysis to scientific and medicinal fields. Though the technology is the same in every
field, the definition varies slightly depending upon the nature of the data that is mined. While it
is described as "the nontrivial extraction of implicit, previously unknown, and potentially
useful information from data" and "the science of extracting useful information from large
databases
" i
n the field of science, it is “statistical and logical analysis of large sets of
transaction data looking for patterns that can aid decision making” when it comes to Enterprise
resource planning [8]. Data mining is often referred to as Knowledge discovery in databases.
While some treat both the terms as synonyms others treat data mining only as a part of
Knowledge discovery in databases (KDD).
2.2 History
Though the term is relatively new, introduced only in 1990’s [9], the technique has been
in use for a long time now. Traditionally, data mining has been performed by analysts who
looked for patterns and trends in the data sets, but the ever increasing size of the databases in
business and science made it impossible for humans to manage the data and this has seen a
considerable shift from traditional human parsing to automatic parsing of the data. Today there
are various sophisticated tools and software that are available to extract the useful patterns
from the large datasets.
Data mining has it roots along three family lines [9] all of which have played a significant
role in the advent of data mining. They are
1. Classical statistics
2. Artificial intelligence
3. Machine learning
Statistics are the roots of most of technologies that form the building blocks for data
mining. Classical statistics include concepts such as regression analysis, standard distribution,
standard deviation and so on, all of which are used to analyze the data and its relationships.
The classical statistical analysis plays an important role in many of the data mining tools [9].
Second in the line is Artificial intelligence. As against statistics, AI is based on
heuristics, which applies human-thought like processing to statistical problems. This approach
requires high computer processing and wasn’t in much use until the era where compute power
was available at a much reasonable price [9].
The third is the machine learning, a union of both Classical statistics and artificial
intelligence. Machine learning is considered to be an evolution of AI, since it combines AI
heuristics with statistical analysis. This approach lets the programs to learn about the data that
they process, and make decisions based upon the data using statistics and advanced heuristics
and algorithms [9].
Thus data mining can be best described as a union of historic and recent developments in
the fields of statistics, AI and machine learning.
2.3 Steps in data mining
Typical data mining includes the following steps performed in succession [10].
1. Extracting the Data
2. Cleansing the extracted data
3. Modeling the data
4. Applying the data mining algorithm
5. Pattern discovery
6. Data visualization
In short data mining includes extracting the raw data from the repositories, cleansing it
and loading it into the database. The data loaded into the database is analyzed for patterns and
a best model or algorithm is chosen to parse the desired patterns. But again the steps vary
depending upon the nature of the data dealt with. Further the data is presented visually to
1 explains the same.
Figure 1: Steps taken in data mining [10]
3. DATA VISUALIZATION
3.1 What is Data Visualization?
The science of using images to represent the data or presenting the data in graphical form
in order to enable the viewer to perceive it in a better way is termed as data visualization. There
is a variety of conventional ways to view data such as bar graphs, pie charts, histograms, table
etc. Whatever be the method chosen, the aim is to make sense of the data and communicate the
details to the viewer. With the aid of visualization, understanding or perceiving the data and
relationships between data is made much simpler .Situations where the user had to browse
through large number of web pages or text to get an understanding of data can be presented
using visualization in as less as a single page.
3.2 History
Like data mining, data visualization is also not a new concept and has been in use since
first known table was created in 2
ndcentury in Egypt to organize astronomical data. Although a
table is a predominantly a textual representation of data, the horizontal and vertical rules used
to arrange the data into columns and rows have rendered them to be more than a textual
representation. The representation of the data in 2 dimensional space using x and y axis arose
only in 17
thcentury. Rene Descartes, A French philosopher has invented graphs for
mathematical calculations, which were eventually used for data representations [11].
Figure 2: History of Data Visualization [11]
However, it was not until late 18
thand early 19
thcenturies that many of the graphs that
we use today, including bar charts and pie diagrams came into use. A century later, when the
importance of these techniques had been realized, the study of graphics had been made a part
of academic curriculum and the first graphics course was introduced in Iowa state university in
1913. In 1977, the statistics professor John Tukey of Princeton developed a visual approach
known as exploratory data analysis to analyze the data and he is the first person who
data. In 1983, Edward Tufte published his wonderful book “The visual Display of Quantitative
Information” which exposed us to a number of ways of presenting the data visually. Exactly a
year later, in 1984 Apple computer released their most popular computer that used graphics for
interaction and display. This has lead to the advent of using graphics and data visualization
techniques that we interact with using a computer. Ever since the release of this affordable
computer a research has been started in the academic world, with the name of “Information
visualization” and was later published in 1999 as “Readings in Information Visualization:
Using vision to think” [11].
In addition to these notable milestones in the field of data visualization, there were
many other events that triggered the usage of visualization for presenting the data. In parallel
the advancement in computer science has introduced many new techniques which made life
easy for people using visualization as a means of communicating the data. One such event is
the introduction of IBM PC. Before personal computer were common in the workplace,
persons who needed to present the data using graphs and pie diagrams in the meetings were
faced with labor intensive tasks ,which would consume hours of their time in drawing. But
with introduction of PC and the powerful software like spreadsheet everything changed and
now with just a click of mouse, the host of data can be represented using graphs. Thus Data
visualization that started ever since 2
ndcentury has been seeing improvement in its use and
today it forms an integral part of business, medical and academic fields. There are many new
tools available for visualization and many new are still coming up [11].
3.3 Data visualization techniques
There are many techniques available for representing the data graphically and some of
the most common ones are [5]
1. Charts which includes pie diagrams and bars
2. Graphs which are good for comparisons and establishing relationships.
3. Maps which are one of the most effective ways of visualization. One of the best examples
would be Google maps and Google earth which presents the user with a picture of route and
locations making it easy to perceive things.
4. 3-D surfaces used for presenting multi-dimensional data.
5. Images which use color and intensity to represent the data and relationships
6. Animation and so on.
Data visualization is not just presenting the data using pie charts and histograms, but
depending upon the circumstances in order to convey a message effectively to the viewer, it
has to be elegant and descriptive. There are certain applications where data visualization is
made user interactive where one can tour the data by varying the views, zoom the data by
clicking on it using the mouse, panning to explore the neighborhoods and so on. One such
application is Newsmap that visually shows the changing landscape of Google News
aggregator. The size of the data blocks is defined by the popularity of the news at that given
moment. The greater the popularity the larger is the size. Newsmap makes use of the Treemap
algorithm which is a space constrained visualization of information. Given below is the Figure
3 that shows the news at one particular moment [12].
Figure 3: Visual presentation of News by Newsmap Application [24]
Another application is Amaztype which lets you search for the books online. It pulls the
data from Amazon and presents it in the form of keyword that we searched for. For example
say the user has searched for CSS, the search result is provided as shown in the Figure 4. To
get more information about the book one has to click on the book. Another application
Flickrtime uses a similar technology too. It uses the Flickr API to display the uploaded images
in the form of a clock that displays current time.
Figure 4: Visual display of books by Amaztype [24]
However though we have to appreciate the technology behind these techniques, the
motive might not have been achieved. Data visualization is meant to provide the viewer with a
better understanding of the information and to perceive information faster than when provided
in the text format. But in the case of both Amaztype and Flickrtime, the information is too
cluttered and viewer could hardly realize what he/she is looking at until he clicks on the image
for a larger view. Thus one should take into account all these facts when attempting to present
the data using visualization.
4. CITESEER
4.1 About Citeseer
Citeseer is an autonomous citation indexing system that indexes scientific and academic
literature [2]. It is autonomous, since it doesn’t require any manual effort for indexing as other
traditional (manually constructed) indexing systems such as DBLP citation indexes. Citeseer
searches for and indexes the articles as soon as they are available on the web thus providing
access to the most recent papers too.
Citeseer was created in 1997, by the researchers Steve Lawrence, Lee Giles, and Kurt
Bollacker at the NEC Research Institute, Princeton, New Jersey. It is hosted on the World
Wide Web at Pennsylvania State University, the college of Information sciences and
Technology. Since then the project has been led by Lee Giles. Currently Citeseer has more then
750,000 documents, predominantly related to the fields of Computer and Information
Technology and Engineering [15].
Citeseer provides the Open archives initiative metadata of all the documents available
freely on the web or submitted directly to the Citeseer database. Being a non-profit service, the
goal of Citeseer is to improve access to the scientific and academic literature and it can be used
by almost everyone[15]. Citeseer also makes all its data available to the general public in the
form of downloadable files.
4.2 How Citeseer works?
A citation index indexes the links between the articles that a researcher makes while
citing other articles [2]. These indexes are very useful for a number of purposes such as
navigating back and forth in time, looking for all the previous articles that a particular record
refers to and also the latest articles that refer to this record, help judge the importance of an
article by observing the number of times it is referred to by other articles, help find articles that
are related to a particular record and so on[2]. These citation indexes are highly being used in
various fields which require information retrieval, such as scientific and academic literature,
bibliographic information etc. There are number of free citation indexes available online for
Indexing academic literature and bibliographic information and one such indexing system is
Citeseer.
Citeseer is an autonomous citation indexing system, which means it doesn’t require any
manual effort to index the articles. This has an advantage over the other indexing systems, in
that it provides more up-to-date information and is also cost effective. On the flip side it has a
disadvantage that Citeseer can index the article only if it is available on the web or has been
manually submitted by the author to the Citeseer database [2]. As a result some of the
publications that are not present on the web might not be included in the Citeseer database. In
addition Citeseer only locates articles that are publicly available, but do not crawl the
publishers website. As such articles that are freely available are more likely to find a place in
Citeseer Database [2].
Citeseer uses a combination of web crawler like any other search engine and heuristics
to find the articles and publications available on the World Wide Web. It currently makes use
of web search engines like AltaVista, HotBot, and Excite [2], and looks for pages that contain
the words like publications, papers, postscript etc in the URL. Thus Citeseer identifies and
downloads all the documents with “.ps” , “.ps.Z” and “ps.gz” extensions. These downloaded
papers are then converted to a text format and are validated to make sure that they are indeed
valid research papers by looking at the references and bibliography section. Once it is
confirmed, Citeseer parses the articles and extracts the following information such as
1. The URL of the downloaded paper,
2.
the Author and the Title information,
3.
Abstract and introduction if they exist.
4. The list of reference or citations made by the document, which are in turn parsed again
to find other articles.
5. Citation context or the Citation tag which is the context in which the document makes
the citation is also extracted [2].
Once this information is available, Citeseer identifies the set of references and sorts out
the independent references. These references are again parsed using heuristics for author name,
article name, year of publication, citation tag, page numbers etc. The Citation tag is the
information that is used to cite the article in the body of the document such as “[2]”, “[Lee98]”
etc[2]. This information is used to extract the context of the citation.
Citeseer also has the ability to identify the citations in different format that refer to the
same article. For example consider the citation given in Figure 5, where all three refer to the
same article [2].
Figure 5: Citation in different formats [2]
Even though each citation differs from the other significantly Citeseer can still identify
that they all refer to the same article. This ability not only helps it to avoid duplicating the
records in the database but also helps it to estimate the importance an article by looking at the
number of times it has been referred to, even though it has been cited in different formats.
Since Citeseer is an autonomous system and since not all the articles or publications are
formatted in the same way, there may be situations where some of the fields like author name,
year of the publication even though they are present might not be extracted by the parser or in
case they are extracted since it is autonomous, not all the extracted data may be free of errors.
Even in such situations, a second citation that refers to the same article would be advantageous,
since the chances of error can be reduced.
below. Citeseer provides two different formats of OAI records that can be downloaded for
general use by the public. They are
1. oai_dc.tar.gz which contains the records built using the Dublin core metadata standard
[23]
2. oai_Citeseer.tar.gz which includes the same records as in the previous file built with the
Dublin core metadata standard, but with additional metadata fields, including citation
relationships (References and IsReferencedBy), author affiliations, and author
addresses [23].
This project will use the second format of records as it will be useful for establishing
the relation between various records. There are many other citation indexing systems available
such as DBLP etc which also provide their records in downloadable form the public use, but
the advantage with the Citeseer is that, it assigns each record it indexes with an Identifier
known as Citeseer Identifier and uses this field to identify the number of times this article has
been referenced by the other articles. In short this identifier forms the basis to extract the
“References” and “Referenced By” fields.
4.3 Future of Citeseer
Citeseer has been serving as a public search engine for more than 10 years now and the
original Citeseer database now consists of more than 750,000 records and serves around 1.5
million requests daily. Originally intended as a simple prototype, the response to Citeseer grew
beyond its architectural capabilities. Hence the database which was once up-to-date with all the
citations available online has not been updated regularly since 2005 [15]. Similarly the records
or the data that have been provided for use by the public is up-to-date with all the information
that the Citeseer database consists up to year 2005, but it might be missing some records
starting from 2005. In order to overcome these limitations a newer version of Citeseer known
as the Next Generation Citeseer was developed. This Citation Indexing system provides a more
up-to-date version of the Citeseer Database. But we couldn’t use this Citeseerx for this project,
since they do not yet provide their records for public use.
5. STANDARDS USED BY CITESEER
5.1 OAI-PMH (The Open Archives Initiative Protocol for Metadata Harvesting)
Open Archives Initiative Protocol for Metadata Harvesting, generally referred to as
OAI-PMH provides an application independent framework that can be used for presenting and
harvesting of metadata [4]. OAI-PMH made its origin in July 2001 with the aim of increasing
the efficiency of print/pre-print servers that hosted scientific and technical papers. As the size
of these repositories kept increasing over the years, it became hard to maintain the database
leading to incorrect data and loss of data. Thus evolved OAI-PMH that provided certain
standards that made easy, the maintenance of metadata repositories and presentation of
machine readable metadata to public [18]. There are many applications and citation indexes
that comply with OAI-PMH for presenting their metadata and Citeseer is one such database.
OAI-PMH primarily has two categories of providers namely
1. Data provider that uses the standards set forth by OAI-PMH as a means of presenting their
metadata
2. Service providers that use this metadata as a basis for providing the value added services.
In the context of this project, Citeseer represents the Data provider that follows the OAI norms
of presenting the data and this project is the service provider which uses this metadata for
visualizing the articles and their references. Data providers usually present the metadata as a
large repositories or databases. There are 3 different repository configurations that OAI-PMH
distinguishes and they are
1. Resource configuration
2. Item configuration
3. Record configuration
The Citeseer database uses the “Record repository configuration”. There are other citation
indexes that use the “Resource” and “Item” repository Configurations, but that is out of the
scope of this report.
5.1.1 Record Repository Configuration
In this configuration the data is presented in the form of records where a record is a
metadata expressed in a single format [4]. Each record is an XML encoded byte stream,
identified by the combination of the unique identifier assigned to the record in the repository,
the metadata prefix identifying the metadata format of the record, and the datestamp of the
record[4] . The XML encoding of the records is classified into following parts
1. Header which is further classified into
a) Unique identifier of the record in the repository
b) Date stamp, the latest date that the record has been created or modified.
c) setSpec ,the set membership of the record. .i.e. provides the information as to which set
the record belongs to.
2. Metadata
The OAI supports multiple formats for the metadata of the items. At the least
Citeseer uses both Dublin core format along with its self described format[4]. Details about
Dublin core are presented in the next section.
3. About
About is an optional container to present the data about the metadata. The most
common forms of data presented in this section are
-The rights statements that dictates the terms of use of the metadata or the records that
are made available to the public by the data providers.
- Provenance statements which provides the details as to when and how the
metadata/record has been harvested. [4]
5.2 Dublin Core Metadata Standard
Dublin Core Metadata standards have been set forth by the organization referred to as
“The Dublin Core Metadata Initiative (DCMI)” engaged in the development of online metadata
standards that support a broad range of purposes and business models. Dublin core is generally
used to represent digital data such as text, images, and videos etc using XML based
implementations [17]. As indicated above OAI-PMH requires that the data providers using the
record repository configurations should be able to present the details in their “metadata”
section using Dublin core Standards and Citeseer does just the same.
The Dublin Metadata element set provides a standard set of conventions for describing the
metadata that would be used for harvesting. The Simple Dublin Core Metadata Element Set
(DCMES) consists of 15 metadata elements [17]:
1. Title
2. Creator
3. Subject
4. Description
5. Publisher
6. Contributor
7. Date
8. Type
9. Format
10. Identifier
11. Source
12. Language
13. Relation
14. Coverage
15. Rights
Each Dublin Core element is optional and may be repeated. There is no particular order
in Dublin Core for using the elements. Similarly there is a qualified Dublin core element set
that includes all of the above elements and three additional elements namely Provenance,
Audience and RightsHolder [17]. Citeseer uses the simple Dublin core element set.
5.3 Example of Citeseer record using the standards set forth by OAI and Dublin Core
The Citeseer database makes use of use of both OAI-PMH and Dublin core standards
for exposing the data in its repository. As discussed, Citeseer uses the record configuration of
the repository and includes the first 2 parts namely “header” and “metadata” but ignores the
optional “about” apart. In addition it uses 2 different formats for describing the metadata
section i.e. Dublin core standard and Citeseer’ own standards.
<record> <header> <identifier>oai:CiteseerPSU:2</identifier> <datestamp>1997-11-01</datestamp> <setSpec>CiteseerPSUset</setSpec> </header> <metadata> <oai_Citeseer:oai_Citeseer xmlns:oai_Citeseer="http://copper.ist.psu.edu/oai/oai_Citeseer/" xmlns:dc ="http://purl.org/dc/elements/1.1/" xmlns:xsi="http://www.w3.org/2001/XMLSchema-instance" xsi:schemaLocation="http://copper.ist.psu.edu/oai/oai_Citeseer/ http://copper.ist.psu.edu/oai/oai_Citeseer.xsd ">
<dc:title>The Graham Scan Triangulates Simple Polygons</dc:title> <oai_Citeseer:author name="Xianshu Kong">
</oai_Citeseer:author>
<oai_Citeseer:author name="Hazel Everett"> </oai_Citeseer:author>
<oai_Citeseer:author name="Godfried Toussaint"> </oai_Citeseer:author>
<dc:subject>Xianshu Kong,Hazel Everett,Godfried Toussaint The Graham Scan Triangulates Simple Polygons</dc:subject>
<dc:description>The Graham scan is a fundamental backtracking technique in computational geometry which was originally designed to compute the convex hull of a set of points in the plane and has since found application in several different contexts. In this note we show how to use the Graham scan to triangulate a simple polygon. The resulting algorithm triangulates an n vertex polygon P in O(kn) time where k-1 is the number of concave
2 ), it is easy to implement and is therefore of practical interest. 1. Introduction A polygon P is a closed path of straight line segments. A polygon is represented by a sequence of vertices P = (p 0 ,p 1 ,...,p n-1 ) where p i has real-valued x,y-coordinates. We assume that no three vertices of P are collinear. The line segments (p i ,p i+1 ), 0 i n-1, (subscript arithmetic taken modulo n) are the edges of P. A polygon is simple if no two nonconsecutive edges intersect. A simple polygon part...</dc:description>
<dc:contributor>The Pennsylvania State University Citeseer Archives</dc:contributor> <dc:publisher>unknown</dc:publisher> <dc:date>1997-11-01</dc:date> <oai_Citeseer:pubyear>1991</oai_Citeseer:pubyear> <dc:format>ps</dc:format> <dc:identifier>http://Citeseer.ist.psu.edu/2.html</dc:identifier> <dc:source>http://www-cgrl.cs.mcgill.ca/~godfried/publications/tri.scan.ps.gz</dc:source> <dc:language>en</dc:language> <oai_Citeseer:relation type="References"> <oai_Citeseer:uri>oai:CiteseerPSU:97473</oai_Citeseer:uri> </oai_Citeseer:relation> <oai_Citeseer:relation type="References"> <oai_Citeseer:uri>oai:CiteseerPSU:154288</oai_Citeseer:uri> </oai_Citeseer:relation> <dc:rights>unrestricted</dc:rights> </oai_Citeseer:oai_Citeseer> </metadata> </record>
As seen in the Figure 7 there is a root tag named as <record> which includes both
<header> and <metadata> tags. The header as set by the OAI-PMH standards has 3 different
parts as shown in the Figure 7 below.
<header>
<identifier>oai:CiteseerPSU:2</identifier> <datestamp>1997-11-01</datestamp>
<setSpec>CiteseerPSUset</setSpec> </header>
Figure 7: Citeseer Record Header [23]
Here the contents in the <identifier> tag represent the unique identifier assigned to
each record. This unique identifier is a combination of “oai:CiteseerPSU” and a number
where “oai:CiteseerPSU” is common for every record while the number is unique. Followed by
this are datestamp which indicates the date of record creation, and setSpec which indicates the
set membership. Citeseer uses just one set where all the records belong to the only set
CiteseerPSUset. The tags <header>, <identifier>, <datestamp>, <metadata> etc are all set forth
by the OAI-PMH and any repository following OAI norms cannot change or ignore them.
Coming to the metadata part, it has a single root tag oai_Citeseer:oai_Citeseer required
by OAI-PMH norms, followed by nested tags belonging to the corresponding metadata format
which in this case includes both Dublin core and Citeseer specific format.
The root tag in the metadata part includes a many attributes common to all XML
documents that include namespaces, schemas etc as shown in Figure 8.
<oai_Citeseer:oai_Citeseer
xmlns:oai_Citeseer="http://copper.ist.psu.edu/oai/oai_Citeseer/" xmlns:dc ="http://purl.org/dc/elements/1.1/"
xsi:schemaLocation="http://copper.ist.psu.edu/oai/oai_Citeseer/ http://copper.ist.psu.edu/oai/oai_Citeseer.xsd ">
Figure 8: Namespace Declarations and Schema location [23]
1. Namespace declarations
The declarations of the namespaces used in the metadata part, are prefixed with
xmlns.
These declarations are classified into 2 different parts:
a) Metadata format specific namespace(s) - every metadata part must include one or
more
xmlnsprefixed attributes that define the correspondence between a metadata
format prefix (such as “oai_Citeseer or dc”) and the namespace URI of the respective
metadata format. The repositories using 2 different metadata formats need an entry for
each, prefixed with xlmns. In this example they are xmlns:oai_Citeseer and xmlns:dc
[18].
b) xml schema namespace - every metadata part includes the attribute xmlns:xsi, the value
of which is always a URI shown in the example, which is the namespace URI for XML
schema [18].
c)
Schema Location - Schema Location is usually a combination of URI, URL pair; the
first is the namespace URI of the metadata that follows in this part, and the second is
the URL of the XML schema for validation of the metadata that follows. All the
elements described by the tags of the form <dc:title> ,<dc:publisher> ,<dc:format> etc
are following the standards set by Dublin core Metadata element set [18].
While namespace declarations and schema locations are required by Dublin core
standards, Citeseer added it’s own tags <oai_Citeseer:relation> which follow the standards
employed by the Citeseer itself . It included these tags in order to establish a more meaningful
relationship between its records and this formed the basis for this project. For example
<oai_Citeseer:uri>oai:CiteseerPSU:154288</oai_Citeseer:uri> in the Figure 9 indicates that
Indicates that this record references the record with the identifier 154288 and this property was
highly useful in this project.
<oai_Citeseer:relation type="References">
<oai_Citeseer:uri>oai:CiteseerPSU:154288</oai_Citeseer:uri> </oai_Citeseer:relation>
Figure 9: Citeseer References tag [23]
6. PROJECT DETAILS
6.1 Overview
The Citeseer repository used for this project has 72 dump files containing XML records
or metadata. Each file is around 28KB to 30KB. The first step towards the implementation was
the extraction of the data into the database. Since the metadata was presented in the XML
format that follows OAI-PMH and Dublin core norms, the presence of the tags made parsing of
the data easier. Although there was additional information provided we extracted only those
fields that are relevant to the project. After the database has been populated, every time a query
needs to be processed, the database is accessed and the required result is fetched. Each query
for an Author, keyword or a Title of the paper fetches all the records matching the query and
prints the following information.
1. Title of the paper
2. Authors
5. Time taken to fetch the records
6. Number of records that matched the query and the number printed on the first page.
Every record fetched can be viewed both in the text format and in graphical format. To
view the details in the text format each title/article fetched has been provided as a hyperlink
and clicking on it displays the screen with more details pertaining to the record, like the
complete description, all the papers referencing this article and all the papers referenced by this
article. In every screen, the titles of all the papers are hyperlinked and clicking on them will
provide more information about the paper as shown in Figure 11. Each screen displays the first
10 records and the “next” and “Previous” buttons are provided to navigate through all the
records fetched. Also at every screen there is an option to get back to the main page, from
where you started and a search button on top which allows a new query.
Similarly to view the details in the graphical format, every hyperlinked record is
followed by a link named “paper centric view” clicking on which will display a browser
showing the record/article, keywords, authors, papers referencing the article and papers
referenced by the article in an intuitive focus + context manner, and allow the user to
interactively query related results. For example, by clicking on the title of a paper or the author
of a paper displays the paper centric view of the article or the author centric view of the author.
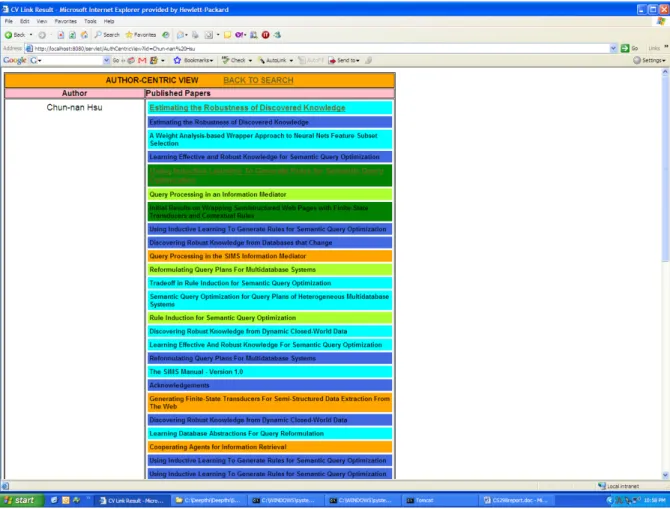
The author centric view displays the author and all the papers the author has contributed for.
Thus the visualization module switches back and forth between the author centric view and the
paper centric view. All the articles are color coded to indicate the number of times it has been
referenced making it easy to visualize the importance of the paper.
Given below are the screen shots to show the results in text format. Figure 10 shows the
screen which displays the result for a particular query and Figure 11 shows the screen that
provides additional information about the record when clicked on it .Similarly Figure 12 and
Figure 13 show Paper centric view and Author centric view respectively.
Figure 12: Visual display of the record and its references (Paper centric view)
Given below is the color coding range used for both the Paper centric view and the author
centric view.
Number of papers the article has been referenced by
color used
0
1 - 5
6-10
11-20
21-40
41-60
61 and above
Figure 13: Visual display of the author and his/her publications (Author Centric view)
6.2 SOFTWARE USED
This section describes the software and the programming languages used for the
implementation
Software
1. jdk1.5
2. Apache Tomcat 5.0
3. MS SQL server 2005
4. Internet Explorer 5.5 or above
Programming Language
1. Java
2. Servlet
3. Java server pages (JSP)
6.2.1 Servlet
A servlet is a java program that runs in a web browser as against an applet that runs in
the client browser. The servlet takes the request from the browser which is typically an HTTP
request, generates the dynamic HTML content and sends the response back to the client as an
HTTP response. The servlet can also be accessed directly from another application and send
the request back to the application. Running in a J2EE environment a Servlet can generate the
response in both HTML and XML format [22].
Servlets provides improved scalability with its ability to support object orientation,
platform independence, security and robustness much similar to that of Java. In addition
servlets are fully integrated with java API’s such JDBC for database connectivity [22].
A Servlet is usually managed by an external container referred to as a servlet engine. It
is this servlet engine that provides the servlet with the services it needs such as the HTTP
request parameters and its headers and so on. The Figure 14 indicates the relation between a
servlet, servlet engine and the web browser [22].
Figure 14: Relation between a servlet, browser and the servlet engine [22]
6.2.2 Java Server Pages (JSP)
Java Server pages is a java based technology developed at Sun Microsystems, that
allows to dynamically generate HTML, XML or any other type of document in response to the
Web client request. JSP as the technology is often referred to, allows developers to embed java
code and other pre-defined actions into the static HTML code [21]. One can jump in and out of
HTML code by adding the starting and ending tags <% & %> where all the JSP
implementation goes in between these tags.
6.2.3 Apache Tomcat
Apache Tomcat is a web container developed at the Apache software Foundation. Also
referred to as an application server, Tomcat includes its own Internal HTTP server and
provides an environment for the java code to run in co-operation with the web server by
implementing the Java servlet specifications and Java server pages specifications from sun
Microsystems [20].
6.2.4 Microsoft SQL Server 2005
Microsoft SQL server is a relational database management system developed by
Microsoft. Transact SQL referred to as T-SQL is its primary query language and is an
implementation of ANSI/ISO standard Structured Query Language used by Microsoft [19].
T-SQL is the primary means of programming and managing the SQL server. It provides
functions to operate and manage the database. Client applications that use the data or manage
the SQL server can communicate with the database by sending the T-SQL statements, which in
turn processes and sends the results back to the client.
This project uses the freely available enterprise version of the software downloaded from the
Microsoft webpage.
6.3. Implementation Details
This project is based on the MVC framework namely the Model, View and the
Controller framework. This framework provides a pattern for organizing presentation logic
(View), business logic (control) and the data objects (model) into three different modules. The
model usually refers to the data objects/database, while the presentation part of the project is
handled by the views which in this case are the JSP’s, the Servlet’s act as the controller
between the model and the view by managing the flow. Section 6.3.1 gives the details of the
model/data repository and section 6.3.2 explains the details of both the views and the
controllers used in the project.
6.3.1 Data Repository
The metadata downloaded from the Citeseer website is extracted and stored in the local
database created with Microsoft SQL server 2005. The downloaded data contains detailed
information about each record including the author addresses, the rights of the papers,
affiliation, URL and many more. Since all the records are in the XML format, with set of
specified tags, the data extraction was relatively easy. The local database consists of 4 tables
named AuthorDetails, RecordIndex, RecordRef, and RecordTable.
1. The table AuthorDetails contains the details of the authors and has the following fields
-
recordid
-
authorname
-
address
-
affiliation
Each article or record can have more than one author and hence the field recordid is
not unique in this table and can be duplicated any number of times.
2. The table RecordRef contains the fields
-
recordid
-
refid
The field refid is the Citeseer Id of the articles/records that this particular record given
by recordid references. This information is being used when we fetch all the records that a
particular article references to or is being referenced by. Again since each article can have
more than one reference, the field recordid can be duplicated.
3. The table RecordTable contains the fields
-
recordid
-
dateofcreation
-
title
-
subject
-
description
-
publisher
-
pubyear
-
format
-
identifier
-
source
-
language
-
rights
The field “subject” in this table is a combination of both the authors and the title of the article
and it is this field that is looked for while performing the search.
4. The table RecordIndex contains the details of all the records and has the following
columns
-
recordid
-
subject
-
dateofcreation
The table RecordIndex is the index for the database. That is, in this table each article
will have an entry only once. So, whenever the database is queried for the author, title or the
keyword, the RecordIndex table is searched to see if the query matches any of the string in the
“subject” field and that particular recordid is extracted which is then used to search the
Authordetails table for author names, RecordTable for the title and description and RecordRef
table for all the references. Thus the RecordIndex table makes fetching the records much faster
by reducing the number of records that need to be searched.
6.3.2 Program flow
As shown in architecture in Figure 15, the browser acts as an interface to the client which takes
the input and display’s the result, the web server provides the context for handling the
user requests and processing the query and JSP’s handle the presentation layer of the model. In
the context of web server, it is the Servlet that acts as a controller between the JSP’s and the
database.
Figure 15: Architecture of Data Query from the Database
The Figure 16 below describes the interaction between various modules and also the
communication between the Servlets, JSP’s and the database within each module. In this
Figure all the JSP’s are indicated in blue, while the Servlets are indicated in green. Here we
describe each Servlet and the JSP and explain the tasks that it performs.
a. DataQuery
DataQuery a JSP file, acts as an interface to the client accepting the input/request which
is sent to the servlet, Reqhandler.
b. ReqHandler
ReqHandler is a servlet container, which handles the user request, and forwards the
request to ReqSearch servlet.It also handles the search result returned by ReqSearch and
forwards it to the JSP,that is “DisplayResult” for displaying.
Browser
Web Server
Client
Servlets
JSP
Database
c. ReqSearch
ReqSearch, is a servlet which extracts the keywords from the request using the set of
predefined delimiters and prepares the standard search query, executes the search query against
the database and sends the response back to Reqhandler servlet.
d. LinkHandler
LinkHandler is a servlet that is invoked when the hyperlinked article is clicked for more
details. This servlet takes the request from the Reqsearch,which in this case is the “link id” and
provides it to the LinkSearch servlet which processes it and sends the response back to
Linkhandler, which in turn forwards it to the JSP LinkResult for display.
e. LinkSearch
LinkSearch is a servlet which takes the request from the LinkHandler, processes it by
preparing the query to extract the all the records that match the link id of the article clicked
from the tables AuthorDetails, RecordTable and RecordRef tables, and forwards the response
back to it.
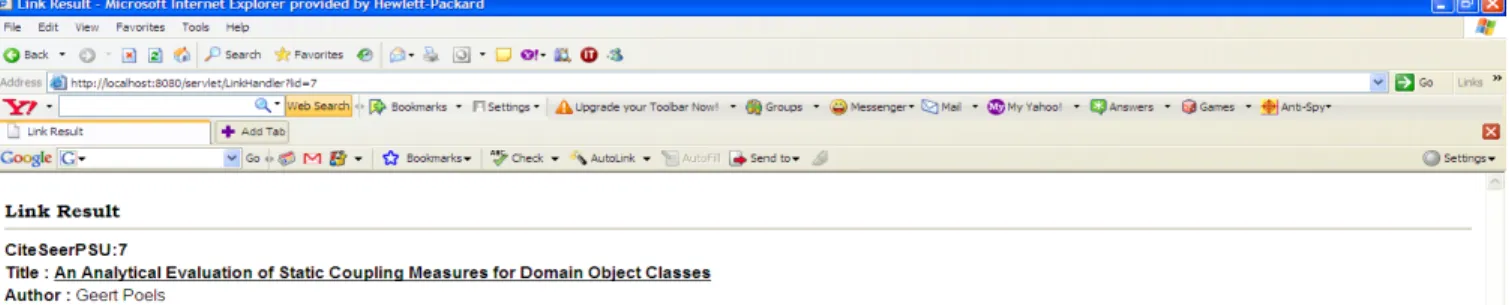
f. LinkResult
LinkResult is a JSP that displays the result forwarded by the servlet LinkHandler.
g. DisplayResult
DisplayResult a JSP , is a Browser/Interface that displays the result forwarded by the
servlet Reqsearch.
h. CentricView
CentricView is a servlet that handles the Data visualization part and is invoked when the
user clicks on the page centric view in the result page. It then sends this request, which in this
case is the linkid , to the servlet CVsearch, which processes it and sends the response back to
CentricView
CVSearch is a Servlet that takes the request from CentricView, prepares the query,
contacts the database and sends the result back to CentricView, which then forwards it to
CVResult for display
j. CVResult
CVResult is a JSP that receives the data from the Servlet CVSearch and displays it
using HTML tables and tags.
Similarly AuthCentricView and AuthCVSearch are the Servlets that are invoked when the
author name is clicked upon and the result is sent to the ACVResult JSP for display.
Figure 16: Application Flow Diagram
1
4
2
5
6
DataQuery.jsp
DisplayResult.jsp
ReqHandler
ReqSearch
Database
3
CVResult.jsp
ACVResult.jsp
CentricView
AuthCentricView
CVSearch
AuthCVSearch
1
2
4
5 (If paper is
clicked)
5 (If the Author is clicked)
6
8
7
9
When page centric
view is clicked
clicked
LinkHandler
LinkSearch
LinkResult.jsp
if hyperlinked
article is clicked
3
4
2
1
Database
Database
3
7. CONCLUSION
Data Mining and Data visualization are two concepts that have been in use since a long
time and are still being used in various areas ranging from business to academics. A lot of
research and thus lot of development has been made in both the fields over the years. While
both the concepts can stand by themselves, they are more advantageous when used together
and that is the essence of this project.
Unlike many other citation indexes that present their data in textual format, this project
presents the data in the visual format. This allows the user to conceptualize more data all at
once than when presented in the textual format. The references and the referenced by fields and
the color coding used, make it easy for the user to learn more about the relationship between
the papers and estimate the importance/quality of the paper he/she is looking at ,thus showing
the importance of visualization when presenting large sets of data.
8. FUTURE WORK
It would be a good future project to work on enhancing the paper centric view and the
author centric views by
1. Providing the users with an opportunity to upload their papers and visualize how they
fit in the paper centric and the author centric views. This could be easy if the user enters
the details of the paper in a pre-designed form, but if he/she uploads the paper itself it
might not be a trivial task, since it would require an intelligent parser to extract the
required information.
2. Providing the user with more information about the article’s displayed on either views,
with the help of a pop-up box which could contain all the information about the article
such as the authors, number of articles referenced by it and the number of article
referencing them, and if possible the titles of the articles themselves and if available the
URL where they can download the article.
REFERENCES
[1] Z.Shen, M.Ogawa, S.T. Teoh, and K.L. Ma, “BiblioViz: A System for Visualizing
Bibliography Information,” Proceedings of the Asia Pacific Symposium on Information
Visualization, 2006.
Pages 93-102.
[2] C.L.Giles, K.D. Bollacker and S.Lawrence, “Citeseer: An Automatic Citation Indexing
System,” Third ACM Conference on Digital Libraries
,
1998. Pages 89-98.
[3] Citeseer – Scientific Literature Digital Library
http://Citeseer.ist.psu.edu/
[4] Open Archives Initiative –Repository Explorer
http://re.cs.uct.ac.za/
[5] Overview of Data Visualization
http://web.cs.wpi.edu/~matt/courses/cs563/talks/datavis.html
[6] Data Mining
http://www-pub.cise.ufl.edu/~ddd/cap6635/Fall-97/Short-papers/10.htm
[7] Data Mining: What is Data Mining?
http://www.anderson.ucla.edu/faculty/jason.frand/teacher/technologies/palace/datamining.htm
[8]
http://en.wikipedia.org/wiki/Data_mining
[9] A Brief History of Data Mining
http://www.data-mining-software.com/data_mining_history.htm
[10] Data Modeling and Mining
http://www.dwreview.com/Data_mining/DM_models.html
[11] S.Few, “Data visualization past, present and future,” Cognos Innovation Center, 10 Jan
2007.
http://www.perceptualedge.com/articles/Whitepapers/Data_Visualization.pdf
[12]
http://www.marumushi.com/apps/newsmap/
[13]
http://amaztype.tha.jp/
[14] Citeseerx alpha
http://Citeseerx.ist.psu.edu/about/site
[15]
http://en.wikipedia.org/wiki/Citeseer
[16] V.Petricek, I.J. Cox, H.Han, I.G. Councill and C.L Giles, “A Comparison of Online
Computer Science Citation Databases,” The School of Information Sciences and Technology.
http://www.personal.psu.edu/igc2/papers/petricek05comparison.pdf
[17]
http://en.wikipedia.org/wiki/Dublin_Core
[18] S. Amin, “The Open Archives Initiative Protocol for Metadata Harvesting: An
Introduction,” Documentation Research and Training Center.
https://drtc.isibang.ac.in/bitstream/1849/40/2/H_OAIPMH_saiful.pdf
[19]
http://en.wikipedia.org/wiki/Microsoft_SQL_Server
[20]
http://en.wikipedia.org/wiki/Apache_Tomcat
[21]
http://en.wikipedia.org/wiki/JavaServer_Pages
[22] Servlet Overview
http://download.oracle.com/docs/cd/B12166_01/web/B10321_01/overview.htm#1001304
[23] Citeseer Metadata
http://Citeseer.ist.psu.edu/oai.html
[24] Data Visualization – Modern Approaches
APPENDIX A - Source Code
Dataquery.jsp
*********************************************************************
An interface to the user to enter the search string
*********************************************************************************** <html> <title>Data Query</title> <head> <style type=text/css> BODY { background-color=""; background-attachment: fixed; font-size: 9pt;
font-family: "Arial","Courier New"; color: #000000; margin-left: 5; margin-top: 10; } </style> </head>
<body topmargin=0 leftmargin=0 bgcolor=""> <center><br><br><br><br><br><br>
<table border=0>
<tr><td align=center><font size=4 face="Bookman Old Style"><b>Bibliography Data Mining</font><BR><b>
</table>
<hr width="80%">
<%@ page language="java" import="java.util.*" %>
<form name="dqform" method="post" action="/servlet/ReqHandler"> <input type="hidden" name="crpos" value="N_0_0_1_0">
<table border=0> <tr>
<td aling right><b>Enter the Search String : </b></td><td><input type="text" size="60" name="reqsq"> </td>
</tr>
</table><hr width="80%">
<input type="submit" value="Search"> </form> </center> </body> </html>
Displayresult.jsp
*************************************************************************** A JSP that is used to present the results to the user in the text format*************************************************************************** <html>
<title>Result Sheet</title> <style type=text/css> BODY { background-color=""; background-attachment: fixed; font-size: 9pt;
font-family: "Arial","Courier New"; color: #000000; margin-left: 5; margin-top: 10; } </style> <script language="javascript"> function validations(mvbt) { qv=document.dqform.qv.value; pv=document.dqform.pr.value; nt=document.dqform.nt.value; nqv=document.dqform.nqv.value; if(mvbt=="P") { pval=eval(pv)-1; ntval=eval(nt)+1; fmv="P_"+qv+"_"+pval+"_"+ntval+"_"+nqv; } else { pval=eval(pv)+1; ntval=eval(nt)-1; fmv="N_"+nqv+"_"+pval+"_"+ntval+"_"+nqv; } document.dqform.crpos.value=fmv; document.dqform.submit(); } </script> </head>
<body topmargin=0 leftmargin=0>
<%@ page language="java" import="java.util.*" %> <%@ include file="tops.jsp"%>
<%
ArrayList mres=new ArrayList();
String sreq=(String)request.getAttribute("SREQ"); mres=(ArrayList)request.getAttribute("QResult"); String qtime=(String)request.getAttribute("QTime"); String data=""; if((mres.size()-5)>0) { out.println(); String qval=(String)mres.get(mres.size()-4); String prev=(String)mres.get(mres.size()-3); String next=(String)mres.get(mres.size()-2); String nqval=(String)mres.get(mres.size()-1); } %
<td align=right><b>Page :</b><%=(Integer.parseInt(prev)+1)%>of<%=(Integer.parseInt(next)+Integer.parseInt(prev)+1)%> <b>Total Record Count :</b> <%=mres.get(0)%> <b>Query Time : </b><%=qtime%> </b></td> </tr> </table><hr><br> <% int r=0; for(r=1;r<(mres.size()-4);r++) { data=(String)mres.get(r); out.println(data); out.println("<br>"); }%> <br><hr>
<form name="dqform" method="post" action="/servlet/ReqHandler" onSubmit="return validations()"> <input type="hidden" name="qv" value="<%=qval%>">
<input type="hidden" name="pr" value="<%=prev%>"> <input type="hidden" name="nt" value="<%=next%>"> <input type="hidden" name="nqv" value="<%=nqval%>"> <input type="hidden" name="reqsq" value="<%=sreq%>"> <input type="hidden" name="crpos" value="">
<table border=0 width=100%> <% if(prev.equals("0"))
{ %>
<tr><td align=center><input type="button" value="Next" onClick="return validations('N')"></td></tr> <% }
else if(next.equals("0")) { %>
<tr><td align=center><input type="button" value="Previous" onClick="return validations('P')"></td></tr> <% }
else { %>
<tr><td align=center><input type="button" value="Previous" onClick="return validations('P')">
<input type="button" value="Next" onClick="return validations('N')"></td></tr> <% } %> </table> </form> <% } else { %>
<center><font size=3 face="Bookman Old Style"><b>No Result Matched.</b></font></center> <% } %> </center> </body> </html>
CVResult.jsp
************************************************************************* An Interface that presents the Paper centric view in context+focus format to the users ************************************************************************** <html><title>CV Link Result</title> <head>