San Jose State University San Jose State University
SJSU ScholarWorks
SJSU ScholarWorks
Master's Projects Master's Theses and Graduate Research
Fall 12-11-2019
A Hybrid Approach for Multi-document Text Summarization
A Hybrid Approach for Multi-document Text Summarization
Rashmi VarmaFollow this and additional works at: https://scholarworks.sjsu.edu/etd_projects
Part of the Artificial Intelligence and Robotics Commons, and the Databases and Information Systems Commons
A Hybrid Approach for Multi-document Text Summarization
A Project
Presented to
The Faculty of the Department of Computer Science
San Jose State University
In Partial Fulfillment
of the Requirements for the Degree
Master of Science
by
Rashmi Varma
c
○2019
Rashmi Varma
The Designated Project Committee Approves the Project Titled
A Hybrid Approach for Multi-document Text Summarization
by
Rashmi Varma
APPROVED FOR THE DEPARTMENT OF COMPUTER SCIENCE
SAN JOSE STATE UNIVERSITY
December 2019
Dr. Robert Chun Department of Computer Science
Dr. Katerina Potika Department of Computer Science
ABSTRACT
A Hybrid Approach for Multi-document Text Summarization by Rashmi Varma
Text summarization has been a long studied topic in the field of natural
language processing. There have been various approaches for both extractive text
summarization as well as abstractive text summarization. Summarizing texts for a
single document is a methodical task. But summarizing multiple documents poses
as a greater challenge. This thesis explores the application of Latent Semantic
Analysis, Text-Rank, Lex-Rank and Reduction algorithms for single document
text summarization and compares it with the proposed approach of creating a
hybrid system combining each of the above algorithms, individually, with Restricted
Boltzmann Machines for multi-document text summarization and analyzing how all
ACKNOWLEDGMENTS
I would like to express my sincere gratitude to my advisor, Dr. Robert Chun for
his continuous support of my research and for his patience, motivation, enthusiasm,
and immense knowledge. His guidance helped me during the time of research and
writing of this report.
Besides my advisor, I would like to thank the rest of my committee: Dr. Katerina
Potika, and Ms. Manasi Thakur, for their encouragement and insights.
My sincere thanks also goes to Mr. Shyam Namashivayam, for offering me the
summer internship opportunity at Netapp Inc. and brainstorming the topic with me
during my internship.
Lastly, I would like to thank my family: my parents Ravi Varma and Leela
TABLE OF CONTENTS
CHAPTER
1 Introduction . . . 1
2 Types of Summarization . . . 3
2.1 Based on Number of Documents . . . 3
2.2 Based on Implementing Structure . . . 5
2.2.1 Cluster-Based Summarizing . . . 6
2.2.2 Rank-Based Summarizing . . . 8
2.2.3 Knowledge-Based Summarizing . . . 9
2.2.4 Graph-Based Summarizing . . . 11
2.3 Based on Type . . . 13
2.3.1 Abstractive Text Summarization . . . 13
2.3.2 Extractive Text Summarization . . . 15
3 Relevant Approaches . . . 19
3.1 ROUGE . . . 19
3.2 Latent Semantic Analysis . . . 22
3.3 Bag Of Words . . . 23
3.4 Restricted Boltzmann Machine . . . 24
3.5 Text-Rank . . . 27
3.6 Lex-Rank . . . 28
3.7 Reduction Algorithm . . . 28
4.1 Data Sets . . . 30
4.2 Pre-Processing . . . 31
4.2.1 Tokenization . . . 31
4.2.2 Removing Stop Words . . . 31
4.3 Algorithms Implemented . . . 31 4.3.1 Part-of-Speech Tagging . . . 32 4.4 Evaluation . . . 32 4.4.1 Precision . . . 32 4.4.2 Recall . . . 33 4.4.3 F-Measure . . . 33
5 Experiments and Results . . . 34
5.1 Evaluation . . . 34 5.2 Sample Summaries . . . 40 5.2.1 Reduction Summarizer . . . 40 5.2.2 LSA Summarizer . . . 42 5.2.3 Text-Rank Summarization . . . 43 5.2.4 Lex-Rank Summarizer . . . 45 5.2.5 Summary of Results . . . 46
6 Conclusion and Future Work . . . 47
A Single Document Summarization . . . 53
LIST OF TABLES
1 Number of folders in each DUC . . . 30
2 Summary of Results of Experiments . . . 46
3 ROUGE-1 evaluation of single document for DUC2003 Summary 53
4 ROUGE-2 evaluation of single-document DUC2003 Summary . . 53
5 ROUGE-1 evaluation of single document for DUC2004 Summary 53
6 ROUGE-2 evaluation of single-document DUC2004 Summary . . 54
7 ROUGE-1 evaluation of multi - document for DUC2003 Summary 55
8 ROUGE-2 evaluation of multi - document for DUC2003 Summary 55
9 ROUGE-1 evaluation of multi - document for DUC2004 Summary 56
LIST OF FIGURES
1 Single document Summarization . . . 4
2 Multi-document Summarization . . . 5 3 Layers in RBM . . . 24 4 Term Frequency . . . 25 5 Normalized words . . . 25 6 Text-Rank Algorithm . . . 27 7 Architecture Diagram . . . 29
8 F-1 Scores for DUC2003 . . . 35
9 F-1 Scores for DUC2004 . . . 36
10 Precision for DUC2003 . . . 37
11 Precision for DUC2004 . . . 37
12 Recall for DUC2003 . . . 39
13 Recall for DUC2004 . . . 39
14 Example Summary for Reduction Summarizer [37]. . . 41
15 Example Summary for LSA Summarizer [37]. . . 42
16 Example Summary for Text-Rank Summarizer [37]. . . 44
CHAPTER 1 Introduction
Text summarization is the process of shortening text into a concise summary
highlighting the important points conveyed in its parent text. Over the years,
researchers have come up with elegant solutions to summarize texts. The solutions
broadly classify text summarization into two categories: Abstractive summarization
and Extractive text summarization.
Extractive text summarization extracts sentences from the original text to create
the summary. This is usually done using some statistical analysis to count and rank
sentences. The sentences that score high become a part of the summarized subset.
Abstractive text summarization, on the other hand, may not include words from
the parent text. Abstractive summarization understands the language and context
to generate new sentences. The main difference while creating both summarization
tools is that abstractive does not necessarily need pre-written text but it does need a
large amount of training data.
Text summarization in itself is a complex topic. But this project tackles the
problem of summarizing text from multiple documents as well as single documents.
The challenge here is not just to summarize but to find common ground across the
documents. Different approaches to implement both types of summarizations are
implemented and analyzed.
This paper compares different algorithms like Latent Semantic Analysis,
Text-Rank, Lex-Rank and Reduction algorithms for single document text
Machine in combination with LSA and the graph-based approaches for
multi-document summarization and analyzes the differences in the summaries
generated. The evaluation of these generated summaries is done using ROUGE
CHAPTER 2 Types of Summarization
Text Summarization can be classified into various types depending on the
use cases. It can be differentiated based on single or multiple documents, based
on approaches such as graph-based summarization, cluster-based summarization,
rank-based summarization and knowledge-based summarization and can also be based
on the type of summarization done: Exhaustive or Abstractive.
2.1 Based on Number of Documents
Single and multi-documents as the names suggest are summarization done from
the text of a single document versus the texts from a bunch of documents. A lot
of research has been done on summarizing single documents. Multi-document text
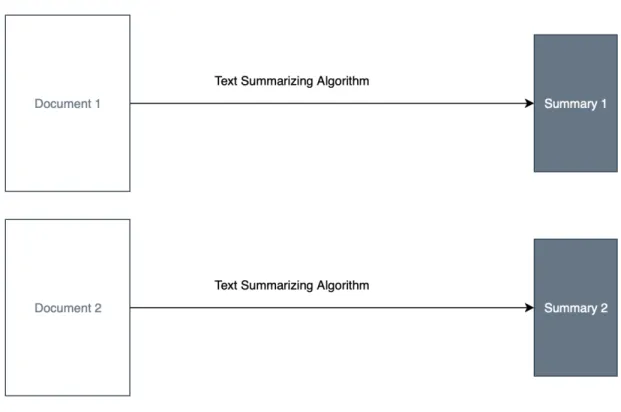
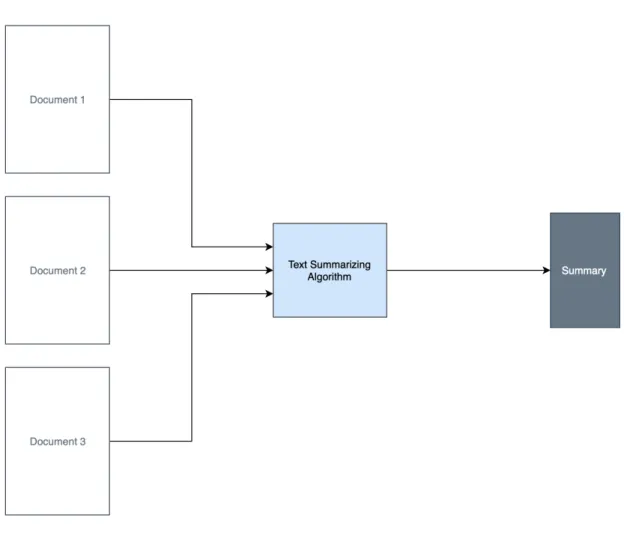
Figure 1: Single document Summarization
Fig. 1 and Fig. 2 explain the structures of single document summarization and
multi-document summarization respectively. In single document text summarization,
texts from a single document or single source of text are summarized. In
multi-document text summarization, multiple documents are collectively summarized
Figure 2: Multi-document Summarization
This paper explores the other two types in depth.
2.2 Based on Implementing Structure
Based on the research done, summarizations are broadly classified into four
techniques: Cluster-Based Summarizing, Rank Based Summarizing, Graph Based
2.2.1 Cluster-Based Summarizing
Treating the input documents with an unsupervised learning algorithm was one
of the earliest ideas implemented in the field of automatic text summarization. In
1995, McKeown and Radev proposed the use of a modified term frequency - inverse
document frequency (TF - IDF) formula to produce clusters of news articles [1]. The
input document was compared to the centroid of the cluster obtained from their
training data set and the cluster to which the new data would belong was found.
The authors implemented this approach during run time by measuring the centroids
using TF-IDF as their feature [1]. A summary can be obtained using this approach
but since the documents are clustered without any processing, redundancy seems to
be a problem with this approach. The output summary could hold a lot of repeating
sentences.
The most popular algorithm, MEAD, derives from McKeown and Radev’s
approach in [1] and builds on it. The authors introduced two new terms in their
approach: cluster-based sentence utility(CBSU) and cross-sentence informational
subsumption (CSIS) for evaluation of single and multi-document summaries [2].
CBSU measured the degree to which the new sentence was similar to the cluster
and was given a rating from 0 to 10 [2]. A lower score indicated that the sentence was
irrelevant to the cluster whereas a higher score meant that the sentence had a close
resemblance to the cluster [2]. CSIS complements CBSU. CSIS is a measure which
worked on the concept that certain sentences are repeated inside a cluster [2]. Such
sentences offer no new value and were therefore needed to be eliminated. The authors
also maintained variables to keep track of the chronology of the articles. The authors
set a threshold for this variable. Clusters where this variable was greater than 2, were
MEAD consist of key words that aren’t just central to a small number of cluster [2].
The authors chose words that were central to all the clusters. The authors then
proposed their own metric for evaluating the summaries to decide its measure and to
eliminate redundancies. This approach is better than the approach mentioned in [1]
as it takes care of the redundancy of sentences.
A sentence clustering approach was proposed in [18] to generate multi-document
summaries. In this approach, single document summaries are combined using the
sentence clustering method to generate a multi document summary [18]. Each
document is first pre-processed, and then features are extracted based on which a
summary is created. Then, the sentences appearing in the individual summaries are
clustered. Each cluster’s sentences are extracted to create a multi-document summary.
The sequence of the sentences is maintained as per the parent document [18]. This
approach follows the principles of [1] and [18] and also adds the constraint of coherency
to it.
The semantic similarity between words is combined to get semantic similarity
between sentences [18]. The authors considered different types of features for Feature
Extraction. Some features mentioned in [18] include:
∙ Document Feature: Weight of the sentences are calculated. Weight of a
sentence comprises of the weight of content-related words that appear in that
document.
∙ Location Feature: The authors gave higher weights to words appearing in the
starting and concluding sentences of the document.
∙ Sentence reference index (SRI) feature: This gives more weight to a
assign weight to a sentence using SRI feature a list of pronouns is maintained.
If a sentence contains a pronoun, then the weight of the preceding sentence is
increased.
∙ Concept similarity feature: It is the number of synsets of query words
matching with words in the sentence. The set of synsets obtained from WordNet
was used to assign concept similarity weight to the sentences.
2.2.2 Rank-Based Summarizing
There are numerous models built to rank sentences or paragraphs to decide on
how to summarize a model. Researchers have developed various ways to pre-process
the data and then score information to create a summary. The evolutionary
optimization algorithm in [4] creates a summary by collecting the relevant sentences
from the multiple documents. It forms collections specific to the parent document to
avoid redundancies.
An approach using Cosine Similarity was developed by Erkan and Radev [9]
where, if the cosine similarity of the documents or the work exceeded the defined
threshold, the document was taken into consideration for summarization.
Ma and Wu’s work [3] combined n-gram and dependency word pair for
multi-document summarization by defining the syntactic relationships among the
words. Every feature in the model represents the co-occurrence of that feature in the
model. The weight of these features determines the score of a sentence. A summary is
finally formulated based on the score. Higher score translates to higher significance.
The Frequent Document Summarization approach was introduced by
probability of the most frequently used words across documents. The words from
the documents were ranked based on the time-stamp of the documents, thus giving
it a chronological sequence for summarizing. They compared their results with the
results obtained by Radev et al. and their MEAD algorithm in [2].
[21] discusses approaches like Latent Semantic Analysis (LSA), Latent Dirichlet
Allocation (LDA), LDA-Singular Value Decomposition (LDA-SVD) and semantic
relations. LSA and semantic relations have been discussed in the next section.
The approach proposed by the authors broadly breaks the process into performing
pattern-based modelling on the input documents. Pattern based modelling deals with
performing LDA, representing the data and interpreting the sentences. The output
sentences are then scored. Highest ranking sentences are selected and these sentences
are added to the final summary.
The above process yields sentences that are semantically similar to the
information from the parent file but the probability of redundancy is higher in this
approach. Also, there is no check to maintain coherency of the summary. With the
two constraints, the algorithm could potentially perform better.
2.2.3 Knowledge-Based Summarizing
Another approach to summarizing documents is by understanding its semantics
and then attempting to summarize based on that understanding. One of the earliest
approaches was to treat the text summarization problem as maximizing a sub-modular
function under a budget constraint [17]. The authors modified the greedy algorithm
to efficiently solve the budgeted sub-modular maximization problem near-optimally,
the authors was: max 𝑆⊆𝑉{𝑓(𝑆) : ∑︁ 𝑖𝜖𝑆 𝑐𝑖 < 𝛽}
where, V is the ground set of all linguistic units (e.g., sentences) in the document, S
is the extracted summary (a subset of V ),𝑐𝑖 is the non-negative cost of selecting unit
i and B is our budget, and sub-modular function f(·) scores the summary quality [17].
Nenkova [14] proposed searching for entities in the document and assigning
weights to them. The frequency of these entities was then calculated, and depending
on the frequency, the sentences relating to the entities were generated and added to
the summary.
Xiong and Luo [5] explored the use of LSA to summarize multiple as well as
single text documents. LSA is a method for extracting and representing the meaning
of words by statistical computations applied to a large corpus of text. LSA uses the
principle that the aggregate of the words determines the constraints available during
the presence or absence of a word. This constraint helps determine the similarity [6].
But using LSA often leads to repetition of words in the summarized text and therefore
has a lot of redundancy. Xiong and Luo proposed a unique approach using LSA, where
a new method to evaluate a sentence subset based on its capacity to reproduce term
projections on right singular vectors was used to reduce redundancy [5].
Rautray and Balabantaray’s work [13] proposes the use of nature-related
optimization algorithms as the solution for multi-document summarization. The
authors analyze various algorithms like Particle Swarm Optimization (PSO),
Differential Evolution (DE), Cat Swarm Optimization and Genetic Algorithms. The
authors evaluate the Cuckoo Search algorithm to summarize the documents and
This type of implementation will not only reduce redundancy but may be a good
solution for the problem statement.
An interesting approach by creating the semantics and then summarizing was
taken by Chatterjee et al. in [11]. The authors used Neural Networks to define
a fitness function to express mathematically the quality of the generated summary.
The properties taken into consideration were theme similarity, cohesion, sentiments,
readability, aggregate similarity and sentence position [11]. They then used Genetic
Algorithm to maximize the fitness function, and extract the most important sentences
to create the extractive summary. This approach initially creates the semantic
evaluation function and then generates the actual summary.
2.2.4 Graph-Based Summarizing
Graphs have always been popular while summarizing as they help track work
semantics and order of sentences and words. Wan and Young [12] combined
clustering-based techniques with rank-based techniques and graph-based techniques
to summarize documents. In their work, the authors assigned weights to
intra-document common features and inter-document features. These features were
termed as links. Priority was given to intra-document links and these links were
incorporated in the multi-document summaries.
A similar approach was taken by J. Christensen et al. in [16]. The authors
proposed a two part approach. Firstly, to create intra-document graphs automatically
to understand connections between documents like the one proposed in [12]. Secondly,
estimating the coherency of the candidate summary.
An example of the document linkage graph is also known as a discourse graph.
would be coherent, but the algorithm determines which is the most coherent summary
for the input documents.
Su and Xiaojun [7] proposed an extractive multi-document summarization
approach that uses the semantic role information mentioned in [5] to improve a
graph-based ranking algorithm for summarization. In their work, the authors parsed a
sentence to obtain its semantic roles. They introduce the SRRank algorithm to rank
the sentence, words, and semantic role simultaneously in a heterogeneous ranking
manner [7].
The work in [7] proposed event graphs for information retrieval and
multi-document summarization by introducing a document-based representation to
filter and structure the details about the events explained in the text. Rule-based
models and machine learning were integrated to extract the sentence level event and
an information retrieval approach was used to measure the similarity among the
documents and queries by estimating the graph kernels across event graphs [7].
Sankarasubramaniam et al. [8] introduced a text summarization approach that
constructs a bipartite sentence concept graph. The input sentences were ranked
based on the iterative updates and a personalized and query-focused summarization
was considered.
An alternate clustering approach proposed by Bannerjee et al.[19] identifies the
most important document in the multi-document set. The sentences in the most
important document are aligned to sentences in other documents to generate clusters
of similar sentences. Then, K-shortest paths from the sentences in each cluster using
a word-graph structure are created. Finally, sentences from the set of shortest paths
model with the objective of maximizing information content and readability of the
final summary. The ILP model represents the shortest paths as binary variables and
considers the length of the path, information score and linguistic quality score in
the objective function [19]. This approach incorporates clustering with ranking and
therefore seems pragmatic.
Based on the work done in [11], Chu and Liu [15] also proposed the use of an
end-to-end neural network to produce summarization. The neural network proposed
was to be a sequence-to-sequence model with no summarized data as input. This
way, the model would not have any data related to what the output has to be. The
model summarizes data based on context and keeps giving the next probable word as
an output, thus generating a summary.
2.3 Based on Type
The two types of summarization, as already mentioned, are abstractive and
extractive. One derives sentences from the parent text while the other "learns" the
parent text to provide a semantically sound summary of its own.
2.3.1 Abstractive Text Summarization
Abstractive summarization is trickier compared to Extractive as generation of
text comes into play instead of selecting sentences from the original body of text.
A. Khan, N. Salim and Y. Kumar proposed the creation of a semantic graph from
the input text using Genetic Algorithms (GA) [22]. They stated that most Abstractive
summarization algorithms employ the Bag Of Words (BoW) technique to create
abstracts but this way does not reduce redundancy. To counter this problem, they
Structures (PAS) and edges represent the semantic weight [22]. The semantic weight
of the edges are to be obtained from PAS to PAS weights or PAS to Document,
which is obtained by running a GA algorithm. The authors then ranked these nodes,
and to reduce redundancy, they then applied Jiang similarity [27] and chose the top
ranked nodes [22]. These nodes were fed to the language generator which produced
the abstract. They evaluated the summary using the ROUGE evaluation technique.
A different approach was undertaken by Chopade and Narvekar where they
used fuzzy logic to understand the semantic and syntactical similarity between words
instead of graphs [23]. The authors performed feature extraction and gave that as
input to the fuzzy system. The features used for the study were title, term weight,
named entities number and numerical data presence. The score received was bucketed
into important, average and unimportant buckets [23]. The important sentences were
used as training data by a Restricted Boltzmann Machine (RBM) with one input
layer, two hidden layers and an output layer [23]. Sentences fed to the hidden layer
were fed with a bias. The input data to the fuzzy system was pre-processed by
tokenizing, removing stop words, stemming, etc. A seed word was accepted from the
user and was assigned a random priority value [23]. The authors also created two
tables: one which stored the frequency of words per sentence for every document and
one with the number of words in the document along with their associated rank. The
sentences were ranked and the highest ranked sentences were chosen for the summary
creation. The authors obtained a recall of value 1 and an accuracy of 84.73% making
fuzzy systems and neural networks a good choice for summarizing texts.
In order to understand the deep learning approach mentioned by [23], the works
by Liu,Zhong and Li [24] are studied, where they have used a query-based approach on
to summarize text in documents. Features used as input to the neural network include
term frequency and length of sentences [24]. The RBM mentioned in [23] was first
used by Liu, Zhong and Li and is a two layer neural network with three hidden
layers [24]. The binary input and output of the RBM model are connected to each
other using weighted connections [24] and its parameters are initially randomized.
The architecture of this model was divided into three parts [24]:
∙ Concept Extraction
∙ Reconstruction and Validation
∙ Summary generation
The model has three hidden layers to abstract the documents using greedy, layer
wise extraction. The first hidden layer is used to filter out accidental and redundant
words. The second hidden layer is used to identify key words and their occurrences
throughout the documents [24]. Reconstruction and validation phase intends to
reconstruct the data distribution by tuning the architecture globally [24]. The authors
used dynamic programming (DP) to maximize the highly ranked and important
sentences in the summary and to control the length of the summary. Lastly, the
quality of the summary was evaluated using ROUGE evaluation, which is discussed
in Chapter 3.
2.3.2 Extractive Text Summarization
Extractive text summarization uses statistical metrics or machine learning
algorithms to obtain sentences from the parent text that are calculated as relevant
various approaches for Extractive text summarization. A few of these are explored
to understand the research done on this topic.
An approach using Fuzzy Inference was proposed by Suanmali, Salim and
Binwahlan, where they performed experiments on the DUC2002 data set [25]. The
authors pre-processed their data by first sentences from source text, tokenizing,
removing stop words and stemming [25]. The authors proposed using eight features
as input to their fuzzy inference system. They first represented all the sentences as
vectors. Then each feature was scored between 0 and 1 and the authors aimed to
obtain a compression rate of 20% [25].
∙ Title Feature: The authors proposed that if the words in the title of the
document matched anywhere in the sentences of the documents, those sentences
would have a higher score [25]. They counted all the matches.
∙ Sentence Length: The authors gave more importance to longer sentences over
shorter sentences. They state that if a sentence is shorter, it probably consists
of author names, date lines and such [25]. The authors also normalized the
length of the sentences.
∙ Term Weight: Average of Term-frequency and Inverse Document Frequency
(TF-IDF) is considered as a feature.
∙ Sentence Position: The authors have given higher priority to sentences that
occur early on in the documents. These sentences were scored more than the
other sentences.
∙ Sentence to Sentence Similarity: The authors calculated the similarity
∙ Proper noun: Sentences containing proper nouns are deemed more relevant
and scored higher than sentences containing less or no proper nouns.
∙ Thematic Words: The authors computed the top 10 most frequent content
words and sentences containing more of these words were scored higher than
sentences not containing these words [25].
∙ Numerical Data: Sentences consisting of numerical data or formulae were
given a higher score [25].
These eight features were fed as input to a Fuzzy Inference System to summarize.
The authors used a triangular membership function which ranked the sentences as
Unimportant, Important and Average [25]. The important sentences were collated to
give the summary and were evaluated using ROUGE evaluation as in [22].
Alias and Muhammad in their work propose using sequential pattern-based
approach for summarizing multiple documents. Their approach starts with
tokenizing, removing stop words and pre-processing the documents as the first
step [26]. They then implemented a sequential pattern-based mining technique that
extracted non-redundant frequent textual patterns [26]. The authors treated each
document as a transaction, and if particular sentences popped up in documents, they
were determined as textual patterns. They assigned integers to the sentences along
with the frequency of these sentences. So, similar sentences had similar integers
corresponding to them. The authors then assigned a specific threshold value and
extracted sentences that fell above that value [26]. This helped the authors avoid
redundant sentences from leaking into the resulting summary. The sequence of the
assigned integers was used to determine the sequence of sentences that would go
similarity. The approach used by Alias and Muhammad, although simplistic, proves
CHAPTER 3 Relevant Approaches
Some of the approaches and terminologies used in the experiments in Chapter 5
for text summarization are discussed.
3.1 ROUGE
Recall-Oriented Redundancy for Gisting Evaluation (ROUGE) is used to
automatically determine the quality of summaries by comparing them with those
created by humans [28]. Earlier, it was done by judging the cohesiveness, conciseness,
grammatical correctness, readability and such. There was no proper way of
statistically measuring the correctness of a summary until Saggion et. al. developed
methods that measured similarity between summaries using cosine similarity, unit
overlap and longest common sub-sequences [30]. It wasn’t until BLEU was developed,
that the concept of n-grams could be used for measuring summaries came into the
picture [31].
BLEU dealt with precision. It measured how many words or n-grams in the
summary obtained were reflected in the reference text. The difference between BLEU
and ROUGE is that ROUGE deals with recall. ROUGE measures how many words
in the reference text matches that of the generated summary. In a way, both the
evaluation methods complement each other like precision versus recall.
3.1.0.1 ROUGE-L
ROUGE-L uses longest common sub sequence (LCS) as its measure to calculate
the score. It compares the LCS of the summary to that of a reference text and
provides a score. To understand sentence level LCS, f-measure is calculated.
𝑅𝑙𝑐𝑠 = 𝐿𝐶𝑆(𝑋, 𝑌) 𝑚 [28] 𝑃𝑙𝑐𝑠 = 𝐿𝐶𝑆(𝑋, 𝑌) 𝑛 [28] 𝐹𝑙𝑐𝑠 = (1 +𝛽2)𝑅 𝑙𝑐𝑠𝑃𝑙𝑐𝑠 𝑅𝑙𝑐𝑠+𝛽2𝑃𝑙𝑐𝑠 [28]
where 𝐿𝐶𝑆(𝑋, 𝑌) is the LCS between X and Y. 𝛽 = 𝑃𝑙𝑐𝑠
𝑅𝑙𝑐𝑠. 𝛽 in such cases is
usually set to a high number and the F-1 score is the score to be considered. P, R
and F stand for Precision, Recall and F-measure respectively.
3.1.0.2 ROUGE-N
ROUGE-N is the measure of n-gram within the target summary in reference to
the reference text.
It is evaluated using the following equation.
𝑅𝑂𝑈 𝐺𝐸−𝑁 = Σ𝑆𝜖𝑅𝑒𝑓 𝑒𝑟𝑒𝑛𝑐𝑒𝑆𝑢𝑚𝑚𝑎𝑟𝑖𝑒𝑠Σ𝑔𝑟𝑎𝑚𝑛𝑐𝑜𝑢𝑛𝑡𝑚𝑎𝑡𝑐ℎ(𝑔𝑟𝑎𝑚𝑛) Σ𝑆𝜖𝑅𝑒𝑓 𝑒𝑟𝑒𝑛𝑐𝑒𝑆𝑢𝑚𝑚𝑎𝑟𝑖𝑒𝑠Σ𝑔𝑟𝑎𝑚𝑛𝑐𝑜𝑢𝑛𝑡(𝑔𝑟𝑎𝑚𝑛)
[28]
which is basically the ratio of n-grams matched in the resulting summary divided
by the total n-grams in the reference text.
ROUGE-N is the metric used for evaluating the summaries generated in this
of the text are used for evaluation.
3.1.0.3 ROUGE-W
Weighted LCS is used because regular LCS has trouble differentiating spatial
relations within its embedded sequences [28].
The f-measure differs in the equation such that:
𝑅𝑤𝑙𝑐𝑠 =𝑓 −1(𝐿𝐶𝑆(𝑋, 𝑌) 𝑚 ) [28] 𝑃𝑤𝑙𝑐𝑠 =𝑓 −1 (𝐿𝐶𝑆(𝑋, 𝑌) 𝑛 ) [28] 𝐹𝑤𝑙𝑐𝑠 =𝑓 −1((1 +𝛽2)𝑅𝑤𝑙𝑐𝑠𝑃𝑤𝑙𝑐𝑠 𝑅𝑤𝑙𝑐𝑠 +𝛽 2𝑃 𝑤𝑙𝑐𝑠 ) [28] where 𝑓−1 is a function of 𝑓. 3.1.0.4 ROUGE-S
The Skip-bigram co-occurrence statistics calculates the overlap or matches
between the summary obtained and the reference summary. An example of how
skip-bigrams work is shown below:
S1: "Jim likes to eat apples"
S2:"Apples likes to be eaten"
S3:"Jim likes to pick apples"
Here, each sentence has C(5,2) [28] = 10 skip-bigrams. S1 has the following
skip-bigrams:
S1: "("Jim likes", "Jim to", "Jim apples", "Jim eat", "likes to", "likes eat","likes
S2 has the following skip-bigrams:
S2: "("Apples likes","likes to","to be","be eaten","Apples to","Apples be",
Apples eaten","likes be","likes eaten","to eaten")
S2 has 1 skip-bigram match with S1.S3 has the following skip-bigrams:
S3: "("Jim likes","Jim to","Jim pick","Jim apples","likes to"," likes pick","likes
apples","to pick","to apples","pick apples")
S3 has 5 skip-bigram matches with S1. Assuming translations 𝑥of length𝑚 and
𝑌 of length 𝑛, the work done in [28] computed F-measure as:
𝑅𝑠𝑘 𝑖𝑝2 = 𝑆𝐾𝐼𝑃2(𝑋, 𝑌) 𝐶(𝑚,2) [28] 𝑃𝑠𝑘 𝑖𝑝2 = 𝑆𝐾𝐼𝑃2(𝑋, 𝑌) 𝐶(𝑛,2) [28] 𝐹𝑠𝑘 𝑖𝑝2 = (1 +𝛽2)𝑅 𝑠𝑘 𝑖𝑝2𝑃𝑠𝑘 𝑖𝑝2 𝑅𝑠𝑘 𝑖𝑝2+𝛽2𝑃𝑠𝑘 𝑖𝑝2 [28]
where SKIP2 is the skip-bigram matches between the translations 𝑥 and 𝑌, 𝛽
controls the importance of the P and R and C is a combination function [28].
3.2 Latent Semantic Analysis
Latent Semantic Analysis(LSA) is a method that uses statistical calculations to
represent contexts of words and similarity of sentences. It finds out what sentences
and words are relevant and flags them out. This quality makes it suitable to find and
rank sentences and perform Extractive text summarization.
LSA is implemented in three main steps:
∙ An input matrix is created, where the text from the documents is represented
the rows. The value of the word is stored in the cells of this matrix [33]. For
this work, the value of the cell in this matrix is represented the form of term
frequency.
∙ Singular Value Decomposition (SVD) is then implemented to identify patterns
between the sentences and words [33]
∙ Lastly, rows with the highest score are ranked as the most relevant sentences
and become a part of the rank selection step.
3.3 Bag Of Words
The Bag of Words model is a popular model in the field of Machine Learning and
Natural Language Processing used to extract features from text. For every sentence
given, the sentence is tokenized into words and the frequency of the word is used as
a feature. To understand this better, consider the following sentences:
"Jim likes playing football"
"Jim likes to eat cake"
"Kate likes talking to Jim"
Each sentence gets treated as a separate document and is
processed accordingly. Words are extracted without punctuation and
used. The above sentences break down into the following words:
"Jim","likes","playing","football","to","eat","cake","Kate","talking". These
tokens are then converted to vectors. The frequency of these words are counted and
for every sentence the presence of a word is denoted as 1 and absence is denoted as
"Jim likes playing football" [1,1,1,1,0,0,0,0,0]
"Jim likes to eat cake" [1,1,0,0,1,1,1,0,0]
"Kate likes talking to Jim" [1,1,0,0,1,0,0,1,1]
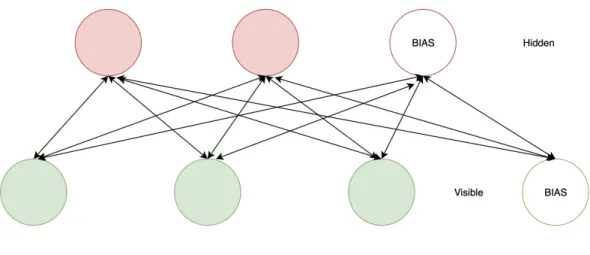
3.4 Restricted Boltzmann Machine
Restricted Boltzmann Machine (RBM) is a stochastic neural network which
means that it is a neural network where each of its neurons behaves randomly when
activated. An RBM typically consists of a hidden layer and a visible layer of neuron.
These layers do not have connections between each other but are connected to all
the neurons in the other layer [38]. The RBM forms a bipartite graph. These
connections are bidirectional ensuring information flow between layers. Fig. 3 shows
the connections between the two layers.
Figure 3: Layers in RBM
The information between layers flows both ways during their usage and the
weights are the same in both directions [38].
pre-processing time. For the experiments performed for this these, 7 features were
used as input to the RBM:
∙ TF-IDF: Term Frequency and Inverse Document Frequency are two measures.
Term Frequency is the number of occurrences of a particular set of words
in a document. Inverse document frequency is the inverse fraction of all
the documents containing that word. The two measures obtained are then
multiplied to obtain the TF-IDF score.
∙ Cosine Similarity between sentences: Cosine Similarity is measured by
calculating the cosine angle between two vectors. It is denoted as:
𝑆𝑖𝑚𝑖𝑙𝑎𝑟𝑖𝑡𝑦 =𝑐𝑜𝑠(𝜃) = 𝐴.𝐵
|𝐴|.|𝐵|
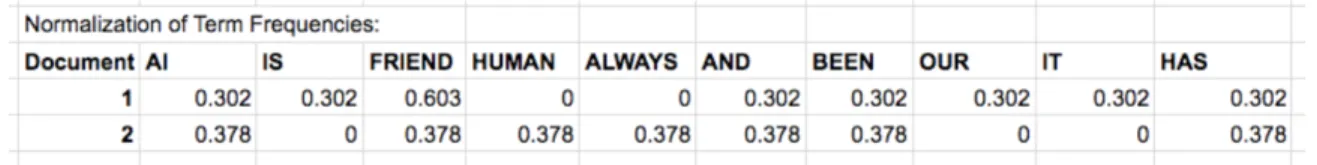
An example of cosine similarity would be [39]: S1: AI is our friend and it has
been friendly S2: AI and humans have always been friendly The term frequency
is calculated for the two sentences using BoW. Fig. 4 shows the term frequency
for the example being considered.
Figure 4: Term Frequency
The next time is to normalize the frequencies obtained. Fig. 5 shows the
normalization.
On obtaining the normalized form, it served as input to the Cosine Similarity
Formula. This gives:
𝑆𝑖𝑚𝑖𝑙𝑎𝑟𝑖𝑡𝑦 = (0.302*0.378)+(0.603*0.378)+(0.302*0.378)+(0.302*0.378)+(0.302*0.378)
Therefore, the cosine similarity score for the two sentences is 0.684.
∙ Sentence Length: Length of the sentences in every document
∙ Sentence Position: Position of the sentence in the document. The higher the
sentence in the document, more relevant it is.
∙ Numerical Presence: Sentences containing numbers were counted and were
given more importance
∙ Number of Uppercase words: Upper case words in a sentence were deemed
more important as they usually tend to stand for acronyms.
∙ Proper Noun Score: The documents were pre-processed to obtain POS tags.
Using these tags, the number of proper nouns per sentence were calculated. This
count becomes the proper noun score of that sentence. The intuition behind
this is that proper nouns usually are names of people or places, and that usually
makes them important in a document. So, the higher the proper noun score,
the more important the sentence is deemed.
A vector matrix is created using the words in the sentences of the document and
the above mentioned features. The rows of this matrix become the input to the RBM.
These sentence vectors with the highest rank contribute to forming the summary. The
After the first cycle, the new matrix is refined using the randomly selected bias
against a set threshold. Rows falling below the threshold are filtered out. Then, a
new round is computed.
3.5 Text-Rank
The Text-Rank Algorithm is derived from the Page Rank Algorithm. Page Rank
algorithm calculates probability of a web page being linked to another to ensure faster
retrieval. Similarly, text-rank computes the similarity of sentences in its matrix.
Figure 6: Text-Rank Algorithm
Fig. 6 shows the steps that make up the Text-Rank algorithm. The text from
the input document is collated,. If it’s multiple documents, it is combined into one.
These texts are then split into independent sentences. These sentences are converted
to vectors. This can be done in various ways. One could compute frequency of words
or TF-IDF, etc. The similarity matrix is created by computing the similarity between
these vectors. Sentences with the highest similarity are ranked and become a part of
3.6 Lex-Rank
Lex Rank is derived from Page Rank where it correlates the sentences and their
contextual relations with each other. Lex Rank first generates a graph with the
sentences as nodes and the similarity between them becoming the edges, similar to
Page Rank [34]. The similarity can be calculated in various ways, one such way being
the BoW method [35]. Measure is done using TF-IDF for the BoW model. The
idf-modified-cosine formula is used to measure the similarity between sentences and
compute it as per the methods followed by Text-Rank [35]
3.7 Reduction Algorithm
One of the basic algorithms that simply reduces sentences by elimination. After
pre-processing the data, the sentences in the document form the nodes of a graph.
The edges of the graph are weights that are computed. One way to compute weights
is to use term frequency. After creating the whole graph, sentences with the highest
weights get chosen to be put in the summary. A set threshold can be used and
CHAPTER 4 Proposed Solution
A hybrid solution is proposed to solve the problem of text summarization. The
solution starts by implementing Latent Semantic Analysis to rank and reduce the
sentences, and then uses these focused sentences as input to a Restricted Boltzmann
Machine to produce effective summaries.
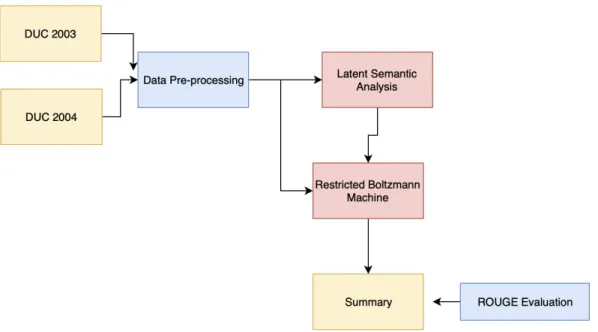
Fig. 7 shows the proposed architecture of the solution.
Figure 7: Architecture Diagram
In the above architecture, yellow denotes the input and output of the system.
Namely, the DUC data sets are used as input: DUC2003 and DUC2004. The output
obtained by this system is a summary of the folders input. A breakdown of the data
The blue boxes in the architecture denote the evaluation and pre-processing done
on the input and output obtained. For evaluation, the ROUGE evaluation technique
is used. It is discussed in Chapter 3.
The red boxes denote the main algorithms/approaches used in the solution.
Latent Semantic Analysis (LSA) and Restricted Boltzmann Machines(RBM) are used
to obtain a calculated and intuitive summary. The solution is called hybrid as, while
LSA is a strictly extractive process, RBM is a mixed process as it relies on probabilistic
stochastic calculations to determine what word/sentences to include in the summary.
4.1 Data Sets
The Document Understanding Conferences (DUC) are conferences held to
evaluate and promote text summarizations. They collect data as a means to provide
a uniform data set for the purpose of summarization. DUC contains data sets from
2001 to 2007 [29]. For the purpose of this project, DUC2003 and DUC2004 were
chosen.
DUC2003 DUC2004
50 60
Table 1: Number of folders in each DUC
Combined, both folders contain a total of 868 files. Each of these files contain
news articles from sources like the New York Times, etc. The following is an excerpt
of a paragraph from a DUC2003 file.
"After vowing to combat fraud, online auction service eBay Inc. finds itself the subject of a fraud investigation being conducted by the city’s Department of Consumer Affairs."
4.2 Pre-Processing
Various types of pre-processing has been done on these files. The original data
set files are in an unstructured file format by default. The files had to be converted
to text format for easy handling. The files were also extracted from the web so were
in HTML format. Natural Language Toolkit(NLTK) in Python was used to remove
the HTML tags and obtain the main body. On obtaining the main body, variety of
pre-processing steps were performed.
4.2.1 Tokenization
Tokenizing a sentence is basically splitting the sentence to its basic entity. In this
case, individual words. Therefore, a sentence like "Jack likes apples." will be tokenized
to "Jack", "likes" and "apples". Tokenization makes working with sentences easier.
4.2.2 Removing Stop Words
NLTK English language stop word list was used to eliminate stop words occurring
in the documents. Stop words are redundant and unimportant words such as "a",
"an", "has", etc.
4.3 Algorithms Implemented
As explained in Chapter 3, experimentation with a variety of algorithms was
done to summarize the texts. Single document summarization was performed on
the documents and then the results were compared with the results obtained from
4.3.1 Part-of-Speech Tagging
Parts-of-Speech (POS) tagging is the grammatical break down and matching of
words in a sentence to their reactive parts of speech. POS are broadly classified into
eight types: nouns, adjectives, verbs, prepositions, pronouns, conjunctions, adverbs
and interjections. POS is a supervised learning algorithm which uses features like
first word, last word, next word, etc.
4.4 Evaluation
There are two popular ways to evaluate text summaries, both dependent on
the concept of calculating n-grams: BLEU and ROUGE. Since, both methods are
complementary to each other (one deals with precision, while the other calculates
Recall), evaluation was done using only one. All the summaries generated are
evaluated using the ROUGE-1 and ROUGE-2 score. ROUGE-1 calculated the
unigrams present in the summary when compared to the reference texts. ROUGE-2
calculates the bigrams present in the generated summary when compared with that
of the reference texts. The reference text used in all algorithms mentioned above is
the unsummarized text.
The ROUGE Summary generates scores in the form of the F-measure, Precision
and Recall.
4.4.1 Precision
Precision in this study is the measure of relevant sentences obtained from the
retrieved sentences [36].
𝑃 𝑟𝑒𝑐𝑖𝑠𝑖𝑜𝑛= 𝑅𝑒𝑙𝑒𝑣𝑎𝑛𝑡𝑆𝑒𝑛𝑡𝑒𝑛𝑐𝑒𝑠𝑓 𝑟𝑜𝑚𝐷𝑜𝑐𝑢𝑚𝑒𝑛𝑡
⋂︀
𝑅𝑒𝑡𝑟𝑖𝑒𝑣𝑒𝑑𝑆𝑒𝑛𝑡𝑒𝑛𝑐𝑒𝑠𝑓 𝑟𝑜𝑚𝐷𝑜𝑐𝑢𝑚𝑒𝑛𝑡 𝑅𝑒𝑡𝑟𝑖𝑒𝑣𝑒𝑑𝑆𝑒𝑛𝑡𝑒𝑛𝑐𝑒𝑠𝑓 𝑟𝑜𝑚𝐷𝑜𝑐𝑢𝑚𝑒𝑛𝑡
4.4.2 Recall
Recall is the measure of relevant sentenced retrieved from the sentences
available [36]. 𝑅𝑒𝑐𝑎𝑙𝑙 = 𝑅𝑒𝑙𝑒𝑣𝑎𝑛𝑡𝑆𝑒𝑛𝑡𝑒𝑛𝑐𝑒𝑠𝑓 𝑟𝑜𝑚𝐷𝑜𝑐𝑢𝑚𝑒𝑛𝑡 ⋂︀ 𝑅𝑒𝑡𝑟𝑖𝑒𝑣𝑒𝑑𝑆𝑒𝑛𝑡𝑒𝑛𝑐𝑒𝑠𝑓 𝑟𝑜𝑚𝐷𝑜𝑐𝑢𝑚𝑒𝑛𝑡 𝑅𝑒𝑙𝑒𝑣𝑎𝑛𝑡𝑆𝑒𝑛𝑡𝑒𝑛𝑐𝑒𝑠𝑓 𝑟𝑜𝑚𝐷𝑜𝑐𝑢𝑚𝑒𝑛𝑡 4.4.3 F-Measure
F-measure is the harmonic mean of precision and recall [36]
𝐹 = 2𝑃 𝑟𝑒𝑐𝑖𝑠𝑖𝑜𝑛×𝑅𝑒𝑐𝑎𝑙𝑙
CHAPTER 5 Experiments and Results
As per the architecture diagram, the data was pre-processed before the individual
algorithms were applied. The algorithms compressed the size of the document by an
average of 30%. LSA was implemented on single documents to optimize them before
using them as input for the RBM.
RBM was implemented with various parameters and the best result was observed
for 8 hidden states with a learning rate of 0.1. The input for the RBM are the
single documents created by the LSA and other graph-based algorithms. Multiple
algorithms belonging to the same folder are merged and input to the RBM.
Experimentation with different algorithms as mentioned in Chapter 3 was done to
understand how the summaries differ and which approach yields better results.
For each of the summarizing approaches, the performance of the algorithms was
observed after summarizing single documents and multiple documents. The examples
shown contain the highlighted green sentences as the sentences chosen to be in the
final summary.
For the multiple document approach, single documents were collated into one,
and the algorithms were implemented on the combined file.
5.1 Evaluation
ROUGE-1 is the ratio of the unigram score between the summary obtained and
the reference text. Implementing ROUGE-1, it was observed that all the algorithms
counterparts.
ROUGE-2 is the measure of bigrams when comparing the summary obtained to
that of the reference text. Like ROUGE-1, it was observed that the scores with RBM
were lower than that of the individual algorithms.
Both ROUGE-1 and ROUGE-2 split the results into precision, recall and F-1
scores. Since there were 4 independent algorithms that had been implemented
individually, as well as in combination with RBM, a lot of summaries were generated
and had to be evaluated.
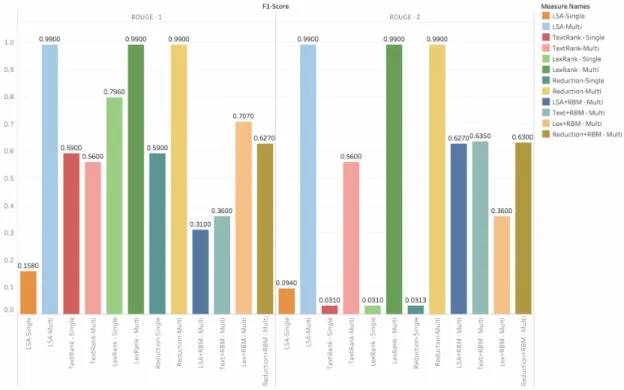
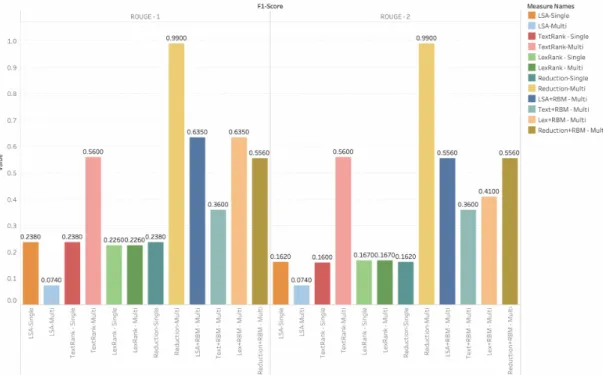
Figure 9: F-1 Scores for DUC2004
Fig. 8 and Fig. 9 compare the F-1 scores for ROUGE-1 and ROUGE-2 for
single and multi-documents for DUC2003 data set and DUC2004 data set respectively.
Since F-1 score is the harmonic mean of precision and recall, it is observed that LSA,
Reduction and Lex-Rank algorithms, when applied independently to the collated
documents, seem to yield an almost perfect score for DUC2003 and only Reduction
algorithm applied independently to the collated documents yielded an almost perfect
score for DUC2004.
For the combination algorithms, LSA and Lex-Rank combined with RBM seem
to perform better on both data sets. To understand the F-1 scores obtained better,
Figure 10: Precision for DUC2003
Precision is the measure of how many sentences considered for summary
were actually relevant in comparison to the text in the parent document. Since
the approaches with the independent algorithms fell mainly under extractive text
summarization, the sentences in the summary were actually a subset of the parent
text. Therefore, these approaches should ideally yield a precision of 1. For the
combination algorithms, the input were summarized documents and precision was
calculated between the summary generated and the original parent text document,
the expected precision should be lower than 0.7.
Fig. 10 and Fig. 11 compare the Precision for ROUGE-1 and ROUGE-2 for single
and multi-documents for DUC2003 data set and DUC2004 data set respectively. As
stated above, it is observed that the single algorithm implementations yielded almost
perfect precision as expected, except for Text-Rank. Combination algorithms with
LSA and Reduction also yielded a higher precision. This can be attributed to the
Figure 12: Recall for DUC2003
Figure 13: Recall for DUC2004
by the algorithm in the summary are actually relevant to the summary. A higher recall
measures the effectiveness of the algorithm. Fig. 12 and Fig. 13 compare the Recall
for ROUGE-1 and ROUGE-2 for single and multi-documents for DUC2003 data set
and DUC2004 data set respectively.
For DUC2003, most individual algorithms have a perfect recall for multiple
document summarization and Lex-Rank in combination with RBM seem to be giving
the best recall for multiple documents. For single documents, Text-Rank yielded the
best Recall.
5.2 Sample Summaries
5.2.1 Reduction Summarizer
Reduction Summarizer was implemented on the DUC data sets for both single
and multiple documents.
The summarizer obtained a reduction of an average of 40% for multi-document
summarization on the DUC data sets. A snippet from CNN [37] was taken to show
Figure 14: Example Summary for Reduction Summarizer [37].
In the summary shown in Fig. 14, there are about 15 complete sentences. The
green highlighted texts are the sentences picked by the Reduction Summarizer, whose
workings have been explained in Chapter 3. The Reduction Summarizer picked 9
the gist of the actual text. For this particular example, the summarizer reduced the
original text to 60%.
5.2.2 LSA Summarizer
The LSA Summarizer’s implementation is shown in Fig. 15.
The same snippet was used to generate summaries using all the combinations
of algorithms. LSA Algorithm picks 10 sentences from the summary as part of the
summarization. For this example, the summary reduced the original text to 66.67%.
5.2.3 Text-Rank Summarization
Figure 16: Example Summary for Text-Rank Summarizer [37].
This summarizer gives a similar result as of that to the LSA. 10 matches to the
5.2.4 Lex-Rank Summarizer
Fig. 17 shows an example of how Lex-Rank Summarization summarizes the
sample text.
The Lex-Summarizer chooses 10 sentences, the same as the Text-Rank
Summarizer, as it follows a similar construction methodology. Here too the reduction
is 33.33%.
5.2.5 Summary of Results
Algorithm Sentences in Summary Sentences in Parent text Percentage Reduction
Reduction 9 15 40%
LSA 10 15 33.33%
Text-Rank 10 15 33.33%
Lex-Rank 10 15 33.33%
Table 2: Summary of Results of Experiments
Table 2 gives us a summary of the results of all the experiments. It is observed
that Reduction algorithm reduced the summaries by the most percentage. The other
CHAPTER 6
Conclusion and Future Work
Restricted Boltzmann Machines (RBMs) are lower level neural nets with at least
one visible layer and one hidden layer. Like other neural networks, RBMs require
large amount of training data to provide a better output. In this study, the RBM
was used in combination with other algorithms to provide it with a refined input.
But the data sets, DUC2003 and DUC2004 provided a small amount of data. The
RBM hybrid models were expected to yield the best results but, on observing and
comparing, these models fell short. This lack of performance can be attributed to
the lower amount of data fed as input to the models. Like all neural networks, RBM
would probably perform better if the input data was large in number.
Individually it is observed that the LSA, Lex-Rank, Text-Rank, Reduction
Algorithms provide a higher ROUGE score, but when combined with RBM, the score
drastically reduces. After observing and comparing the scores, Lex-Rank proved to
be one of the best algorithms for text summarization for both single and multiple
document summarization.
It was also observed that ROUGE scores for the multi-document summarizing
remains almost the same for both data sets. We cannot infer much from this as we
provided the RBM with lesser data. We hope that on increasing the size of the data
set, the values will most likely differ.
Even in the individual algorithms, Reduction algorithms only removes
redundancy and doesn’t actually perform complex operations. Reduction algorithm
For future work, the same algorithms could be implemented by using all the DUC
documents, from 2001-07 as input. This would ensure that RBM got a large amount
of data to train on, and this would hopefully provide a significantly better result.
Recurrent Neural Networks (RNN) have been proven to learn from parent texts
to generate keyword related shorter texts. This theory can be applied to text
summarization and it’s results can be compared with the work done in this thesis.
Lastly, an evaluation using BLEU can be done to observe the differences in the
approaches taken. The output, though similar, would still give a different way of
LIST OF REFERENCES
[1] K.R. McKeown and D.R Radev, "Generating summaries of multiple news articles," in Proceedings of SIGIR ’95, pages 74–82, Seattle, Washington, 1995.
[2] D.R. Radev, H. Jing, and M. Budzikowska, "Centroid-based summarization of multiple documents: sentence extraction, utility-based evaluation, and user studies," in ANLP/NAACL Workshop on Summarization, Seattle, WA, April 2000.
[3] Y. Ma and J.Wu, “Combining N-gram and dependency word pair for multi-document summarization,” in Proceedings of the IEEE 17th International Conference on Computational Science and Engineering (CSE ’14), pp. 27–31, Chengdu, China, December 2014.
[4] R. M. Alguliev, R. M. Aliguliyev, and N. R. Isazade, “Multiple documents summarization based on evolutionary optimization algorithm,” Expert Systems with Applications, vol. 40, no. 5, pp.1675–1689, 2013.
[5] S. Xiong and Y. Luo, “A new approach for multi-document summarization based on latent semantic analysis,” in Proceedings of the Seventh International Symposium on Computational Intelligence and Design (ISCID ’14), vol. 1, pp. 177–180, Hangzhou, China, December 2014.
[6] T.K Landauer, P.W Foltz and D. Laham, "An introduction to latent semantic analysis," in Discourse Processes, vol. 25(2-3),pp. 259-284.doi:http://dx.doi.org/10.1080/01638539809545028
[7] G. Glavas and J. Snajder, “Event graphs for information retrieval and multi-document summarization,” Expert Systems with Applications, vol. 41, no. 15, pp. 6904–6916, 2014.
[8] Y. Sankarasubramaniam, K. Ramanathan, and S. Ghosh, “Text summarization using Wikipedia,” in Information Processing and Management, vol. 50, no. 3, pp. 443–461, 2014.
[9] G. Erkan and D. R. Radev, “LexPageRank: prestige in multi-document text summarization,” in Proceedings of the Conference on Empirical Methods in Natural Language Processing (EMNLP ’04), pp. 365–371, Barcelona, Spain, July 2004.
[10] N. Ramanujam and M. Kaliappan, "An automatic multi-document text summarization approach based on Naïve Bayesian classifier using timestamp strategy" in Sci. World J, 2016.
[11] N. Chatterjee, G. Jain, and G.S Bajwa G.S, "Single Document Extractive Text Summarization Using Neural Networks and Genetic Algorithm," K. Arai, S. Kapoor and R. Bhatia (Eds),Intelligent Computing, Springer: Cham, 2018. [12] X. Wan and J. Yang, "Multi-Document summarization using cluster-based link
analysis," in Proceedings of the 31st Annual International ACM SIGIR Conference on Research and Development in Information Retrieval, July 20-24, ACM, New York, USA., pp: 906. ISBN:978-1-60558-164-4
[13] R. Rautray, R. C. Balabantaray, "An evolutionary framework for multi-document summarization using cuckoo search approach: MDSCSA", Applied Computing and Informatics, 2017, [online] Available: https://doi.org/10.1016/j.aci.2017.05.003.
[14] A. Nenkova, "Entity-driven rewrite for multi-document summarization," in Proceedings of IJCNLP, 2008.
[15] E. Chu, P.J Liu, "Unsupervised Neural Multi-document Abstractive Summarization," 2018 [Online]. Available: https://arxiv.org/abs/1810.05739
[16] J. Christensen, Mausam, S. Soderland, and O. Etzioni, "Towards coherent multi-document summarization," in Conference of the North American Chapter of the Association for Computational Linguistics Human Language Technologies, pages 1163–1173, 2013.
[17] H. Lin and J. Bilmes, "Multi-document summarization via budgeted maximization of submodular functions," in Human Language Technologies:The 2010 Annual Conference of the North American Chapter of the Association for Computational Linguistics, p.912-920, June 02-04, 2010, Los Angeles, California.
[18] V. K. Gupta and T. J. Siddiqui, "Multi-document summarization using sentence clustering," 2012 4th International Conference on Intelligent Human Computer Interaction (IHCI), Kharagpur, 2012, pp. 1-5. doi: 10.1109/IHCI.2012.6481826
[19] S. Banerjee, M. Prasenjit Mitra and S. Kazunari, “Multi-document abstractive summarization using ILP based multi-sentence compression,” in IJCAI, 2015. [20] S. Kasundra and D. Kotak, "Study on Multi-Document Summarization by
Machine Learning Technique for Clustered Documents," in IJEDR, vol.5, 2017. [21] Su Yan and Xiaojun Wan, “SRRank: Leveraging Semantic Roles for Extractive
Multi-Document Summarization,” IEEE/ACM TRANSACTIONS ON AUDIO, SPEECH, AND LANGUAGE, vol. 22, no. 12, pp. 2048-2058, 2014.
[22] A. Khan, N. Salim and Y. J. Kumar, "Genetic semantic graph approach for multi-document abstractive summarization," 2015 Fifth International Conference on Digital Information Processing and Communications (ICDIPC), Sierre, 2015, pp. 173-181. doi: 10.1109/ICDIPC.2015.7323025
[23] H. A. Chopade and M. Narvekar, "Hybrid auto text summarization using deep neural network and fuzzy logic system," 2017 International Conference on Inventive Computing and Informatics (ICICI), Coimbatore, 2017, pp. 52-56. doi: 10.1109/ICICI.2017.8365192
[24] y. Liu, S. Zhong and W. Li, " Query-Oriented Multi-document Summarization via Unsupervised Deep Learning," Proceedings of the twenty-sixth AAAI Conf. on AI, China, 2012. doi:10.1016/j.eswa.2015.05.034
[25] L. Suanmali, N. Salim and M. S. Binwahlan, "Feature-Based Sentence Extraction Using Fuzzy Inference Rules," 2009 International Conference on Signal Processing Systems, Singapore, 2009, pp. 511-515. doi: 10.1109/ICSPS.2009.156
[26] S. Alias and S. K. Muhammad, "Sequential pattern based multi document summarization — An exploratory approach," 2013 International Conference on Research and Innovation in Information Systems (ICRIIS), Kuala Lumpur, 2013, pp. 85-90. doi: 10.1109/ICRIIS.2013.6716690
[27] J.J. Jiang and D. W. Conrath. “Semantic Similarity Based on Corpus Statistics and Lexical Taxonomy.” ROCLING, 1997.
[28] Lin, Chin-Yew. 2004. ROUGE: a Package for Automatic Evaluation of Summaries. In Proceedings of the Workshop on Text Summarization Branches Out (WAS 2004), Barcelona, Spain, July 25 - 26, 2004.
[29] https://www-nlpir.nist.gov/projects/duc/intro.html [03,04]
[30] Saggion H., D. Radev, S. Teufel, and W. Lam. 2002. Meta-evaluation of summaries in a cross- lingual environment using content-based metrics. In Proceedings of COLING-2002, Taipei, Tai- wan.
[31] Papineni, K., S. Roukos, T. Ward, and W.-J. Zhu. 2001. BLEU: A method for automatic evaluation of machine translation. IBM Research Report RC22176 (W0109-022).
[32] Landauer, T. K., Foltz, P. W., and Laham, D. 1998. Introduction to Latent Semantic Analysis.Discourse Processes, 25, 259-284.
[33] Rasha Mohammed Badry, Ahmed Sharaf Eldin,Doaa Saad Elzanfally. Text Summarization within the Latent Semantic Analysis Framework: Comparative Study,International Journal of Computer Applications (0975-8887);Volume 81 – No.11, November 2013.
[34] Erkan, G., and D. R. Radev. “LexRank: Graph-Based Lexical Centrality as Salience in Text Summarization.” Journal of Artificial Intelligence Research 22 (2004): 457–479.
[35] "NUS, School of Computing Research Group, "A brief summary of LexRank: Graph-based Lexical Centrality as Salience in Text Summarization,” 2010.
[36] Powers, David M W (2011). "Evaluation: From Precision, Recall and F-Measure to ROC, Informedness, Markedness Correlation" (PDF). Journal of Machine Learning Technologies. 2 (1): 37–63.
[37] H. Enten, "Why Republicans lost another deep-red state in Louisiana governor’s election," CNN, Nov 2019.
[38] PadmaPriya, G. Duraiswamy, K.. (2014). An approach for text summarization using deep learning algorithm. Journal of Computer Science. 10. 1-9. 10.3844/jcssp.2014.1.9.
[39] S. Gupta, "Overview of Text Similarity Metrics in Python," Towards Data Science, 2018.
APPENDIX A
Single Document Summarization
For the single document, summarization, summarization algorithms were
implemented on every single document. The original text became the reference and
the summarized text became the hypothesis to evaluate the ROUGE score.
ROUGE-1
Algorithm F-1 Score Precision Recall
LSA 0.158 1 0.856
LexRank 0.796 1 0.0414
TextRank 0.59 1 0.304
Reduction 0.59 1 0.03
Table 3: ROUGE-1 evaluation of single document for DUC2003 Summary
ROUGE-2
Algorithm F-1 Score Precision Recall
LSA 0.094 1 0.049
LexRank 0.0466 1 0.0238
TextRank 0.031 1 0.016
Reduction 0.0313 1 0.159
Table 4: ROUGE-2 evaluation of single-document DUC2003 Summary
ROUGE-1
Algorithm F-1 Score Precision Recall
LSA 0.238 1 0.135
LexRank 0.226 1 0.127
TextRank 0.238 1 0.133
Reduction 0.238 1 0.135
ROUGE-2
Algorithm F-1 Score Precision Recall
LSA 0.162 1 0.884
LexRank 0.167 1 0.909
TextRank 0.16 1 0.088
Reduction 0.162 1 0.088
APPENDIX B
Multi-Document Summarization
For multiple document summarization, input documents were combined into one
text file and was treated as one single document and was processed it in such a way
that importance was given to sentences with numbers, title-related words and proper
nouns. This way, there was a lower chance of missing out on important text. The
documents were also cross checked for repetition, to avoid redundancy.
ROUGE-1
Algorithm F-1 Score Precision Recall
LSA 0.99 1 1 LexRank 0.99 1 1 TextRank 0.56 0.47 0.41 Reduction 0.99 1 1 LSA + RBM 0.31 0.33 0.47 LexRank + RBM 0.707 0.979 0.553 TextRank + RBM 0.36 0.39 0.51 Reduction + RBM 0.627 0.979 0.554
Table 7: ROUGE-1 evaluation of multi - document for DUC2003 Summary
ROUGE-2
Algorithm F-1 Score Precision Recall
LSA 0.99 1 1 LexRank 0.99 1 1 TextRank 0.56 0.47 0.41 Reduction 0.99 1 1 LSA + RBM 0.627 0.948 0.457 LexRank + RBM 0.635 0.1 0.465 TextRank + RBM 0.36 0.39 0.51 Reduction + RBM 0.63 1 0.465
ROUGE-1
Algorithm F-1 Score Precision Recall
LSA 0.074 0.41 0.04 LexRank 0.226 1 0.127 TextRank 0.56 0.47 0.41 Reduction 0.99 1 1 LSA + RBM 0.635 1 0.465 LexRank + RBM 0.635 0.465 0.386 TextRank + RBM 0.36 0.39 0.51 Reduction + RBM 0.556 0.989 0.386
Table 9: ROUGE-1 evaluation of multi - document for DUC2004 Summary
ROUGE-2
Algorithm F-1 Score Precision Recall
LSA 0.074 0.41 0.04 LexRank 0.167 1 0.909 TextRank 0.56 0.47 0.41 Reduction 0.99 1 1 LSA + RBM 0.556 0.989 0.386 LexRank + RBM 0.41 0.44 0.56 TextRank + RBM 0.36 0.39 0.51 Reduction + RBM 0.556 0.989 0.386