Background and Purpose Speech-in-noise perception deficits have been demonstrated in patients with mild cognitive impairment (MCI). However, it remains unclear whether the im-pairment of speech perception varies between MCI subtypes. The purpose of this study was twofold: 1) to compare speech perception performance among MCI subgroups, and 2) to identify the cognitive domains specifically related to speech-in-noise perception.
Methods We studied 46 patients with MCI and 39 hearing-threshold-matched cognitively normal elderly (CNE) subjects. Two different patient classifications were used: 1) patients with amnestic mild cognitive impairment (aMCI) (n=21) or nonamnestic mild cognitive impair-ment (naMCI) (n=25), and 2) patients with frontal-executive dysfunction (FED) (n=16) or without FED (n=30). All of the subjects underwent audiometric, neuropsychological, and speech perception assessments. Speech-in-noise perception was measured using sentence recognition tests in the presence of two types of background noise at four levels.
Results First, as the level of background noise increased, the MCI with FED group scored low-er than both the MCI without FED and CNE groups undlow-er both types of noise. Second, both the naMCI and aMCI groups scored lower than the CNE group, but there were no differences be-tween the naMCI and aMCI groups in sentence recognition under any noise conditions. Third, significant correlations were found between sentence recognition and executive function scores both in the MCI groups and in the CNE group.
Conclusions Our findings suggest that frontal-executive function is strongly related to speech-in-noise perception and that MCI patients with FED have greater deficits in speech-speech-in-noise per-ception compared to other subgroups of MCI.
Key Words mild cognitive impairment, frontal-executive dysfunction, speech-in-noise perception, central auditory processing.
Association between Frontal-Executive Dysfunction and
Speech-in-Noise Perception Deficits
in Mild Cognitive Impairment
INTRODUCTION
Age-related hearing impairment is the most-prevalent form of sensory loss and is a major
cause of chronic disability in older age.1,2 Impairments in the peripheral hearing and
cen-tral auditory processing (CAP) can contribute to age-related hearing impairment.1 CAP
dysfunction is typically characterized by difficulty in perceiving and understanding speech
in noisy situations.1,3 Several longitudinal studies have suggested that CAP dysfunction
could be the main factor contributing to an increased risk of cognitive decline and incident
dementia.4–6 Specifically, the presence of CAP dysfunction was associated with a 10-fold higher
risk of developing Alzheimer’s disease (AD).4 These findings also suggest that CAP
dysfunc-tion could be an early marker of cognitive disorders such as mild cognitive impairment (MCI) and AD.
Soo Jung Leea
Kyung Won Parkb
Lee-Suk Kimc
HyangHee Kimd
a Department of Audiology and Speech-Language Pathology, Daegu Catholic University, Gyeongsan, Korea
b Departments of Neurology and c Otolaryngology, Head and Neck Surgery,
Dong-A University College of Medicine, Busan, Korea
d Graduate Program
in Speech-Language Pathology and Department and Research Institute of Rehabilitation Medicine,
Yonsei University College of Medicine, Seoul, Korea
pISSN 1738-6586 / eISSN 2005-5013 / J Clin Neurol 2018;14(4):513-522 / https://doi.org/10.3988/jcn.2018.14.4.513
Received February 2, 2018 Revised May 21, 2018 Accepted May 23, 2018 Correspondence HyangHee Kim, PhD, CCC-SLP Graduate Program
in Speech-Language Pathology and Department and Research Institute of Rehabilitation Medicine,
Yonsei University College of Medicine, 50-1 Yonsei-ro, Seodaemun-gu, Seoul 03722, Korea
Tel +82-2-2228-3900 Fax +82-2-2227-7984 E-mail [email protected]
cc This is an Open Access article distributed under the terms of the Creative Commons Attribution Non-Com-mercial License (https://creativecommons.org/licenses/by-nc/4.0) which permits unrestricted non-comNon-Com-mercial use, distribution, and reproduction in any medium, provided the original work is properly cited.
Speech-in-Noise Perception Deficits in MCI
JCN
demonstrated that frontal-executive function affects speech-in-noise perception, the patients were also classified accord-ing to whether or not they had frontal-executive dysfunc-tion (FED). Applicadysfunc-tion of the first classificadysfunc-tion identified 25 patients with naMCI (2 men and 23 women) and 21 with aMCI (10 men and 11 women). For the second classi-fication, patients with FED had to meet the following criteria: 1) age- and education-adjusted scores below -1.0 SD in the animal-naming or phonemic-letter-naming tests of the
Con-trolled Oral Word Association Test (COWAT),11 and 2) age-
and education-adjusted scores below -1.0 SD in the
color-read-ing part of the Stroop test.12 Applying these criteria identified
16 patients with FED (6 men and 10 women) and 30 without FED (6 men and 24 women). The characteristics of the 46 MCI patients are provided in Table 1.
For a control group we recruited 39 cognitively normal older adults (14 men and 25 women) who met the follow-ing criteria: 1) no significant underlyfollow-ing medical, neurologi-cal, or psychiatric illness; 2) normal performance as defined by age- and education-adjusted scores above -1.0 SD in the Korean version of the Mini Mental State Examination
(K-MMSE),13 digit span (forward and backward),14 Seoul Verbal
Learning Test (SVLT) (immediate and delayed recall),15 and
COWAT (animal naming and three-phonemic-letter nam-ing); and 3) no subjective memory complaints.
All of the subjects had to meet the following inclusion criteria for hearing acuity: 1) no conductive components in tympanometry and pure-tone audiometry; 2) hearing
thresh-old levels of ≤25 dB HL at 0.5, 1, and 2 kHz, ≤40 dB HL at
4 kHz, and ≤70 dB HL at 8 kHz in each ear; 3) interaural
asymmetry in the pure-tone average (PTA) (average at 0.5, 1, 2, and 4 kHz) of no greater than 10 dB HL; 4) speech
dis-crimination score of ≥80% for each ear; and 5) no previous
or current use of hearing aids. Demographic data and audio-metric test results for each group are presented in Table 2. Speech perception is commonly measured using word and/
or sentence recognition tests. In the presence of background noise, listeners are required to recall words and/or entire sen-tences or keywords in sensen-tences as they have heard them. Speech-in-noise perception tests can utilize different types of background noise and different signal-to-noise ratios (SNRs). The SNR is defined as the ratio of the intensity of the target signal to that of the background noise, and it is not surpris-ing that speech perception becomes more challengsurpris-ing as the SNR decreases. Regarding the type of background noise, speech perception is cognitively more demanding when it is
masked by interfering speech than meaningless noise.7
The findings of the few previous studies that have investi-gated the association between speech-in-noise perception and MCI or probable AD suggest that speech-in-noise perception
deficits exist in patients with MCI.1 A recent study explored
the speech perception performance for different types of
background noise in patients with MCI.8 That study found
that patients with MCI required an SNR that was 3 dB high-er than that for age-matched normal controls to reach scores of 50% on sentence recognition tests in the presence of
infor-mative maskers. In our previous study,9 the patients with
am-nestic mild cognitive impairment (aMCI) scored significantly lower than both the older adults and the younger adults only when the noise level was high (SNR=-5 dB) in the sentence recognition test. However, because (to the best of our knowl-edge) no previous studies have focused on speech-in-noise perception according to MCI subtypes, it remains unclear whether speech perception is affected by differences in the im-paired cognitive domains.
In the present study we aimed to compare speech percep-tion performance measured in a sentence recognipercep-tion test among MCI subgroups and cognitively normal elderly (CNE) subjects in two types of background noise conditions (speech-spectrum noise and multitalker-babble noise) at four SNRs (+5, 0, -2, and -5 dB). We also aimed to identify the cognitive domains that are specifically related to speech-in-noise per-ception in each study group.
METHODS
Participants
We recruited 46 patients with MCI (aged 55 to 80 years) from the Memory and Dementia Clinic at Dong-A Universi-ty Medical Center (Busan, Korea). A diagnosis of MCI was
made according to Petersen’s criteria.10 Two different patient
classifications were used in the present study: 1) based on the
conventional clinical classification of MCI,10 MCI patients
were classified into aMCI or nonamnestic mild cognitive im-pairment (naMCI), and 2) given that previous studies have
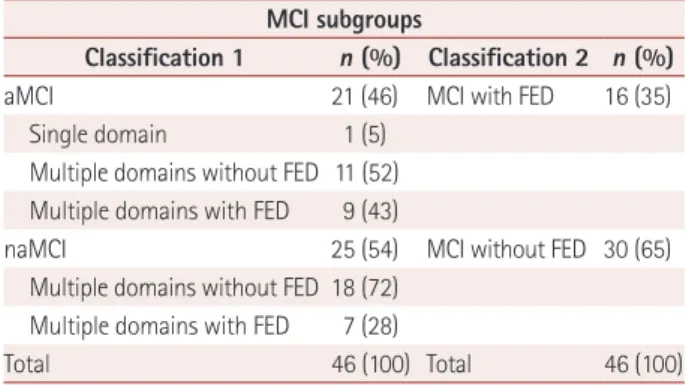
Table 1. Numbers of patients with MCI in the different subgroups
MCI subgroups
Classification 1 n (%) Classification 2 n (%)
aMCI 21 (46) MCI with FED 16 (35)
Single domain 1 (5) Multiple domains without FED 11 (52) Multiple domains with FED 9 (43)
naMCI 25 (54) MCI without FED 30 (65) Multiple domains without FED 18 (72)
Multiple domains with FED 7 (28)
Total 46 (100) Total 46 (100)
Data are n (%) values.
aMCI: amnestic mild cognitive impairment, FED: frontal-executive dys-function, MCI: mild cognitive impairment, naMCI: nonamnestic mild cognitive impairment.
Lee SJ et al.
JCN
Our study was approved by the Institutional Review Board of Dong-A University Medical Center (IRB No. 16-048). We obtained a completed written-consent form from each par-ticipant before starting the experimental procedures.
Experimental measurements
Audiometric assessments
Pure-tone audiometry, speech audiometry, and tympanom-etry tests were applied to all participants. Air- and bone-con-duction thresholds were measured with a clinical pure-tone audiometer (GSI 61; Grason-Stadler, Eden Prairie, MN, USA). The PTA was calculated as the average of the values at 0.5, 1, 2, and 4 kHz for each ear. The speech reception threshold, speech discrimination score, and most-comfortable loudness level were determined for each ear. Tympanometry was con-ducted to assess the status of the middle ear with a clinical impedance audiometer (TYMSTAR; Grason-Stadler, Eden Prairie, MN, USA). The audiometric test results are present-ed in Table 2.
Neuropsychological assessments
All MCI patients underwent a standardized
neuropsychologi-cal test, the Seoul Neuropsychologineuropsychologi-cal Screening Battery,15
which covers five cognitive domains: attention, language,
vi-suospatial function, memory (visual and verbal), and fron-tal-executive function. We also applied the Korean version of
the Boston Naming Test16 and the Rey Complex Figure Test,
SVLT, COWAT, Stroop test, and forward and backward digit span tests. Also, the short version of the Geriatric Depression
Scale (SGDS)17 comprising 15 questions was used to evaluate
the depression level. Each neuropsychological assessment was applied to all of the MCI patients, while only the K-MMSE, SGDS, SVLT, COWAT, and digit span tests were applied to the CNE group. Table 3 compares the neuropsychological test scores between the MCI subgroups.
Tests of speech perception in noise
Stimuli
We used a standardized speech perception test, the Korean
Speech Audiometry,18 which includes Korean
standard-sen-tence lists for adults and comprises eight sets of senstandard-sen-tence lists with keywords. Each set of sentence lists contains 10 sen-tences with 40 keywords (e.g., what is your favorite food?). Speech stimuli spoken by a male speaker with a standard Ko-rean accent were recorded on a compact disc. We extracted audio files of each sentence list from the compact disc and converted them into WAV files. We then mixed them with speech-spectrum noise (i.e., nonspeech masker) and multi-Table 2. Demographic data and audiometric test results for each group
Classification 1 Classification 2
CNE (n=39) p‡ p§ naMCI (n=25) aMCI (n=21) MCI with FED (n=16) MCI without FED (n=30)
Demographics
Age, years 67.36±6.38 68.47±6.23 66.56±6.12 68.56±6.34 63.92±4.84 0.007* 0.004*
Men/women 2/23 10/11 6/10 6/24 14/25
Education, years 7.16±4.16 9.45±4.27 7.50±4.57 8.58±4.22 11.60±3.95 <0.001† 0.001* K-MMSE score 25.44±3.01 25.85±2.61 24.56±2.47 26.20±2.85 28.97±1.11 <0.001† <0.001† Audiometric test results averaged across both ears∥
PTA 18.96±5.00 20.15±5.95 21.35±5.23 18.52±5.35 18.72±4.52 0.567 0.149 SRT 19.10±4.72 20.23±4.73 21.40±4.07 18.66±4.81 19.03±4.81 0.620 0.150 MCL 59.10±4.83 60.35±4.76 61.09±4.46 58.91±4.85 59.10±4.60 0.573 0.280 SDS 95.68±3.90 95.71±4.25 95.75±4.25 95.66±3.96 97.53±2.98 0.070 0.069 0.25 kHz 16.60±5.58 13.92±6.25 17.34±5.35 14.33±6.12 11.60±4.53 0.002* 0.001* 0.5 kHz 16.40±6.73 13.92±7.68 17.18±6.94 14.25±7.25 15.06±4.07 0.373 0.280 1 kHz 17.10±5.48 17.61±6.95 18.43±6.57 16.75±5.91 17.24±5.15 0.952 0.634 2 kHz 18.70±6.21 20.47±6.25 21.40±6.70 18.50±5.82 18.46±5.02 0.406 0.181 4 kHz 25.60±9.22 30.83±9.66 30.93±8.41 26.41±10.07 25.89±8.61 0.091 0.166 8 kHz 50.20±20.55 48.69±18.53 50.78±15.10 48.83±21.63 40.00±16.79 0.063 0.062 Data are mean±SD values.
*p<0.01, †p<0.001, ‡One-way ANOVA was used to assess differences between the naMCI, aMCI, and CNE groups, §One-way ANOVA was used to assess differences between the MCI with FED, MCI without FED, and CNE groups, ∥Audiometric test results are expressed as dB HL values, except for SDS being expressed as percentages.
aMCI: amnestic mild cognitive impairment, CNE: cognitively normal elderly, FED: frontal-executive dysfunction, K-MMSE: Korean version of the Mini Mental State Examination, MCI: mild cognitive impairment, MCL: most-comfortable loudness level, naMCI: nonamnestic mild cognitive impairment, PTA: pure-tone average, SDS: speech discrimination score, SRT: speech reception threshold.
Speech-in-Noise Perception Deficits in MCI
JCN
talker-babble noise (with three talkers) (i.e., competing speech masker) at various SNRs using Adobe Audition software (ver-sion 3.0; Adobe Systems, San Jose, CA, USA). Different SNRs were obtained by changing the level of the speech sounds while keeping the level of background noise fixed.
Procedures
Speech perception tests were conducted in a sound-attenu-ated booth. The speech stimuli masked by background noise were delivered from a laptop computer connected to an au-diometer and presented binaurally via headphones (TDH-50; Telephonics, Farmingdale, NY, USA). Each sentence test was conducted at four noise levels (SNRs of +5, 0, -2, and -5 dB)
under each type of masking noise (speech-spectrum noise and multitalker-babble noise). To prevent order and fatigue ef-fects, the order of the test lists and noise conditions were ran-domized for each participant. Participants were told that a speech signal masked by noise would be presented and that they should listen carefully to each sentence and repeat the en-tire sentence after hearing it. The recorded experiments began after some practicing once it was clear that each participant understood the instructions. Performance was quantified as the percentage of correctly repeated keywords in the sentences.
Statistical analysis
First, a repeated-measures analysis of covariance (ANCOVA) Table 3. Comparisons of neuropsychological test scores between MCI subgroups
Classification 1
p Classification 2 p
naMCI aMCI MCI with FED MCI without FED
K-MMSE 25.44±3.01 25.85±2.61 0.622 24.56±2.47 26.20±2.85 0.059
SGDS 3.76±2.89 6.95±4.48 0.008† 6.06±4.58 4.76±3.65 0.300
Attention: digit span
Forward 5.76±1.42 6.19±1.63 0.344 6.06±1.65 5.90±1.47 0.734
Backward 3.08±0.86 3.23±0.83 0.532 2.81±0.65 3.33±0.88 0.044*
Language: K-BNT 39.64±7.47 43.00±7.31 0.132 39.81±6.22 41.90±8.12 0.375 Visuospatial function
RCFT copy 28.82±6.73 31.97±5.77 0.098 28.75±7.93 31.06±5.46 0.308
RCFT copy time, sec 305.36±141.79 239.00±107.52 0.085 285.62±147.12 269.43±122.69 0.693 Verbal memory: SVLT Immediate recall 18.72±4.25 13.85±4.26 <0.001‡ 14.00±4.09 17.83±4.78 0.009† Delayed recall 5.84±1.57 1.80±1.36 <0.001‡ 3.12±2.27 4.46±2.52 0.083 Recognition 20.20±1.55 18.33±2.92 0.008† 18.06±2.99 20.03±1.79 0.008† Visual memory: RCFT Immediate recall 9.82±5.45 8.61±6.14 0.486 8.71±6.53 9.56±5.37 0.639 Delayed recall 10.70±5.40 8.45±7.00 0.226 9.03±7.04 10.01±5.82 0.614 Recognition 19.36±2.03 18.42±2.59 0.180 18.50±2.96 19.16±1.93 0.362 Frontal-executive function COWAT: semantic Animals 12.00±3.73 11.66±3.32 0.753 10.37±3.03 12.63±3.54 0.036* Supermarket items 14.04±4.79 12.85±4.33 0.389 11.43±3.57 14.60±4.72 0.024* COWAT: phonemic (Korean letters)
‘ㄱ’ (/g/) 5.24±3.97 5.14±2.45 0.923 4.00±2.06 5.83±3.71 0.037*
‘ㅇ’ (/o/) 5.24±3.46 4.71±3.39 0.608 3.00±2.42 6.06±3.40 0.003†
‘ㅅ’ (/s/) 5.12±3.55 5.47±3.01 0.718 4.81±3.08 5.53±3.41 0.484
Phonemic, total 15.60±9.56 15.33±7.34 0.917 11.81±5.76 17.43±9.19 0.032* Stroop test: word reading 104.08±21.80 109.33±9.33 0.310 100.12±26.18 109.86±8.70 0.167
Time per item, sec 1.12±1.37 0.78±0.27 0.267 1.36±1.68 0.76±0.25 0.175 Stroop test: color reading 75.24±23.02 61.23±27.15 0.065 46.93±20.78 80.53±19.87 <0.001‡
Time per item, sec 1.68±0.61 1.85±0.61 0.342 2.14±0.61 1.55±0.51 0.001† Data are mean±SD values.
*p<0.05, †p<0.01, ‡p<0.001.
aMCI: amnestic mild cognitive impairment, COWAT: Controlled Oral Word Association Test, FED: frontal-executive dysfunction, K-BNT: Korean version of the Boston Naming Test, K-MMSE: Korean version of the Mini Mental State Examination, MCI: mild cognitive impairment, naMCI: nonamnestic mild cognitive impairment, RCFT: Rey Complex Figure Test, SGDS: short version of the Geriatric Depression Scale, SVLT: Seoul Verbal Learning Test.
Lee SJ et al.
JCN
was carried out with noise levels (SNRs of +5, 0, –2, and –5dB) and noise types (speech-spectrum noise and multitalk-er-babble noise) as within-subject factors, and group (classi-fication 1: naMCI, aMCI, and CNE groups; classi(classi-fication 2: MCI with FED, MCI without FED, and CNE groups) as a between-subjects factor. Second, a repeated-measures AN-COVA was carried out with noise level as a within-subject factor and group as a between-subjects factor for each type of background noise. Post-hoc analyses were conducted us-ing pairwise comparisons with Bonferroni corrections to ex-amine the differences among the three groups in the pres-ence of each type of noise. Third, differpres-ences between groups in the rates of functional decline in speech perception perfor-mance for different noise levels were examined using linear mixed-effect models with random intercepts. Fourth, partial correlation coefficients were computed by controlling for the PTA in each study group to examine which cognitive domains were significantly correlated with speech perception
perfor-mance. The alpha level was set at p=0.05, and statistical
anal-yses were carried out using SPSS software (version 23.0; IBM Corp., Armonk, NY, USA).
RESULTS
Comparisons of sentence recognition scores among
the MCI with FED, MCI without FED, and CNE
groups
After controlling for age, we found a significant interaction
effect of group by noise level by noise type (F6,158=3.013, p=
0.008). Other significant interaction effects were group by
noise level (F6,158=9.647, p<0.001), group by noise type (F2,81=
8.368, p<0.001), and noise level by noise type (F3,79=4.696, p=
0.005). We therefore analyzed the interaction between group and noise level separately for each type of noise. First, for the speech-spectrum noise condition, a significant interaction
effect between group and noise level was found (F6,158=5.476,
p<0.001). There were also significant main effects of group
(F2,81=18.360, p<0.001) and noise level (F3,79=5.418, p=0.002).
Second, for the multitalker-babble noise condition, we also found a significant interaction effect between group and noise
level (F6,158=10.316, p<0.001). Although there was a significant
main effect of group (F2,81=31.600, p<0.001), we found no
significant main effect of noise level (F3,79=1.311, p=0.277).
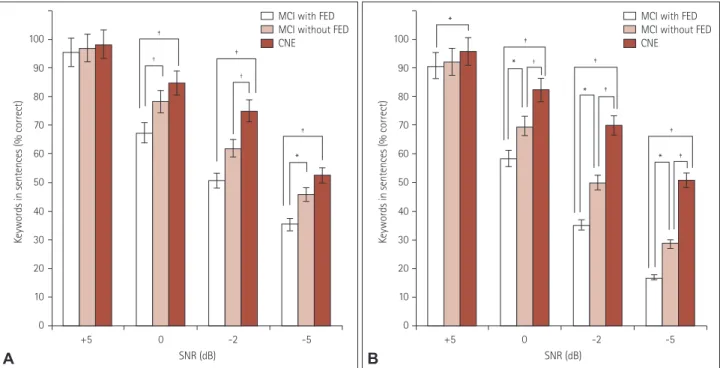
Fig. 1 presents the results obtained in post-hoc analyses showing the differences in sentence recognition scores under speech-spectrum noise (Fig. 1A) and multitalker-babble noise (Fig. 1B) conditions among the three groups according to different SNRs.
Comparisons of sentence recognition scores among
the naMCI, aMCI, and CNE groups
After controlling for age, we found a significant interaction
ef-fect of group by noise level by noise type (F6,158=3.538, p=0.003).
Other significant interaction effects were group by noise level (F6,158=7.331, p<0.001), group by noise type (F2,81=8.239, p=
0.001), and noise level by noise type (F3,79=4.670, p=0.005).
+5 0 -2 -5 SNR (dB) 100 90 80 70 60 50 40 30 20 10 0
Keywords in sentences (% correct)
* * * * † ‡ ‡ ‡ ‡ ‡
MCI with FED MCI without FED CNE +5 0 -2 -5 SNR (dB) 100 90 80 70 60 50 40 30 20 10 0
Keywords in sentences (% correct)
* † † ‡ ‡ ‡
MCI with FED MCI without FED CNE
A B
Fig. 1. Percentage of keywords correctly recognized according to SNR for speech-spectrum noise (A) and multitalker-babble noise (B) in the MCI with FED, MCI without FED, and CNE groups. *p<0.05, †p<0.01, ‡p<0.001. CNE: cognitively normal elderly, FED: frontal-executive dysfunction, MCI: mild cognitive impairment, SNR: signal to noise ratio.
Speech-in-Noise Perception Deficits in MCI
JCN
We therefore analyzed the interaction between group and noise level separately for each type of noise. First, for the speech-spectrum noise condition, a significant interaction effect
be-tween group and noise level was found (F6,158=4.528, p<0.001).
There were also significant main effects of group (F2,81=11.989,
p<0.001) and noise level (F3,79=3.925, p=0.011). Second, for
the multitalker-babble noise condition, we also found a
signifi-cant interaction effect between group and noise level (F6,158=
8.272, p<0.001). Although there was a significant main effect
of group (F2,81=25.018, p<0.001), we found no significant
main effect of noise level (F3,79=1.235, p=0.302).
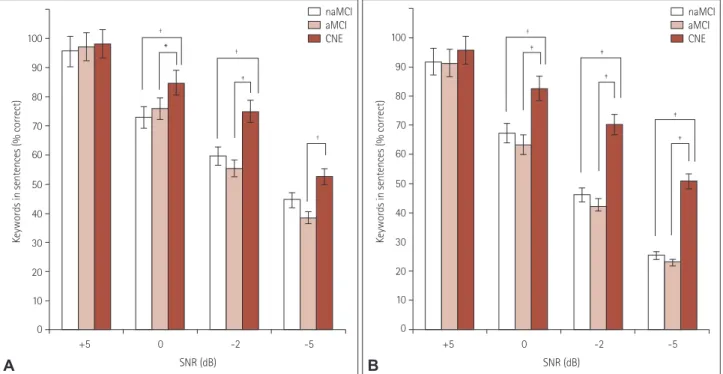
Fig. 2 presents the results obtained in post-hoc analyses showing the differences in sentence recognition scores un-der speech-spectrum noise (Fig. 2A) and multitalker-babble noise (Fig. 2B) conditions among the three groups accord-ing to different SNRs.
Comparisons of rates of functional decline in
speech perception performance across noise levels
between groups
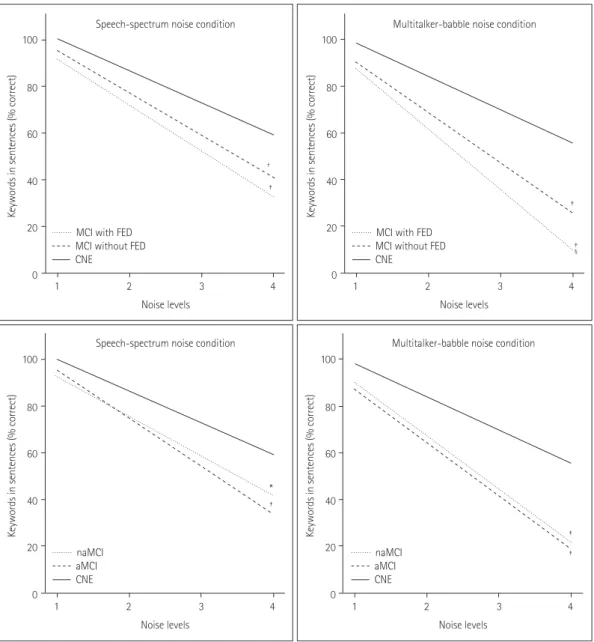
We additionally examined differences between groups in the rates of functional decline in speech perception performance across noise levels. First, we compared the rates of decline among the MCI with FED, MCI without FED, and CNE groups. In the speech-spectrum noise condition, we found that compared to the CNE group, the decline was significantly faster in the MCI with FED group (difference in slope=-6.077,
p<0.001) and the MCI without FED group (difference in
slope=-4.525, p=0.001). The decline did not differ
signifi-cantly between the MCI with FED and MCI without FED
groups (difference in slope=-1.552, p=0.393). In the
multitalker-babble noise condition, we also found that compared to the CNE group, the decline was significantly faster in the MCI with
FED group (difference in slope=-11.587, p<0.001) and the MCI
without FED group (difference in slope=-7.251, p< 0.001). The
decline was also significantly faster in the MCI with FED group than in the MCI without FED group (difference in slope=
-4.335, p=0.038).
Second, we compared the rates of decline among the naM-CI, aMnaM-CI, and CNE groups. In the speech-spectrum noise condition, we found that compared to the CNE group, the decline was significantly faster in the naMCI group
(differ-ence in slope=-3.588, p=0.013) and the aMCI group
(differ-ence in slope=-6.823, p<0.001). The decline did not differ
sig-nificantly between the naMCI and aMCI groups (difference
in slope=3.234, p=0.054). In the multitalker-babble noise
condition, we also found that compared to the CNE group, the decline was significantly faster in the naMCI group
(difference in slope=-8.803, p<0.001) and the aMCI group
(difference in slope=-8.707, p<0.001). Also, there was no
significant difference between the naMCI and aMCI groups
(difference in slope=-0.095, p=0.962).
Fig. 3 presents the differences between groups in the rates of functional decline in speech perception performance
+5 0 -2 -5 SNR (dB) 100 90 80 70 60 50 40 30 20 10 0
Keywords in sentences (% correct)
† ‡ ‡ ‡ ‡ ‡ naMCI aMCI CNE +5 0 -2 -5 SNR (dB) 100 90 80 70 60 50 40 30 20 10 0
Keywords in sentences (% correct)
* † † † ‡ naMCI aMCI CNE A B
Fig. 2. Percentage of keywords correctly recognized according to SNR for speech-spectrum noise (A) and multitalker-babble noise (B) in the naM-CI, aMnaM-CI, and CNE groups. *p<0.05, †p<0.01, ‡p<0.001. aMCI: amnestic mild cognitive impairment, CNE: cognitively normal elderly, MCI: mild cog-nitive impairment, naMCI: nonamnestic mild cogcog-nitive impairment, SNR: signal to noise ratio.
Lee SJ et al.
JCN
across noise levels.
Correlations between sentence recognition scores
at an SNR of -5 dB under multitalker-babble noise
(the most-difficult listening condition) and
neuropsychological test scores for each group
Neuropsychological test results were converted into age- and education-adjusted z scores. After controlling for PTA, we found significant correlations between sentence recognition scores and scores in the animal-naming test of the COWAT
for the aMCI (r=0.615, p=0.004) and MCI with FED (r=0.571,
p=0.026) groups. We found no significant correlations for
the naMCI and MCI without FED groups. Significant
corre-lations of sentence recognition scores with scores in the digit
span backward test (r=0.352, p=0.030) and in the
phonemic-letter-naming test of the COWAT (r=0.341, p=0.036) were
found for the CNE group (Table 4).
DISCUSSION
Patients with MCI exhibit CAP dysfunction characterized by deficits in speech-in-noise perception. However, it remains unclear whether the impairment of speech-in-noise percep-tion varies between the clinical subtypes of MCI. Therefore, in the current study we compared speech perception perfor-mance among MCI subgroups under various noise conditions. 1 2 3 4 1 2 3 4
1 2 3 4 1 2 3 4
Noise levels Speech-spectrum noise condition Speech-spectrum noise condition
Multitalker-babble noise condition Multitalker-babble noise condition
Noise levels Noise levels Noise levels 100 80 60 40 20 0 100 80 60 40 20 0 100 80 60 40 20 0 100 80 60 40 20 0
Keywords in sentences (% correct)
Keywords in sentences (% correct)
Keywords in sentences (% correct)
Keywords in sentences (% correct)
* † ‡ ‡ ‡ ‡ ‡ ‡ naMCI aMCI CNE
MCI with FED MCI without FED CNE
MCI with FED MCI without FED CNE
naMCI aMCI CNE
Fig. 3. Differences between groups in the rates of functional decline in speech perception performance across noise levels. Difference in slope: *p<0.05 vs. CNE, †p<0.01 vs. CNE, ‡p<0.001 vs. CNE, §p<0.05 vs. MCI without FED. aMCI: amnestic mild cognitive impairment, CNE: cognitively nor-mal elderly, FED: frontal-executive dysfunction, MCI: mild cognitive impairment, naMCI: nonamnestic mild cognitive impairment.
Speech-in-Noise Perception Deficits in MCI
JCN
We also studied cognitive domains specifically related to speech-in-noise perception.
The first major finding of our study was that the MCI with FED group scored lower than both the MCI without FED and CNE groups under both types of background noise as its level increased. However, the speech perception did not differ significantly between the naMCI and aMCI groups in any noise condition. This finding might have been due to the clinical characteristics of our MCI patients. Both the aMCI and naMCI groups included comparable numbers of patients with FED (Table 1), which was probably responsible for the lack of any intergroup difference in the recognition scores. When MCI patients were reclassified according to whether or not they had FED, the MCI with FED group showed
sig-nificantly lower scores than the MCI without FED group un-der most of the noise conditions. Although the group differ-ences remained consistent as the SNR decreased from 0 to -5 dB in the multitalker-babble noise condition, there were in-consistencies in the group differences in the speech-spectrum noise condition as the noise levels varied. In the presence of speech-spectrum noise, as the SNR decreased from +5 to 0 dB, the performance declined rapidly first in the MCI with FED group, while the MCI without FED group performed consistently relative to the control group. However, as the SNR decreased further, from 0 to -2 dB, both the MCI with and without FED groups showed significantly lower scores than the CNE group. When the SNR reached -5 dB, the performance of the CNE group also declined, resulting in no group differ-Table 4. Partial correlation coefficients for sentence recognition scores at a signal-to-noise ratio of –5 dB under multitalker-babble noise with neu-ropsychological test scores adjusted by the pure-tone average in each group
Classification 1 Classification 2
CNE‡ naMCI aMCI MCI with FED MCI without FED
K-MMSE 0.333 0.044 -0.349 0.339 0.167
Attention: digit span
Forward 0.132 0.179 -0.318 0.315 0.028 Backward 0.157 -0.171 -0.351 0.045 0.352* Language: K-BNT -0.011 -0.108 -0.402 -0.033 -Visuospatial function RCFT copy 0.141 -0.069 -0.106 0.086 -RCFT copy time 0.084 -0.365 -0.104 -0.117 -Verbal memory: SVLT Immediate recall 0.160 -0.008 -0.326 0.147 0.136 Delayed recall 0.085 -0.101 -0.097 0.061 0.049 Recognition 0.010 -0.080 -0.196 -0.020 -0.132 Visual memory: RCFT Immediate recall -0.066 -0.427 -0.215 -0.268 -Delayed recall -0.025 -0.390 -0.113 -0.259 -Recognition 0.131 -0.299 -0.386 0.111 -Frontal-executive function COWAT: semantic Animals -0.277 0.615† 0.571* -0.228 0.249 Supermarket items 0.227 0.088 -0.220 0.234 0.287
COWAT: phonemic (Korean letters)
‘ㄱ’ (/g/) 0.195 0.342 0.080 0.201 0.082
‘ㅇ’ (/o/) 0.098 0.022 -0.411 0.087 0.341*
‘ㅅ’ (/s/) 0.065 0.033 -0.044 0.030 0.228
Phonemic, total 0.141 0.159 -0.210 0.130 0.266
Stroop test: word reading 0.106 0.207 0.015 0.145
-Time per item 0.060 0.094 -0.072 0.244
-Stroop test: color reading 0.259 0.214 0.002 0.149
-Time per item 0.139 -0.078 -0.305 0.009
-*p<0.05, †p<0.01, ‡Only the K-MMSE, SVLT, COWAT, and digit span tests were applied to the CNE group.
aMCI: amnestic mild cognitive impairment, CNE: cognitively normal elderly, FED: frontal-executive dysfunction, K-BNT: Korean version of the Boston Naming Test, K-MMSE: Korean version of the Mini Mental State Examination, MCI: mild cognitive impairment, naMCI: nonamnestic mild cognitive impairment, RCFT: Rey Complex Figure Test, SVLT: Seoul Verbal Learning Test.
Lee SJ et al.
JCN
ence between the MCI without FED and CNE groups.How-ever, the MCI with FED group still performed worse than the CNE group.
When we additionally examined differences between groups in the rates of functional decline across noise levels, the MCI with FED and the MCI without FED groups exhibited signif-icantly faster declines than the CNE group both in the speech-spectrum noise and multitalker-babble noise conditions. The decline was significantly faster in the MCI with FED group than in the MCI without FED group in the multitalker-bab-ble noise condition, but did not differ significantly between these two groups in the speech-spectrum noise condition. The discrepancy in performance among the groups was greater in the presence of multitalker-babble noise than in the pres-ence of speech-spectrum noise due to competing speech (e.g., babble noise) being cognitively more demanding than
mean-ingless noise (e.g., speech-spectrum noise).19 It has been
dem-onstrated previously that the cognitive processing load of speech perception is significantly increased by semantic
in-terference.19 Cognitive factors that are particularly relevant to
speech-on-speech perception are working memory and the ability to ignore irrelevant information contained in the
in-terfering speech.20,21 The Ease of Language Understanding
model describes these cognitive functions as working-mem-ory-capacity-dependent executive mechanisms that are
criti-cal to speech perception.22,23
Our findings indicate that impairments in frontal-execu-tive function are associated with speech-in-noise perception
deficits. Consistent with our previous study,9 we found
sig-nificant correlations between speech-in-noise perception per-formance and scores in verbal fluency tests in the MCI sub-groups. As a test of frontal-executive function, verbal fluency requires participants to generate as many words as possible within a certain time. Successfully performing this task re-quires subjects to keep earlier responses constantly updated in their working memory and to inhibit irrelevant and
repet-itive responses.24 Likewise, in the speech-in-noise perception
test, participants are asked to choose the most-probable word as soon as possible from among several lexical entries activat-ed by perceptual ambiguity due to background noise. They must simultaneously suppress activations of context-irrele-vant words and remember previously perceived information. As mentioned above, these executive mechanisms become even more important when the target speech is masked by meaningful speech, because listeners need to inhibit the pro-cessing of competing information and focus their attention
selectively on the target speech.25,26
The present study found that speech-in-noise perception was significantly correlated with scores in the phonemic ver-bal fluency and backward digit span tests in the CNE group. In
the backward digit span test, which measures working
memo-ry,27 subjects are asked to reorder items that they have heard.
Working memory is one of the core executive functions along with response inhibition, interference control (selective
atten-tion and cognitive inhibiatten-tion), and cognitive flexibility.27 Tasks
of working memory capacity and frontal-executive function
share a common underlying executive attention component.28
Our findings indicate that the effect of frontal-executive func-tion on speech-in-noise percepfunc-tion is not specific to patients
with MCI, which is consistent with a previous report3 of an
association between frontal-executive function and speech-in-noise perception in older persons both with and without mem-ory loss. In other words, frontal-executive function may be im-portant in speech-in-noise perception in older listeners both with and without cognitive deficits.
Together the results obtained in the current study suggest that frontal-executive function is strongly related to speech-in-noise perception, and thus patients with FED have greater deficits in speech-in-noise perception compared to other sub-groups of MCI. Patients with FED may also experience more problems in perceiving and understanding speech masked by intelligible speech (e.g., coffee-shop conversations) than nonspeech noise (e.g., wind noise). Therefore, in order to im-prove speech perception and auditory comprehension in pa-tients with cognitive impairment, it would be useful to mini-mize the environmental background noise and in particular to try to avoid environments where interfering speech is pres-ent. For these patients, cognitive training focused on frontal-executive function and working memory as well as audiolog-ical rehabilitation (e.g., combined with amplification, if needed) can help improve their speech perception during everyday con-versations.
The results in the literature on speech perception indicate several issues that future studies need to address. Most im-portantly, considering that deficits in speech-in-noise per-ception are related to an increased risk of cognitive decline, longitudinal studies with large samples are needed to explore whether speech-in-noise perception deficits at baseline are re-lated to an increased risk of incident dementia according to MCI subgroups. Also, since previous studies indicated that CAP testing could be regarded in part as a measure of
cogni-tive function,1 it is important to establish the potential
useful-ness of the speech-in-noise perception test in diagnosing MCI. Conflicts of Interest
The authors have no financial conflicts of interest. Acknowledgements
This study was conducted in partial fulfillment of the requirements for the doctoral degree of the first author at the Graduate Program in Speech-Language Pathology at Yonsei University.
Speech-in-Noise Perception Deficits in MCI
JCN
REFERENCES
1. Panza F, Solfrizzi V, Logroscino G. Age-related hearing impairment-a risk factor and frailty marker for dementia and AD. Nat Rev Neurol
2015;11:166-175.
2. Albers MW, Gilmore GC, Kaye J, Murphy C, Wingfield A, Bennett DA, et al. At the interface of sensory and motor dysfunctions and Al-zheimer’s disease. Alzheimers Dement 2015;11:70-98.
3. Gates GA, Gibbons LE, McCurry SM, Crane PK, Feeney MP, Larson EB. Executive dysfunction and presbycusis in older persons with and without memory loss and dementia. Cogn Behav Neurol 2010;23:218-223.
4. Gates GA, Beiser A, Rees TS, D’Agostino RB, Wolf PA. Central audi-tory dysfunction may precede the onset of clinical dementia in peo-ple with probable Alzheimer’s disease. J Am Geriatr Soc 2002;50:482-488.
5. Gates GA, Anderson ML, McCurry SM, Feeney MP, Larson EB. Central auditory dysfunction as a harbinger of Alzheimer dementia.
Arch Otolaryngol Head Neck Surg 2011;137:390-395.
6. Gates GA, Cobb JL, Linn RT, Rees T, Wolf PA, D’Agostino RB. Cen-tral auditory dysfunction, cognitive dysfunction, and dementia in older people. Arch Otolaryngol Head Neck Surg 1996;122:161-167. 7. Mattys SL, Davis MH, Bradlow AR, Scott SK. Speech recognition in
adverse conditions: a review. Lang Cogn Process 2012;27:953-978. 8. Aimoni C, Prosser S, Ciorba A, Menozzi L, Soavi C, Zuliani G. Speech
audiometry tests in noise are impaired in older patients with mild cog-nitive impairment: a pilot study. Int Adv Otol 2014;10:228-233. 9. Lee SJ, Park KW, Kim LS, Kim H. Effects of noise level and cognitive
function on speech perception in normal elderly and elderly with am-nestic mild cognitive impairment. Cogn Behav Neurol 2016;29:68-77. 10. Petersen RC. Mild cognitive impairment as a diagnostic entity. J
In-tern Med 2004;256:183-194.
11. Kang YW, Jin JH, Na DL, Lee JH, Park JS. A normative study of the Korean version of Controlled Oral Word Association Test (COWAT) in the elderly. Kor J Clin Psychol 2000;19:385-392.
12. Lee JH, Kang YW, Na DL. Efficiencies of stroop interference indexes in healthy older adults and dementia patients. Kor J Clin Psychol 2000; 19:807-818.
13. Kang YW. A normative study of the Korean-Mini Mental State Exami-nation (K-MMSE) in the elderly. Korean J Psychol Gen 2006;25:1-12.
14. Kang YW, Chin JH, Na DL. A normative study of the digit span test for the elderly. Kor J Clin Psychol 2002;21:911-922.
15. Kang YW, Na DL. Seoul Neuropsychological Screening Battery (SNSB).
Seoul: Human Brain Research & Consulting Co., 2003.
16. Kim H, Na DL. Normative data on the Korean version of the Boston Naming Test. J Clin Exp Neuropsychol 1999;21:127-133.
17. Kang YW, Jang SM, Na DL. Seoul Neuropsychological Screening
Bat-tery (SNSB). 2nd ed. Seoul: Human Brain Research & Consulting Co.,
2012.
18. Lee JH, Jo SJ, Kim JS, Jang HS, Lim DH, Lee KW. Korean Speech
Au-diometry (KSA). Seoul: Hakjisa, 2010.
19. Koelewijn T, Zekveld AA, Festen JM, Rönnberg J, Kramer SE. Pro-cessing load induced by informational masking is related to linguis-tic abilities. Int J Otolaryngol 2012;2012:865731.
20. Gordon-Salant S, Cole SS. Effects of age and working memory capac-ity on speech recognition performance in noise among listeners with normal hearing. Ear Hear 2016;37:593-602.
21. Rönnberg J, Rudner M, Foo C, Lunner T. Cognition counts: a work-ing memory system for ease of language understandwork-ing (ELU). Int J
Audiol 2008;47 Suppl 2:S99-S105.
22. Rönnberg J, Lunner T, Zekveld A, Sörqvist P, Danielsson H, Lyxell B, et al. The ease of language understanding (ELU) model: theoretical, empirical, and clinical advances. Front Syst Neurosci 2013;7:31. 23. Rönnberg J, Rudner M, Lunner T, Zekveld AA. When cognition
kicks in: working memory and speech understanding in noise. Noise
Health 2010;12:263-269.
24. Shao Z, Janse E, Visser K, Meyer AS. What do verbal fluency tasks measure? Predictors of verbal fluency performance in older adults.
Front Psychol 2014;5:772.
25. Wild CJ, Yusuf A, Wilson DE, Peelle JE, Davis MH, Johnsrude IS. Ef-fortful listening: the processing of degraded speech depends critically on attention. J Neurosci 2012;32:14010-14021.
26. D’Ausilio A, Craighero L, Fadiga L. The contribution of the frontal lobe to the perception of speech. J Neurolinguistics 2012;25:328-335. 27. Diamond A. Executive functions. Annu Rev Psychol 2013;64:135-168. 28. McCabe DP, Roediger HL, McDaniel MA, Balota DA, Hambrick DZ.
The relationship between working memory capacity and executive functioning: evidence for a common executive attention construct.