Complete remission and early death after
intensive chemotherapy in patients aged 60
years or older with acute myeloid leukaemia: a
web-based application for prediction of
outcomes
Utz Krug, Christoph Röllig, Anja Koschmieder, Achim Heinecke, Maria Cristina Sauerland, Markus Schaich, Christian Thiede, Michael Kramer, Jan Braess, Karsten Spiekermann, Torsten Haferlach, Claudia Haferlach, Steffen Koschmieder, Christian Rohde, Hubert Serve, Bernhard Wörmann, Wolfgang Hiddemann, Gerhard Ehninger, Wolfgang E Berdel, Thomas Büchner*, Carsten Müller-Tidow*, for the German Acute Myeloid Leukaemia Cooperative Group and the Study Alliance Leukemia Investigators†
Summary
Background About 50% of patients (age ≥60 years) who have acute myeloid leukaemia and are otherwise medically healthy (ie, able to undergo intensive chemotherapy) achieve a complete remission (CR) after intensive chemotherapy, but with a substantially increased risk of early death (ED) compared with younger patients. We verified the association of standard clinical and laboratory variables with CR and ED and developed a web-based application for risk assessment of intensive chemotherapy in these patients.
Methods Multivariate regression analysis was used to develop risk scores with or without knowledge of the cytogenetic and molecular risk profiles for a cohort of 1406 patients (aged ≥60 years) with acute myeloid leukaemia, but otherwise medically healthy, who were treated with two courses of intensive induction chemotherapy (tioguanine, standard-dose cytarabine, and daunorubicin followed by high-dose cytarabine and mitoxantrone; or with high-dose cytarabine and mitoxantrone in the first and second induction courses) in the German Acute Myeloid Leukaemia Cooperative Group 1999 study. Risk prediction was validated in an independent cohort of 801 patients (aged >60 years) with acute myeloid leukaemia who were given two courses of cytarabine and daunorubicin in the Acute Myeloid Leukaemia 1996 study.
Findings Body temperature, age, de-novo leukaemia versus leukaemia secondary to cytotoxic treatment or an antecedent haematological disease, haemoglobin, platelet count, fibrinogen, and serum concentration of lactate dehydrogenase were significantly associated with CR or ED. The probability of CR with knowledge of cytogenetic and molecular risk (score 1) was from 12% to 91%, and without knowledge (score 2) from 21% to 80%. The predicted risk of ED was from 6% to 69% for score 1 and from 7% to 63% for score 2. The predictive power of the risk scores was confirmed in the independent patient cohort (CR score 1, from 10% to 91%; CR score 2, from 16% to 80%; ED score 1, from 6% to 69%; and ED score 2, from 7% to 61%).
Interpretation The scores for acute myeloid leukaemia can be used to predict the probability of CR and the risk of ED in older patients with acute myeloid leukaemia, but otherwise medically healthy, for whom intensive induction chemotherapy is planned. This information can help physicians with difficult decisions for treatment of these patients.
Funding Deutsche Krebshilfe and Deutsche Forschungsgemeinschaft.
Introduction
Complete remission (CR) after intensive induction chemotherapy is a prerequisite for the long-term survival of patients who are diagnosed with acute myeloid leukaemia.1 In patients who are older than 60 years and otherwise medically healthy—ie, able to undergo intensive chemotherapy—intensive cytarabine-based and anthracycline-based chemotherapy is a valid option and can induce CR and cure. In a randomised phase 3 study by the European Organisation for Research and Treatment of Cancer (EORTC),2 patients who were 65 years or older with acute myeloid leukaemia had worse survival in the non-intensive chemotherapy group than in the intensive chemotherapy group. However, among patients who are 60 years or older, prognosis is still poor despite intensive chemotherapy, with a median overall survival of less than 1 year.3–7 In patients with acute myeloid leukaemia who were given intensive induction chemotherapy, the risk of early death (ED) was much higher in those who were 60 years or older than in younger patients, and the CR rate was only about 50% in the older patients compared with 70% in younger patients.3–7 Synthesis of novel (ie, hypomethylating) drugs—such as azacitidine and decitabine—have extended survival in the older patients without the risks associated with induction chemotherapy.8,9 However, rates of CR are still low and long-term survival is rare. For patients who are medically healthy, a few variables are known that can be used to estimate the potential benefits and risks associated with intensive chemotherapy. Thus, risk factors such as age at diagnosis,10 serum concen-tration of lactate dehydro-genase at diagnosis,11 and a leukaemia secondary to treatment with cytotoxic drugs or an antecedent haematological disease10,12 are known to correlate with the probability of a patient achieving CR.
Furthermore, cytogenetic changes are associated with the rate of CR and overall survival.13 Among molecular genetic changes, fms-like tyrosine kinase 3 internal tandem duplication (FLT3-ITD) is a negative prognostic factor14–16 and mutated nucleo-phosmin (NPM) in the absence of a FLT3-ITD mutation is a positive prognostic factor17–20 in patients younger and older than 60 years with cytogenetically normal acute myeloid leukaemia. Since no treatment algorithms are in clinical use that take the different variables into account, we obtained and verified the scores and developed a web-based applicationfor the prediction of the probability of CR and risk of ED after intensive induction chemotherapy in patients who are 60 years or older, have acute myeloid leukaemia, and are otherwise medically healthy.
Methods
Patients and treatment
The results of induction chemotherapy were available for 1406 patients (aged ≥60 years) with newly diagnosed acute myeloid leukaemia who were treated in the German Acute Myeloid Leukaemia Cooperative Group 1999 (AMLCG1999) study between June, 1999, and March, 2009.3 In the AMLCG1999 study, the patients were randomly assigned to induction chemotherapy with tioguanine (100 mg/m2 twice a day on days 3–9, orally), standard-dose cytarabine (100 mg/m2 on days 1–2, 24-h intravenous infusion, and 100 mg/m2 twice a day on days 3–8, intravenously), and daunorubicin (60 mg/m2once per day on days 3–5, intravenously) followed by the second course with high-dose cytarabine (1 g/m2 twice a day on days 1–3, intravenously) and mitoxantrone (10 mg/m2 once per day on days 3–5, intravenously); or high-dose cytarabine and mitoxantrone in the first and second induction courses; the second induction course was given on day 22 only if patients had persistence of blasts 7 days after the completion of the first course. The detailed treatment plan and first study results have been previously reported.3
The scores for acute myeloid leukaemia were validated in 801 patients (aged >60 years) with newly diagnosed acute myeloid leukaemia and an available result for induction chemotherapy for those who were treated in the Acute Myeloid Leukaemia 1996 (AML96) study between February, 1996, and September, 2004.21 Induction chemotherapy consisted of two courses of cytarabine (100 mg/m2 once per dayon days 1–7, 24-h intravenous infusion) and daunorubicin (45 mg/m2 once per day on days 3–5, intravenously) with a different treatment if the response was inadequate after one course. Alternative treatment options used by the investigators were fludarabine (30 mg/m2 once a day on days 1–5, intravenous infusion), cytarabine (1 g/m2 once a day on days 1–5, 4-h infusion starting 4 h after fludarabine infusion), idarubicin (7 mg/m2 once a day on days 1–2, intravenous infusion) and filgastrim (300 µg on days 0–5, subcutaneously), or combinations of cytarabine (1 g/m2 twice a day on days 1–3) with either mitoxantrone (10 mg/m2 once per day on days 3–5, intravenously), idarubicin (10 mg/m2 once per day on days 3–5, intravenously), or amsacrine (100 mg/m2 once per dayon days 1–5, intravenously).
In both studies, all patients were judged to be medically healthy for intensive induction chemotherapy by their treating physicians, and those with acute promyelocytic leukaemia were excluded.
Patients provided written informed consent in both studies. Both studies were approved by the relevant institutional review boards.
Procedures
The definition of CR was haematological recovery with at least 1000 neutrophils per µL and at least 100 000 platelets per µL, and less than 5% bone marrow blasts in at least one measurement. For comparability of the trials, CR was defined as remission after up to two induction courses in both trials. ED was defined as death from any cause within 60 days from the first day of treatment. Patients with more than 5% residual bone marrow blasts after induction treatment were judged to be non-responders. Only patients who started study treatment and those with a definite induction result (CR, ED, or non-responders) were included in the analysis.
The variables were coded in an exploratory analysis (webappendix p 1). Missing data were substituted with the median value. Variables were excluded if more than 15% of data were missing.
Cytogenetic analysis was done in the central laboratories by use of classical G-banding techniques,22 and cytogenetic risk was assessed after being prospectively defined for the two study populations. The definitions of risks for the AMLCG1999 study were as previously described.10 Low risk was defined as t(8;21), inv(16), or t(16;16); high risk as del(5q), monosomy 5, del(7q), monosomy 7, inv(3), t(3;3), 11q23 aberrations, or a complex aberrant karyotype consisting of at least three aberrations that were not low risk; and intermediate risk as normal karyotype and all other aberrations that were not classified as low or high risk. In the AML96 study, high-risk definitions were del(5q) or monosomy 5, del(7q) or monosomy 7, inv(3), t(6;9), t(9;22), or a complex aberrant karyotype consisting of three or more aberrations that were not low risk.23
In patients with a normal karyotype, mutational analysis of NPM1 and FLT3 was done as previously described.14,15,17,19 Low molecular risk was defined as the presence of a mutation in NPM1 in the absence of FLT3-ITD; and intermediate molecular risk was defined as all other combinations. Four categories of cytogenetic and molecular risk were created on the basis of risk classifications: low (cytogenetic or molecular) risk, intermediate risk with normal karyotype, intermediate risk with aberrant karyotype, and high cytogenetic risk (webappendix p 3).
Statistical analysis
Each preclinical variable was correlated with CR and ED by use of univariate logistic regression analysis. To avoid overfitting, only variables with a significant association in the univariate analysis (p<0·05) were analysed with multivariate logistic regression with stepwise inclusion. The significance level was α=0·05 in the multivariate analysis. Models for multivariate logistic regression were calculated independently for CR and ED, with and
without inclusion of the cytogenetic and molecular risk. Kaplan-Meier estimates were calculated for survival analysis.
Both studies were registered at ClinicalTrials.gov, as NCT00266136 for AMLCG99 and NCT00180115 for AML96.
Role of the funding source
The study sponsor had no influence on the study design, collection, analysis, and interpretation of data, writing of the report, and decision to submit the report. The corresponding author had full access to all the data in the study and had final responsibility for the decision to submit the report for publication.
Results
No differences were noted between the patients treated in the AMLCG1999 study (n=1406) and those treated in the AML96 study (n=801) with respect to age, FAB type, karyotype, or frequencies of molecular aberrations (table 1). In the AMLCG99 study, CR rates and survival did not differ between the two groups given induc-tion treatment.10
In the models of multivariate logistic regression with knowledge of the cytogenetic and molecular risk (score 1), the standard clinical and laboratory variables (body temperature, haemoglobin, platelets, fibrinogen, lactate dehydrogenase, age, and de novo vs secondary leukaemia) and the variables for cytogenetic and molecular risk (low cytogenetic or molecular risk, intermediate cytogenetic risk with aberrant karyotype, and high cytogenetic risk) were significantly associated with CR or ED (webappendix p 1; panel, formulas B and D). In the model without knowledge of the cytogenetic and molecular risk (score 2), the seven standard clinical and laboratory variables were also significantly associated with CR or ED (webappendix p 1; panel, formulas C and E).
On the basis of variables that showed significant correlation with CR and ED, probabilities of CR or ED were calculated for each patient by use of formula A after calculation of X with the appropriate formulas B to E (panel). With knowledge of the cytogenetic and molecular risk, the predicted rates of CR were between 12% and 91% (first [lowest] quarter by CR prediction 12–39%, second quarter 40–54%, third quarter 54–68%, fourth [highest] quarter 68–91%; quarters by CR prediction refer to the assignment of the whole study population into four equal groups according to their individual probability of CR score 1). Figures 1 and 2 show the results for the AMLCG1999 study population. The correlation between the predicted CR probability and the actual CR rate of score 1 is shown by the receiver operator characteristics (figure 1A) and by the predicted CR probability plotted against the actual CR rates (figure 1B). The predicted rate of ED was from 6% to 69% with the inclusion of the cytogenetic and molecular risk. Patients with the highest 5% of predicted ED risk (median 49%, range 46– 69) had an increased ED rate of 54% (figure 2B).
Accurate prediction of the rates of CR (figures 1A [CR score 2] and 1C) and ED (figures 2A [ED score 2] and 2C) was possible without knowledge of the cytogenetic and molecular risk. The predicted probability of CR was from 21% to 80%. The predicted risk of ED was from 7% to 63% for ED without knowledge of the cytogenetic and molecular risk. Again, the patients with the highest 5% predicted risk of ED (median 49%, range 43–63) had an increased ED rate of 51%.
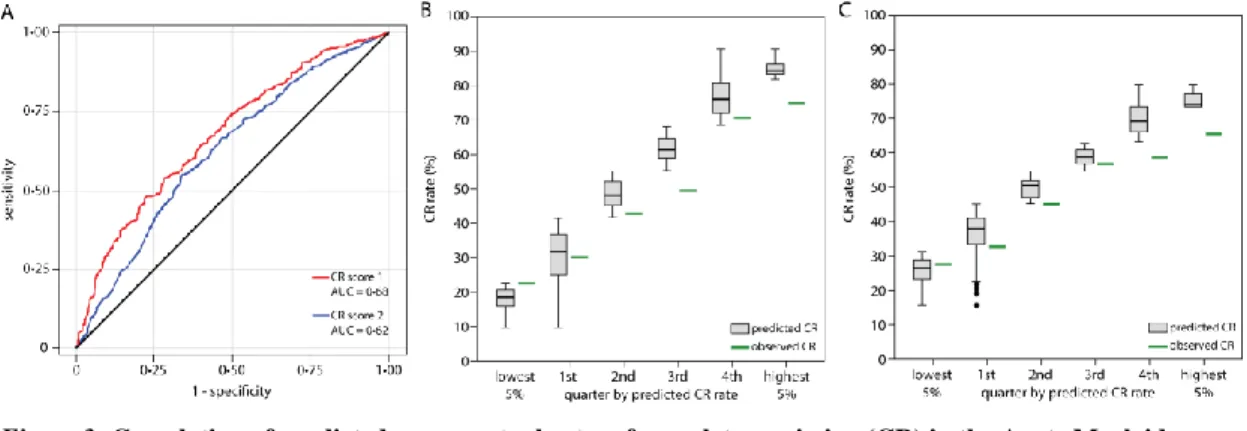
Figures 3 and 4 show the results for the AML96 study population. The predicted rate of CR was from 10% to 91% with knowledge of the cytogenetic and molecular risk, and from 16% to 80% without knowledge of the cytogenetic and molecular risk. The comparison of the predicted versus the actual rates of CR showed an accurate prediction of the probability of CR in the validation cohort (score 1, figure 3B; score 2, figure 3C). The predicted risk of ED was from 6% to 69% with knowledge of the cytogenetic and molecular risk (figure 4B), and from 7% to 61% without knowledge of the cytogenetic and molecular risk (figure 4C).
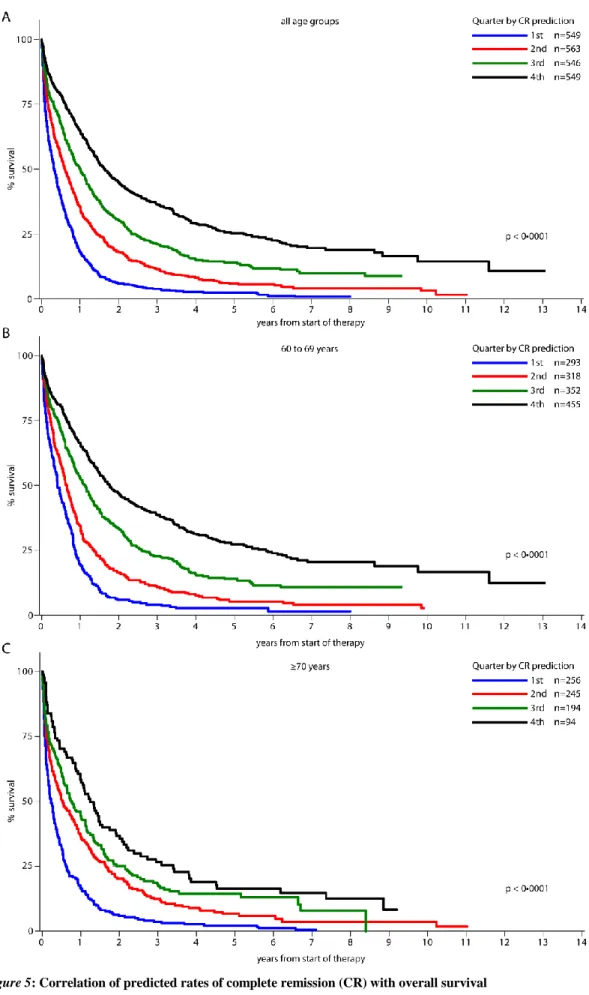
The quarters for the predicted CR rates correlated significantly with overall survival for the whole population and for the age groups 60–69 years and 70 years and older (figure 5). Notably, 136 of 535 patients with high cytogenetic risk were not in the quarter with the lowest predicted rate of CR, but were in the second and third quarters (table 2). A greater proportion of these patients (63 [46%]) achieved a CR than did those in the quarter with the lowest probability of CR (108 [27%] of 399; table 2). Most of the 283 patients with a low cytogenetic or molecular risk were grouped in the 25% of those with the highest CR probability. In this group, a high proportion of patients achieved CR, whereas only 22 (54%) of 41 patients with favourable cytogenetics or molecular markers and grouped outside the quarter with the highest CR probability achieved CR (table 2).
Discussion
We identified standard clinical and laboratory variables (body temperature, haemoglobin, platelets, fibrinogen, lactate dehydrogenase, age, and de novo vs secondary leukaemia) and the variables for cytogenetic and molecular risk (low cytogenetic or molecular risk, intermediate cytogenetic risk with aberrant karyotype, and high cytogenetic risk) that were closely and independently associated with CR and ED.
Up to now, the most important prognostic factors were the patient’s age at diagnosis10 and the cytogenetic risk.13 For some patients who are 60 years or older and who present with a highly proliferative disease that requires immediate treatment, delay in treatment until completion of the cytogenetic results is not possible.24 This problem is taken into account by use of different scores (with or without the knowledge of the cytogenetic and molecular risk) for acute myeloid leukaemia and multivariate analyses for the prediction of CR and ED. Importantly, only routine clinical data and standard laboratory variables are used to calculate the scores. Intensive chemotherapy is frequently not offered to patients with a high cytogenetic risk. In our analysis, 25% of patients with high cytogenetic risk were predicted to still have more than 40% probability of achieving CR. Since patients aged 60
years or older with acute myeloid leukaemia in their first CR might benefit from allogeneic stem cell transplantation (which is an additional treatment for extending survival and increasing the rate of cure),25 a sceptical approach might not be appropriate for all patients with this leukaemia and poor-risk cytogenetics. By contrast, only 14% of patients with either low cytogenetic or molecular risk were not in the quarter with the highest prediction for CR, and these patients still had a greater than 50% probability of CR, justifying an intensive approach. This finding is in accord with the results of a recently reported study26 in which the investigators noted that among patients older than 70 years, those with a favourable cytogenetic risk profile were in the subset that benefited from intensive chemotherapy. Importantly, we also identified different prognostic groups in patients aged 70 years and older with the scores for acute myeloid leukaemia that again resulted in overall differences in survival (figure 5).
One potential weakness of the scores for acute myeloid leukaemia relates to the time of the acquisition of the clinical and laboratory variables. In most cases, the data were obtained immediately before treatment was initiated, and estimation of how the scores for each patient would be affected if the data were acquired a couple of days earlier or later is difficult. For example, effective treatment of infection might reduce a fever and thus lead to prediction of an increased rate of CR.
Use of the score predictor might be most helpful for patients with acute myeloid leukaemia who achieve a very low or very high predicted rate of CR. For patients predicted to have about 50% probability of CR, not much might be gained by obtaining the score for CR. Nonetheless, because only standard variables are included in the calculation and the scores are easy to obtain, the scores might help many physicians in deciding whether or not to offer intensive induction chemotherapy to patients who are 60 years or older. However, the scores for acute myeloid leukaemia have to be used with caution, and the responsibility for the final treatment recommendation remains with each patient’s haematologist.
Additional variables that might be used to qualify an older patient with acute myeloid leukaemia as not suitable for intensive chemotherapy are the clinical performance score27 and risk of comorbidities.28 Unlike scoring systems reported for patients aged 65 years or older29,30 or 70 years or older31 with acute myeloid leukaemia who were given intensive induction chemotherapy, the scores reported here do not include performance status, comorbidities, or severe organ failure. Notably, the scores for acute myeloid leukaemia are only valid if intensive induction chemotherapy seems feasible. The scores were validated using a second, independent patient cohort treated in independent hospitals with a different protocol for induction chemotherapy. The results showed that the scores for acute myeloid leukaemia could be used to precisely predict the rates of CR and ED with significant power independently of the induction chemotherapy. For example, the dose of daunorubicin was higher (60 mg/m2) in the AMLCG1999 cohort than in the AML96 study group (45 mg/m2). The finding that the choice of induction chemotherapy did not affect the predictive power of the scores is in accord with the results of several other studies.10,32,33 The results of these studies showed that in older patients with acute myeloid leukaemia the choice of current regimens for induction chemotherapy do not greatly affect outcome.
Patients who are not given intensive chemotherapy are routinely offered low-intensity or palliative treatment. Other treatment options are clofarabine, low-dose cytarabine, hydroxycarbamide, azacitidine, decitabine, or best supportive care. Whereas patients with an adverse cytogenetic risk profile do not benefit from low-dose cytarabine,34 hypomethylating drugs are active even in these patients.8,9 These choices might be offered to patients with acute myeloid leukaemia who are unlikely to benefit from intensive induction chemotherapy. However, several of the clinical variables that are associated with a low probability of CR might also be associated with a poor prognosis with other treatments. Additional scores might need to be assessed for the efficacy and risk associated with different low-intensive or palliative treatment regimens, as reported for azacitidine in patients with high-risk myelodysplastic syndrome.35
The scores for acute myeloid leukaemia might aid in the decision of whether intensive induction chemotherapy is the preferred option in an older, otherwise medically healthy patient who is diagnosed with acute myeloid leukaemia, and thus they could change the clinical practice for a large number of patients with this leukaemia. Contributors
UK, TB, and CMT designed this study and wrote the report. MS, BW, WH, GE, WEB, and TB designed the clinical trials. UK, CRöl, AK, MS, CT, JB, KS, TH, CH, SK, HS, BW, WH, GE, WEB, TB, and CMT gathered the data. AH, MCS, and MK did the statistical analysis. UK, CRoh, and CMT designed and programmed the website. All authors reviewed and edited the report and have seen and approved the final draft.
German Acute Myeloid Leukaemia Cooperative Group and Study Alliance Leukemia Investigators
H Fuß (Municipal Hospital, Bad Saarow); S Korsten, D Hennesser (Vinzenz-Pallotti-Hospital, Bergisch-Gladbach); J Potenberg (Evangelian Hospital Spandau, Berlin); W D Ludwig, D Schöndube (HELIOS Klinikum Clinic Robert Rössle, Berlin); E Späth-Schwalbe, S Hesse-Amojo (Hospital Spandau, Berlin); A Mayr, A Grüneisen (Municipal Hospital Neukölln, Berlin); C Boewer, M Derwahl, H J Englisch (St Hedwig Hospital, Berlin); O Rick, W Siegert (Universital Hospital Charité Campus Mitte, Berlin); M Notter, L Uharek, E Thiel (University Hospital Charité Campus Benjamin Franklin, Berlin); B Dörken, R Arnold, D Huhn, O Knigge (University Hospital Charité Campus Virchow Klinikum, Berlin); R Kolloch, U Krümpelmann (Gilead Hospital, Bielefeld); A J Weh, A Zumsprekel (Municipal Hospital, Bielefeld); C Teschendorf, M Stechstor (Knappschaft Hospital, Bochum); G Trenn (Knappschaft Hospital, Bottrop); B Wörmann (Municipal Medical Center, Braunschweig); K-H Pflüger, T Wolff (Evangelian Diakonissen Hospital, Bremen); B Hertenstein, H Thomssen, A Peyn, H Rasche (Municipal Hospital St Jürgenstraße, Bremen); H-H Heidtmann (St Joseph Hospital, Bremerhaven); F Marquard (General Hospital, Celle); M Hähnel, F Fiedler, R Herbst (Küchwald Hospital, Chemnitz); M Hallek, P Staib (University Hospital, Cologne); M Heike, A Niederste-Hollenberg (Municipal Hospital, Dortmund); H Pielken, H Hindahl (St Johannes Hospital, Dortmund); C Röllig, M Schaich, C Thiede, M Kramer, G Ehninger (University Hospital, Dresden); C Aul, A Giagounidis (St Johannes Hospital, Duisburg); W Lange, S E Kuhlemann (Johanniter Hospital Rheinhausen, Duisburg); M Flaßhove, J Karow (Municipal Hospital, Düren); M Gramatzki, G Helm (University Hospital, Erlangen); R Fuchs, F Schlegel (St Antonius Hospital, Eschweiler); J-G Saal (Malteser Hospital, Flensburg); H Serve (University Hospital, Frankfurt); M Kiehl (General Hospital, Frankfurt/Oder); H-G Höffkes, M Arland
(Municipial Hospital, Fulda); G Meckenstock, A Giagounidis (St Joseph-Hospital, Gelsenkirchen); D Haase, L Trümper, F Griesinger (University Hospital, Göttingen); C Gropp, R Depenbusch (Municipal Hospital, Gütersloh); H Eimermacher (Municipal Hospital, Hagen); W Schütte, U Haak (Municipal Hospital Martha-Maria, Halle); E Fasshaür (St Elisabeth-Hospital, Halle); N Schmitz, R Stuhlmann (Asklepios Hospital St Georg, Hamburg); D Braumann (General Hospital Altona, Hamburg); H Schmidt, K Buhrmann (District Hospital, Hameln); L Balleisen, J Schubert (Evangelian Hospital, Hamm); H Dürk (St Marien-Hospital, Hamm); M Burk (Municipial Hospital, Hanau); A-D Ho, U Mahlknecht (University Hospital, Heidelberg); J G Lange, U Schmitz-Hübner (District Hospital, Herford); A Bartholomäus (St Bernward Hospital, Hildesheim); A Fauser (Municipal Hospital, Idar-Oberstein); H Link, F-G Hagmann (Westpfalz Hospital, Kaiserslautern); M Wolf, B Ritter (Municipal Hospital, Kassel); Th Frieling, M Planker (Municipal Hospital, Krefeld); G Köchling (District Hospital, Leer); F Hartmann, H Middeke, C Gründgens, C Constantin (Hospital Lippe-Lemgo, Lemgo); K-P Schalk (St Vincent-Hospital, Limburg/Lahn); K-A Jost (Trinity Hospital, Lippstadt); S Fetscher, J Schmielau (Municipal Hospital South Lübeck, Lübeck); T Wagner (University Hospital, Lübeck); M Uppenkamp, M Hoffmann (Municipal Hospital, Ludwigshafen); R Hehlmann, E Lengfelder (University Hospital, Mannheim); A Neubauer (University Hospital, Marburg); M Schwonzen, H Spangenberg (St Walburga Hospital, Meschede); H Bodenstein, J Tischler (Municipial Hospital, Minden); D Graeven, D Kohl, T Heuer (Maria- Hilf- Hospital, Mönchengladbach); H Pohlmann, N Brack (Municipal Hospital Harlaching, Munich); K Nibler, D Fleckenstein (Municipal Hospital Neuperlach, Munich); T Haferlach, C Haferlach, S Schnittger, W Kern (Munich Leukemia Laboratory MLL, Munich); B Emmerich, R Dengler, B Schlag (University Hospital Innenstadt, Munich); W Hiddemann, J Braess, K Spiekermann (University Hospital Großhadern, Munich); W E Berdel, T Büchner, J Kienast, R Mesters, C Müller-Tidow, U Krug, S Koschmieder (University Hospital, Münster); S Volpert, P Wieacker (Dept of Human Genetics, University Hospital, Münster); M C Sauerland, A Heinecke, W Köpcke (Institute of Biostatistics and Clinical Research, University Hospital, Münster); M Wilhelm, H Wandt, K Schäfer-Eckart (Municipal Hospital, Nürnberg); F Hirsch (District Hospital, Offenbach); B Seeber (Municipal Hospital, Offenbach); J Hartlapp, T Hegge, R Peceny (Municipal Hospital, Osnabrück); O Koch, G Innig (Paracelsus Hospital, Osnabrück); T Südhoff, T Wagner (Municipal Medical Center, Passau); G Maschmeyer (Ernst-von-Bergmann Medical Center, Potsdam); E D Kreuser, M Schenk (Hospital Barmherzige Brüder, Regensburg); A Reichle, R Andreesen (University Hospital, Regensburg); H Huff, D Schönberger (Municipal Hospital, Rosenheim); T Geer, H Heissmeyer (Diakonie-Hospital, Schwäbisch-Hall); J Labenz (Evangelian Jung-Stilling-Hospital, Siegen); W Gassmann, T Gaske (Municipal Hospital, Siegen); J Käsberger (Diakonissen-Hospital, Stuttgart); W E Aulitzky, L Leimer (Robert-Bosch-Hospital, Stuttgart); M R Clemens, R Mahlberg (Mutterhaus der Borromärinnen, Trier); N Frickhofen, H-G Fuhr (Dr Horst Schmitt (Robert-Bosch-Hospital, Wiesbaden); R Schwerdtfeger (German Hospital for Diagnostics, Wiesbaden); W Augener (St Willehad Hospital, Wilhelmshaven); R Engberding, R Winter (Municipal Hospital, Wolfsburg); M Sandmann (St Antonius Hospital, Wuppertal); H Einsele; F Weissinger, H Rückle-Lanz (University Hospital, Würzburg); W Brugger, G Papakonstantinou (Municipal Hospital, Villingen-Schwenningen); U Kreibich, G Schott, S Sommer, W Zschille (Heinrich Braun Hospital, Zwickau).
Conflicts of interest
UK has received expenses for travel, accommodation, and meetings from Amgen and Celgene. CT has received grants from
Bundesministerium für Bildung und Forschung; payment for lectures, including service on speakers’ bureaus, from Novartis; pay ment for diagnostic services from Novartis and Ambit; and expenses for travel, accommodations, and meetings from Novartis, Bayer, and Ambit. TH has received payment for lectures including service on speakers’ bureaus from Novartis, Bristol-Myers Sqibb, and Celgene; and has part ownership in Munich Leukemia Laboratory. CH has part ownership in Munich Leukemia Laboratory. SK has received grants from Novartis; and expenses for travel, accommodations, and meetings from Mundipharma, Novartis, and Bristol-Myers Sqibb. WEB has received grants from Deutsche Forschungsgemeinschaft, Deutsche Krebshilfe, and Sander-Foundation; payment for lectures, including service on speakers’ bureaus, and development of educational presentations from Molecular and Targeted Therapy of Cancer; and expenses for travel, accommodations, and meetings from Amgen. CMT has received grants from Bundesministerium für Bildung und Forschung; payment for lectures, including service on speakers’ bureaus, from Novartis and Celgene; payment for manuscript preparation from Celgene; and expenses for travel, accommodations, and meetings from Celgene, Amgen, Novartis, and Bayer. GE has received payment for board membership from Rhön Klinikum; payment for consultancy from Aicuris, Leverkusen; and grants from Deutsche Forschungsgemeinschaft; payments fo r lectures, including service on speakers’ bureaus, from Update–Conference; has stock or stock options in Rhön Klinikum; and has received expenses for travel, accommodations, and meetings from Novartis. The other authors declare that they have no conflicts of int erest. Acknowledgment
This work was supported by a grant from the Deutsche Krebshilfe (70-2839-Bü4 to TB) and by a grant from the Deutsche Forschungsgemeinschaft (Mü-1328/8-1 to CMT and TB).
References
1 Walter RB, Kantarjian HM, Huang X, et al. Effect of complete remission and responses less than complete remission on survival in acute myeloid leukemia: a combined Eastern Cooperative Oncology Group, Southwest Oncology Group, and M D Anderson Cancer Center Study. J Clin Oncol 2010; 28: 1766–71.
2 Löwenberg B, Zittoun R, Kerkhofs H, et al. On the value of intensive remission-induction chemotherapy in elderly patients of 65+ years with acute myeloid leukemia: a randomized phase III study of the European Organization for Research and Treatment of Cancer Leukemia Group.
J Clin Oncol 1989; 7: 1268–74.
3 Büchner T, Berdel WE, Schoch C, et al. Double induction containing either two courses or one course of high-dose cytarabine plus mitoxantrone and postremission therapy by either autologous stem-cell transplantation or by prolonged maintenance for acute myeloid leukemia. J Clin Oncol 2006; 24: 2480–89.
4 Kantarjian H, O’Brien S, Cortes J, et al. Results of intensive chemotherapy in 998 patients age 65 years or older with acute myeloid leukemia or high-risk myelodysplastic syndrome: predictive prognostic models for outcome. Cancer 2006; 106: 1090–98.
5 Rowe JM, Neuberg D, Friedenberg W, et al. A phase 3 study of three induction regimens and of priming with GM-CSF in older adults with acute myeloid leukemia: a trial by the Eastern Cooperative Oncology Group. Blood 2004; 103: 479–85.
6 Goldstone AH, Burnett AK, Wheatley K, Smith AG, Hutchinson RM, Clark RE. Attempts to improve treatment outcomes in acute myeloid leukemia (AML) in older patients: the results of the United Kingdom Medical Research Council AML11 trial. Blood 2001; 98: 1302–11. 7 Anderson JE, Kopecky KJ, Willman CL, et al. Outcome after induction chemotherapy for older patients with acute myeloid leukemia is not
improved with mitoxantrone and etoposide compared to cytarabine and daunorubicin: a Southwest Oncology Group study. Blood 2002; 100: 3869–76.
8 Fenaux P, Mufti GJ, Hellström-Lindberg E, et al. Azacitidine prolongs overall survival compared with conventional care regimens in elderly patients with low bone marrow blast count acute myeloid leukemia. J Clin Oncol 2010; 28: 562–69.
9 Cashen AF, Schiller GJ, O’Donnell MR, DiPersio JF. Multicenter, phase II study of decitabine for the first-line treatment of older patients with acute myeloid leukemia. J Clin Oncol 2010; 28: 556–61.
10 Büchner T, Berdel WE, Haferlach C, et al. Age-related risk profile and chemotherapy dose response in acute myeloid leukemia: a study by the German Acute Myeloid Leukemia Cooperative Group. J Clin Oncol 2009; 27: 61–69.
11 Kern W, Haferlach T, Schoch C, et al. Early blast clearance by remission induction therapy is a major independent prognostic factor for both achievement of complete remission and long-term outcome in acute myeloid leukemia: data from the German AML Cooperative Group (AMLCG) 1992 Trial. Blood 2003; 101: 64–70.
12 Goldstone AH, Burnett AK, Avivi I, et al. Secondary acute myeloid leukemia always predicts worse outcome than de novo AML, regardless of cytogenetics or age. AML 10,11,12 MRC trials. Blood 2002; 100: 322 (abstr).
13 Grimwade D, Walker H, Harrison G, et al. The predictive value of hierarchical cytogenetic classification in older adults with acute myeloid leukemia (AML): analysis of 1065 patients entered into the United Kingdom Medical Research Council AML11 trial. Blood 2001; 98: 1312–
20.
14 Thiede C, Steudel C, Mohr B, et al. Analysis of FLT3-activating mutations in 979 patients with acute myelogenous leukemia: association with FAB subtypes and identification of subgroups with poor prognosis. Blood 2002; 99: 4326–35.
15 Schnittger S, Schoch C, Dugas M, et al. Analysis of FLT3 length mutations in 1003 patients with acute myeloid leukemia: correlation to cytogenetics, FAB subtype, and prognosis in the AMLCG study and usefulness as a marker for the detection of minimal residual disease.
Blood 2002; 100: 59–66.
16 Whitman SP, Maharry K, Radmacher MD, et al. FLT3 internal tandem duplication associates with adverse outcome and gene- and microRNA-expression signatures in patients 60 years of age or older with primary cytogenetically normal acute myeloid leukemia: a Cancer and Leukemia Group B study. Blood 2010; 116: 3622–26.
17 Schnittger S, Schoch C, Kern W, et al. Nucleophosmin gene mutations are predictors of favorable prognosis in acute myelogenous leukemia with a normal karyotype. Blood 2005; 106: 3733–39.
18 Döhner K, Schlenk RF, Habdank M, et al. Mutant nucleophosmin (NPM1) predicts favorable prognosis in younger adults with acute myeloid leukemia and normal cytogenetics: interaction with other gene mutations. Blood 2005; 106: 3740–46.
19 Thiede C, Koch S, Creutzig E, et al. Prevalence and prognostic impact of NPM1 mutations in 1485 adult patients with acute myeloid leukemia (AML). Blood 2006; 107: 4011–20.
20 Becker H, Marcucci G, Maharry K, et al. Favorable prognostic impact of NPM1 mutations in older patients with cytogenetically normal de novo acute myeloid leukemia and associated gene- and microRNA-expression signatures: a Cancer and Leukemia Group B study. J Clin Oncol 2010; 28: 596–604.
21 Röllig C, Aulitzky WE, Bodenstein H, et al. Risk stratification and prognostic factors in elderly AML patients–updated results of 909 patients entered into the prospective AML96 trial. Blood 2009; 114: 329 (abstr).
22 Comings DE, Avelino E, Okada TA, Wyandt HE. The mechanism of C- and G-banding of chromosomes. Exp Cell Res 1973; 77: 469–83. 23 Röllig C, Thiede C, Gramatzki M, et al. A novel prognostic model in elderly patients with acute myeloid leukemia: results of 909 patients
entered into the prospective AML96 trial. Blood 2010; 116: 971–78.
24 Sekeres MA, Elson P, Kalaycio ME, et al. Time from diagnosis to treatment initiation predicts survival in younger, but not older, acute myeloid leukemia patients. Blood 2009; 113: 28–36.
25 Bertz H, Potthoff K, Finke J, et al. Allogeneic Stem-Cell Transplantation From Related and Unrelated Donors in Older Patients With Myeloid Leukemia. J Clin Oncol 2003; 21: 1480–84.
26 Kantarjian H, Ravandi F, O’Brien S, et al. Intensive chemotherapy does not benefit most older patients (age 70 years or older) with acute myeloid leukemia. Blood 2010; published online Jul 28. DOI:10.1182/blood-2010-03-276485.
27 Appelbaum FR, Gundacker H, Head DR, et al. Age and acute myeloid leukemia. Blood 2006; 107: 3481–85.
28 Giles FJ, Borthakur G, Ravandi F, et al. The haematopoietic cell transplantation comorbidity index score is predictive of early death and survival in patients over 60 years of age receiving induction therapy for acute myeloid leukaemia. Br J Haematol 2007; 136: 624–27. 29 Kantarjian H, O’Brien S, Cortes J, et al. Results of intensive chemotherapy in 998 patients age 65 years or older with acute myeloid leukemia
or high-risk myelodysplastic syndrome: predictive prognostic models for outcome. Cancer 2006; 106: 1090–98.
30 Breccia M, Frustaci AM, Cannella L, et al. Comorbidities and FLT3-ITD abnormalities as independent prognostic indicators of survival in elderly acute myeloid leukaemia patients. Hematol Oncol 2009; 27: 148–53.
31 Etienne A, Esterni B, Charbonnier A, et al. Comorbidity is an independent predictor of complete remission in elderly patients receiving induction chemotherapy for acute myeloid leukemia. Cancer 2007; 109: 1376–83.
32 Ohtake S, Miyawaki S, Fujita H, et al. Randomized study of induction therapy comparing standard-dose idarubicin with high-dose daunorubicin in adult patients with previously untreated acute myeloid leukemia: JALSG AML201 Study. Blood 2010; published Aug 6. DOI:10.1182/blood-2010-03-273243.
33 Löwenberg B, Ossenkoppele GJ, van Putten W, et al. High-dose daunorubicin in older patients with acute myeloid leukemia. N Engl J Med
2009; 361: 1235–48.
34 Burnett AK, Milligan D, Prentice AG, et al. A comparison of low-dose cytarabine and hydroxyurea with or without all-trans retinoic acid for acute myeloid leukemia and high-risk myelodysplastic syndrome in patients not considered fit for intensive treatment. Cancer 2007; 109: 1114–24.
35 Itzykson R, Thépot S, Quesnel B, et al. Prognostic factors of response and overall survival in 282 higher-risk myelodysplastic syndromes treated with azacitidine. Blood 2010; published online Oct 12. DOI:10.1182/blood-2010-06-289280
AMLCG99 (n=1406)
AML96 (n=801)
Age (years; median, range) 67 (60–85) 67 (61–85)
FAB type M0 82 (6%) 39 (5%) M1 291 (21%) 196 (26%) M2 480 (34%) 251 (33%) M4 242 (17%) 128 (17%) M5 118 (8%) 102 (14%) M6 57 (4%) 29 (4%) M7 9 (<1%) 7 (<1%) missing 127 (9%) 50 (6%) Cytogenetic risk Low 54 (4%) 35 (4%) Intermediate 889 (63%) 517 (65%) high 371 (26%) 164 (20%) Not known 92 (7%) 85 (11%) Normal karyotype 655 (47%) 372 (46%) NPM mutated and no FLT3-ITD* 122 (19%) 72 (19%) other, n (%) 338 (52%) 223 (60%) Not known, n (%) 195 (30%) 77 (21%) Outcome Complete remission 751 (53%) 388 (48%) Persistent disease 323 (23%) 242 (30%) Early death† 332 (24%) 171 (21%)
Data are number (%), unless otherwise indicated. AMLCG1999=Acute Myeloid Leukaemia Cooperative Group 1999 study population. AML96=Acute Myeloid Leukaemia 1996 study population. NPM=nucleophosmin gene. FLT3=fms-like tyrosine kinase 3 gene. ITD=internal tandem duplication. *Includes FLT3 wild type and mutations in FLT3 tyrosine kinase domain. †Early death from any cause within 60 days after the start of chemotherapy
first quarter second quarter third quarter fourth quarter Low cytogenetic or molecular risk
n (%) 1 6 34 242
CR, n (%) 1 (100) 3 (50) 18 (53) 192 (79)
Predicted CR rate in %, median 35 50 64 80
High cytogenetic risk
n (%) 399 128 8 0
CR, n (%) 108 (27) 59 (46) 4 (50) 0 (n.a.)
Predicted CR rate in %, median 28 46 59 n.a.
Data are number or number (%), unless otherwise indicated. Patients were grouped into quarters according to their predicted probability of CR score 1 (ie, with inclusion of the cytogenetic and molecular risk).
Table 2: Distribution of patients with low risk and high risk within the quarters according to prediction of complete remission (CR)
Formula A:
Calculated probability of an event (CR or ED)=
Formula B:
X = 2·0732 – (0·4609 x temp) + (0·2987 x hb) + (0·1420 x plt) – (0·4331 x LDH) – (0·2556 x age) – (0·4929 x AML type) + (0·6732 x ilow) – (0·4395 x iother) – (1·2102 x ihigh)
Formula C:
X = 0·7372 – (0·4916 x temp) + (0·3628 x hb) + (0·1662 x plt) + (0·4873 x fib) – (0·3362 x LDH) – (0·2364 x age) – (0·6620 x AML type)
Formula D: X = –1·5539 + (0·4120 x temp) – (0·4094 x hb) – (0·1725 x plt) – (0·4920 x fib) + (0·5104 x LDH) + (0·3858 x age) + (0·5536 x ihigh) Formula E: X = –1·2424 + (0·4520 x temp) – (0·4375 x hb) – (0·1870 x plt) – (0·5236 x fib) + (0·4870 x LDH) + (0·3711 x age)
temp=body temperature. hb=haemoglobin. plt=platelet count. LDH=serum concentration of lactate dehydrogenase. age=patients’ age at diagnosis. AML type=type of acute myeloid leukaemia (de novo vs secondary). ilow=indicator of low cytogenetic or low molecular risk. iother=indicator of intermediate risk with cytogenetic aberrations not classified as low or high risk. ihigh=indicator of high cytogenetic risk. fib=fibrinogen
Panel: Formulas for calculation of the probability of a complete remission (CR) or early death (ED)
1 1+exp(-x)
Figure 1: Correlation of predicted versus actual rates of complete remission (CR) in the Acute Myeloid Leukaemia Cooperative Group 1999 study population
(A) Receiver operator characteristics for the two different CR scores with the area under the curve (AUC). CR score 1=CR score with inclusion of the cytogenetic and molecular risk. CR score 2=CR score without cytogenetic and molecular risk. (B) Predicted versus actual rates of CR score 1. Patients were classified into quarters according to their individual predicted probability of CR (boxes represent the IQR; whiskers indicate the minimum and maximum values, but are not longer than 1·5 times the length of the corresponding box; values outside this range are represented by separate dots), which is plotted against the actual CR rate for the quarters. Additionally, the predicted probability of CR and the actual rates of CR are shown for the patients with the lowest 5% (within the first quarter) and highest 5% (within the fourth quarter) of CR probability. (C) Predicted versus actual rates of CR score 2.
Figure 2: Correlation of predicted versus actual rates of early death (ED) in the Acute Myeloid Leukaemia Cooperative Group 1999 study population
(A) Receiver operator characteristics for the two different ED scores with the area under the curve (AUC). ED score 1=ED score with inclusion of the cytogenetic and molecular risk. ED score 2=ED score without cytogenetic and molecular risk. (B) Predicted versus actual rates of ED score 1. Patients were classified into quarters according to their individual predicted probability of ED (boxes represent the IQR; whiskers indicate the minimum and maximum values, but are not longer than 1·5 times the length of the corresponding box; values outside this range are represented by separate dots), which is plotted against the actual ED rate for the quarters. Additionally, the predicted probability of ED and the actual rates of ED are shown for the patients with the lowest 5% (within the first quarter) and highest 5% (within the fourth quarter) of ED probability. (C) Predicted versus actual rates of ED score 2.
Figure 3: Correlation of predicted versus actual rates of complete remission (CR) in the Acute Myeloid Leukaemia 1996 study population
(A) Receiver operator characteristics for the two different CR scores with the area under the curve (AUC). CR score 1=CR score with inclusion of the cytogenetic and molecular risk. CR score 2=CR score without cytogenetic and molecular risk. (B) Predicted versus actual rates of CR score 1. Patients were classified into quarters according to their individual predicted probability of CR (boxes represent the IQR; whiskers indicate the minimum and maximum values, but are not longer than 1·5 times the length of the corresponding box; values outside this range are represented by separate dots), which is plotted against the actual CR rate for the quarters. Additionally, the predicted probability of CR and the actual rates of CR are shown for the patients with the lowest 5% (within the first quarter) and highest 5% (within the fourth quarter) of CR probability. (C) Predicted versus actual rates of CR score 2.
Figure 4: Correlation of predicted versus actual rates of early death (ED) in the Acute Myeloid Leukaemia 1996 study population
(A) Receiver operator characteristics for the two different ED scores with the area under the curve (AUC). ED score 1=ED score with inclusion of the cytogenetic and molecular risk. ED score 2=ED score without cytogenetic and molecular risk. (B) Predicted versus actual rates of ED score 1. Patients were classified into quarters according to their individual predicted probability of ED (boxes represent the IQR; whiskers indicate the minimum and maximum values, but are not longer than 1·5 times the length of the corresponding box; values outside this range are represented by separate dots), which is plotted against the actual ED rate for the quarters. Additionally, the predicted probability of ED and the actual rates of ED are shown for the patients with the lowest 5% (within the first quarter) and highest 5% (within the fourth quarter) of ED probability. (C) Predicted versus actual rates of ED score 2.
Figure 5: Correlation of predicted rates of complete remission (CR) with overall survival
Patients were grouped into quarters according to their probability of having a CR score 1 and the corresponding Kaplan-Meier estimates are depicted. (A) Overall survival for all patients. (B) Patients aged 60–69 years. (C) Patients aged 70 years and older.