THE MEASUREMENT AND THE INTERPRETATION OF THE FORCE PARAMETERS DURING ECAP PROCESS
J. Tiža, T. Kvačkaj, M. Lupták
Department of Metal Forming, Faculty of Metallurgy, Technical University Košice, Letná 9 MERANIE A VYHODNOCOVANIE SILOVÝCH PARAMETROV PROCESU ECAP J. Tiža, T. Kvačkaj, M. Lupták
Katedra tvárnenia kovov, Hutnícka fakulta, TU Košice, Letná 9, 042 00 Košice Abstrakt
Výroba ultrajemných kovových materiálov predstavuje modernú a perspektívnu oblasť hutníctva. V súčasnej dobe existuje viacero metód na produkciu týchto materiálov. Jedna z možností ako takéto materiály pripraviť je cesta pôsobením intenzívnych plastických deformácií (IPD). Principiálne jednoduchá a zároveň efektívna je metóda ECAP (Equal channel angular pressing). V procese IPD je dôležitý moment merania tvárniacich síl. S potrebnou presnosťou tieto sily merajú tenzometrické snímače síl. Z Nameraných síl možno usudzovať o prebehajúcich dejoch v oblasti plastických deformácií, ale aj o trení v miestach styku kovu s matricou. V článku je navrhnutá experimentálna metodika merania deformačných síl tenzomerickým snímačom pomocou laboratórnej aparatúry NI cDAQ a softwaru LabView od firmy National Instruments. Popísané sú deformačné krivky procesu pretláčania ECAP zliatin EN AW 6060 a OFHC (Oxygen Free High Conductivity) Cu po zonálnej rafinácii. Maximálne hodnoty deformačných síl (Fmax) vykazovali rozptyl v prvom ECAP prechode u oboch materiáloch hodnôt 23 kN, čo predstavuje z celkového rozsahu merania 23 %. V nasledujúcich prechodoch sa rozptyly zmenšovali, čo nepriamo poukazuje na homogenizáciu vstupnej štruktúry. Štvrtý prechod OFHP Cu zaznamenal rozptyl deformačných síl len 4,7%. Podobne u vzoriek z EN AW 6060 v tretom prechode klesol rozptyl na 4% z meraného rozsahu. U vzoriek zo zliatiny EN AW 6060 sa deformačné sily potrebné na pretláčanie v nasledujúcich prechodoch znižovali. To naznačuje na procesy odpevňovania. Naopak vzorky z vysoko čistej medi zaznamenali nárast deformačných síl.
Abstract
Production of ultrafine-grained metal materials represents modern and high perspective area of metallurgy. Currently, there are several methods for producing these materials. Severe plastic deformation (SPD) is one of the ways to prepare them. Equal-channel angular pressing (ECAP) is one of the most efficient techniques of SPD for production of bulk ultrafine-grained metals. In the SPD process is important of measurement deformation forces. The strain gauges sensors measure the strain forces with the necessary accuracy. About progressing action of plastic deformation can be assumed from the measured deformation forces. These forces include friction in contact points of metal with matrix. The article describes experimental methodic measuring deformation force with strain gages by laboratorial equipment NI cDAQ and commercial software LabView. Deformations curves of the ECAP process are described to alloy EN AW 6060 and of OFHC (Oxygen Free High Conductivity) Cu after zonal purification. Maximum values of deformation forces (Fmax) in the first ECAP passes show
scatter 23 kN, which represents the total measurement range of 23%. In following ECAP passes the scatter was decreasing. Fourth pass of the sample OFHP Cu reported scatter values Fmax 4,7%. Scatter Fmax of the sample EN AW 6060 in the third ECAP passes was reduced to 4 %. Samples of alloy EN AW 6060 during extrusion decrease of deformation forces in following ECAP passes. The samples of the OFHC Cu showed an increase of deformation forces.
Keywords: ECAP, severe plastic deformation, force, transducer, OFHC Cu, EN AW 6060
1. Introduction
Severe plastic deformation (SPD) is one of the methods to obtaining very fine crystalline structure in different crystallographic systems (e.g. aluminium, copper, iron, magnesium) [1-3]. After the SPD process materials have a number of improved mechanical and physical properties[4-6]. Growth of mechanical properties takes place without simultaneous loss of plasticity. [7]. The grain size in SPD materials is in range of 5-1000 nm [1]. ECAP represents high effective technique, which uses pure shearing strain under high pressure [8]. The ECAP process was developed by Segal et al. in Soviet Union [9,10]. The ECAP process is running without any radical change of shape and sizes of sample [11]. During SPD process is appropriate to measure deformation forces. From the deformation curves we are able to conclude about processes in zone of plastic deformation. Downward trend of deformation forces in following ECAP passes hint as dominant mechanical softening processes. Mechanical hardening of material occurs when the deforming forces in next passes are increased [12,13].
2. Methodology for measuring deformation forces
The strain gage sensor type 3 / 350 XK 11 was made in VSB Ostrava and used to measure the forces. In the sensor are used metal-foil strain gages with a resistance R1 - R8 = 350 Ohms. The maximum possible load of sensor is 1000 kN and 0.5% accuracy class. The principle scheme for measuring mechanical stress and forces with strain gage sensor is on Fig.1 [14,15].
Fig.1 Scheme of strain gage sensor
Programming environment is based on the LabVIEW graphical programming. The block diagram used for measure forces is shown in Fig. 3
Fig.3 Block diagram in LabVIEW to measure forces
3. Used materials and experimental methodology
Two different inputs materials have been used. The aluminum alloy EN AW 6060 with chemical composition in Table. 1. and material OFHC copper (99.99%) after zonal refining/purification. The dimensions of the OFHC Cu samples were before first pass d0 = 10 mm, l0 = 100 mm. The dimensions of aluminum samples were d0 = 10 mm and l0 = 90 mm.
Table 1 Chemical composition of aluminum alloy EN AW 6060
Material Si Fe Cu Mn Mg Cr Zn Ti EN AW 6060 0,3-0,6 0,1-0,3 max 0,1 max 0,1 0,35-0,6 max 0,05 max 0,15 max 0,1
Experiments were performed on hydraulic press with a constant speed of movement 1.73 mm/s. The material was extruded through ECAP die. The angle of intersection of two channels was equal 90◦ and outer round R5. Force sensors have been used to measure forces in the ECAP process. Laboratory apparatus in Fig.2 from National instruments and LabView software have been used to transfer signals from ECAP passes. The material OFHC Cu was processed five ECAP passes. Number of passes for EN AW 6060 have been from range 1 to 4. Route C (rotation around longitudinal axis 180o) was used for all ECAP passes. Processes were realized at the laboratory temperature.
4. Results and discussion
a) Dependence F = f(l) for OFHC Cu
Fig. 4 shows a set of first ECAP passes for four samples. Sample 1 and 2 reach Fmax parameter 20 kN higher than samples 3 and 4. Heterogeneity of the structure input material is reason of scatter deformation forces. Fig. 5 illustrates the deformation curve of the second ECAP passes for copper samples.
0 20 40 60 80 100 120 0 20 40 60 80 100 Length: l [mm] D e fo rm a ti o n f o rc e : F [ k N ] sample 1 sample 2 sample 3 sample 4
Fig.6 The set of measurements for the fifth ECAP passes
The effect of SPD is clearly seen in Fig. 6. Homogenization structure is evident from the decreasing scatter of deformation forces. Fmax at 40 mm extrusion were achieved scatter 5 kN, that represents only 4.7 % of measured range.
b) Dependence F = f(l ) for alloy EN AW 6060
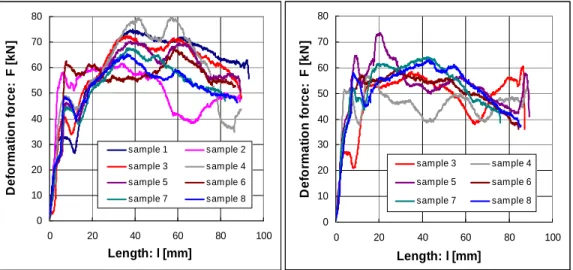
Waveforms in Fig. 7 have a large scatter of deformation forces. Scatter of the Fmax were 23 kN, that represents 28% from measured range. Scatter could be explained by non-homogeneties input structure. The Fig. 8 shows decreased scatter Fmax to 12.5% from measured range. Scatter Fmax in the third ECAP passes (Fig.9) was reduced to 4 % that is an indirect indicator of the homogenization internal structure.
0 20 40 60 80 100 120 0 20 40 60 80 100 Length: l [mm] D e fo rm a ti o n f o rc e : F [ k N ] sample 1 sample 2 sample 3 sample 4 0 20 40 60 80 100 120 0 20 40 60 80 100 Length: l [mm] D e fo rm a ti o n f o rc e : F [ k N ] sample 1 sample 2 sample 3 sample 4
Fig.4 The set of measurements for the first ECAP passes
Fig.5 The set of measurements for the second ECAP passes
Fig.9 The set of measurements for the third ECAP passes
5. Results
Fig. 10 shows the average values of deformation force ECAP passes from samples of OFHC Cu. The average value of Fmax in the first ECAP passes reached 90 kN and 95 kN in the second. Fmax in passes 3, 4 and 5 exceeded force above 100 kN. From the deformation curves it is evident that in extrusion process only a mechanical reinforcement has occurred. The stress needed to start the process of dynamic softening has not been achieved. Mechanical strengthening seen in the passes 1 to 4 was caused by the SPD processes. Stabilization of deformation forces are occurred after fourth passes.
Fig. 11 shows the average values of deformation force ECAP passes from alloy AN EW 6060. The deformation forces during extrusion in following passes were decrease. The first
Fig.8 The set of measurements for the second ECAP passes
Fig.7 The set of measurements for the first ECAP passes 0 10 20 30 40 50 60 70 80 0 20 40 60 80 100 Length: l [mm] D e fo rm a ti o n f o rc e : F [ k N ] sample 1 sample 2 sample 3 sample 4 sample 5 sample 6 sample 7 sample 8 0 10 20 30 40 50 60 70 80 0 20 40 60 80 100 Length: l [mm] D e fo rm a ti o n f o rc e : F [ k N ] sample 3 sample 4 sample 5 sample 6 sample 7 sample 8 0 10 20 30 40 50 60 70 80 0 20 40 60 80 100 Length: l [mm] D e fo rm a ti o n f o rc e : F [ k N ] sample 3 sample 4 sample 5 sample 6
pass reached a value Fmax 64 kN. In the next passes values of deformation force reached up to 60 kN. Downward trend of deformation forces refer to mechanical softening in the SPD process.
0 20 40 60 80 100 120 0 20 40 60 80 100 Distance: l [mm] D e fo rm a ti o n f o rc e : F [ k N ] 1 pass 2 pass 3 pass 4 pass 5 pass
Fig.10 Comparison of deformation forces on the number of ECAP passes from alloy EN AW 6060
0 20 40 60 80 100 0 20 40 60 80 100 Distance: l [mm] D e fo rm a ti o n f o rc e : F [ k N ] 1 pass 2 pass 3 pass 4 pass
Fig.11 Comparison of power depending on the number of ECAP passes Alloy EN AW 6060
6. Conclusions
1) The programmable software environment LabVIEW and hardware NI cDAQ with measuring module Ni-9237 is a flexible measurement system suitable for measuring the deformation forces.
2) It was confirmed that materials EN EW 6060 registered over the SPD process of softening.
3) Materials OFHP Cu reported during the SPD reinforcement. The scatter of deformation curves is decreasing with increasing number of ECAP passes.
Acknowledgements
The authors acknowledge the support given by the APVV – 20 – 027205. Length: l [mm]
References
[1] A. Rosochowski: Solid State Phenomena, Vol. 101-102, 2005, p 13-22.
[2] J. Bidulská, T. Kvačkaj, R. Bidulský, M. Actis Grande: High Temperature Materials and Processes, Vol. 27, 2008, No. 3, p. 203-207.
[3] M. Besterci, T. Kvačkaj, L. Kováč, K. Sulleiová: Kovove Materialy, Vol. 44, 2006, No. 2, p. 101-106.
[4] Valiev R.Z., editor.: Ultrafine-grained materials prepared by severe plastic deformation, vol. 21, Annales de Chimie. Science des Materiaux, 1996, p. 369, Special issue.
[5] Valiev R.Z., Korznikov A.V., Mulyukov R.R.: Mater Sci Eng 1993;A168:141.
[6] Valiev R.Z., Tsenev N.K. In: Langdon TG, Merchant HD, Morris JG, Zaidi MA, editors. Hot deformation of aluminum alloys. Warrendale (PA): The Minerals, Metals and Materials Society; 1991, p.319.
[7] B. Baretzky et al.: Reviews on Advanced Materials Science, Vol. 9, 2005, No. 1, p. 45-108. [8] R.Z. Valiev, T.G. Langdon: Progress in Materials Science, Vol. 51, 2006, No. 7, p.
881-981.
[9] Segal V.M, Reznikov V.I, Drobyshevskiy A.E, Kopylov V.I.: Russian Metall 1981;1:99.
[10]V.M. SEGAL: USSR Patent No. 575892, 1977.
[11]T. Kvačkaj, V. Vrchovinský, I. Pokorný, I. Mamuzić: Metalurgija, Vol. 44, 2005, No. 1, p. 49-51.
[12]R. Pernis, J. Bidulská: Manufacturing Engineering, Vol. 7, 2008, No. 4, p. 17-19. [13]J. Bidulská, I. Pokorný: Manufacturing Engineering, Vol. 7, 2008, No. 4, p. 39-41.
[14]M. Lupták: Detekce procesu řezání kapalinovým paprskem. Doktorská práce, Automatizace technologických procesů, Institut fyzikÿ, VŠB–TU Ostrava, 2008.
[15]K. Hoffmann: An Introduction to Measurements using Strain Gages. Hottinger Baldwin Messtechnik GmbH, Darmstadt, 1989.