Lincoln
University
Digital
Thesis
Copyright
Statement
The
digital
copy
of
this
thesis
is
protected
by
the
Copyright
Act
1994
(New
Zealand).
This
thesis
may
be
consulted
by
you,
provided
you
comply
with
the
provisions
of
the
Act
and
the
following
conditions
of
use:
you
will
use
the
copy
only
for
the
purposes
of
research
or
private
study
you
will
recognise
the
author's
right
to
be
identified
as
the
author
of
the
thesis
and
due
acknowledgement
will
be
made
to
the
author
where
appropriate
you
will
obtain
the
author's
permission
before
publishing
any
material
from
the
thesis.
I
Gene expression data analysis for identifying crucial gene
markers and subtype classification in breast cancer
______________________
A thesis submitted in partial fulfilment
of the requirements for the degree of
Master of Applied Science
at
Lincoln University
by
Aiman Hassan Almazroey
____________________________________
Lincoln University
III
Abstract & Keywords:
An abstracts of a thesis submitted in partial fulfillment of the requirements for the degree of Master of Applied Science (M.Appl.Sc.)
Gene expression data analysis for identifying crucial gene markers and
subtype classification in breast cancer
By
Aiman Almazroey
Breast cancer is one of the leading causes of death in women. Even with advances in early-stage breast cancer treatment, physicians are still lacking the ability to precisely predict which patients would benefit from adjuvant chemotherapy. Gene expression profiling studies have been used to provide us with insights into the heterogeneity of breast cancer. Therefore, patterns of gene activity can be identified by genome-wide measures of gene expression to subclassify tumours. This might provide a better means, than is currently available, of treating patients with breast cancer, and to help physicians find the accurate treatment (Wang, Klijn et al. 2005). This study uses a combination of three different clustering methods: Hierarchical clustering, Self-organizing maps (SOM) and Ward method to further explore and validate the characters of previously identified, novel, 306 intrinsic genes thought to discriminate five types of breast cancer (LumA, LumB, Normal-like, Basal-like and Her2). It is also used to derive improved cluster characterisations for accurate subtype identification from independent gene expression data analyses. Implementation of these methods, in widespread clinical practice at present, remains limited. From an exploratory pilot study in this research, it was found that one or more of the few most highly active genes in one subtype can be active in one or more other subtypes indicating that several gene markers are essential for subtype discrimination. Nevertheless, this study identified one or two potential genes for some
IV
subtypes that may be useful as markers in their identification. In the main part of the investigation, the originally selected whole gene set was assessed for their efficacy in subtype discrimination using Hierarchical clustering and SOM, both in conjunction with Ward method that indicates the optimum number of clusters (subtypes). Hierarchical-Ward method found 6 clusters and SOM-Ward method found 7 clusters as optimum compared to the 5 subtypes reported by the original authors from whose work the gene set used in this study was extracted. This indicated the heterogeneity of subtypes. In both methods, second optimum number of clusters was 2. Our clusters revealed interesting results: for example, closer examination of the 2 cluster structure from both Herarchical-Ward and SOM-Ward indicated that 3 subtypes (LumA, LumB and Normal-like) always cluster together and the other 2 subtypes (Basal and Her2) make up the second cluster.
The six and 7 optimum clusters from the two respective methods did indicate that most clusters contain patients from more than one subtype and revealed which subtypes are more likely to cluster together. These results indicate subtype overlap. Although not featured highly in SOM-Ward results, the 6 cluster format from this method was explored to compare with Herarchical-Ward results and outcomes from the two methods were identical. This gives validity to the results in the study. Interestingly, two out of the 7 clusters from SOM consisted of only one subtype each (LumA or Basal-like), and 1 out 6 clusters from Heirarchical-Ward also contained only one subtype (LumA); but these clusters did not contain all of the patients originally thought to be belonging to each particular subtype. However, these clusters containing only one subtype each may indicate the core behaviour of the respective subtype and is worth exploring further. The results overall points to the complexity of discriminating the subtypes due to their heterogeneity and overlap, when viewed through the selected set of 306 intrinsic genes; this study has shed light on these characteristics in a reliable and predictable way.
V
Keywords: gene expression, gene inhibition, clusters, Hierarchical clustering, Self-organizing maps (SOM), Ward method, intrinsic genes, LumA, LumB, Normal-like, Basal-like and Her2.
VI
Acknowledgements
I would like to extend my deepest thanks and appreciation to my supervisor Associate Professor Sandhya Samarasinghe for her valuable guidance and patience. I would also like to thank my co- supervisor Prof. Don Kulasiri for his help and assistance. I would like to thank the Saudi Arabian Ministry of Higher Education for granting me with the scholarship to do my Master degree at Lincoln University – New Zealand. I express my gratitude to my wife Alaa Almazroey for her valuable support during the course of my study; and to my parents for their moral support during my stay away from home. I extend my thanks to all my fellow students who offered me support and help during my study. Finally, I would like to convey my warm thanks to all staff and administrative secretaries of the Centre for Advanced Computational Solutions (C-fACS) and Department of Environmental Management, for their lovely reception, help and sense of humor.
VII
Contents
ABSTRACT ... III Acknowledgement ... VI Contents….. ... VII List of Figures ... IX List of Tables ... XI Chapter One ... 1 1 BACKGROUND ... 11.1 Aetiology and risk factors ... 2
1.2 Pathology ... 3
1.3 Symptoms and Signs ... 3
1.4 Diagnostic investigations ... 4
1.5 Treatment ... 5
1.5.1 Early breast cancer... 5
1.5.2 Neoadjuvant systemic therapy ... 6
1.5.3 Advanced breast cancer ... 7
1.6 Molecular intrinsic subtypes of breast cancer ... 8
1.6.1 Intrinsic subtypes of breast cancer ... 10
1.6.2 Prognosis of intrinsic subtypes ... 14
Chapter Two ... 16
2 OBJECTIVES OF THE STUDY ... 16
Chapter Three ... 18
3 MATERIALS AND METHOD ... 18
3.1 Methods of analyses ... 23
3.1.1 Ward Method ... 23
3.1.2 Hierarchical clustering method ... 25
3.1.3 Self-organizing maps (SOM)... 27
Chapter Four ... 31
4 RESULTS ... 31
4.1 Pilot investigation ... 31
4.1.1 Using Visualisation Analysis to identify potential markers ... 37
4.2 Replicating original outcomes - Hierarchical clustering ... 40
4.3 Analysis with Self-Organizing Maps (SOM): ... 49
5 DISCUSSION ... 63
1.6.1.1 The luminal cancers, A and B ... 11
1.6.1.2 HER2-enriched... 12
1.6.1.3 Basal-like ... 12
1.6.1.4 Claudin-low ... 13
1.6.1.5 Normal-like ... 14
VIII Chapter Six ... 67 6 CONCLUSIONS ... 67 7 RECOMMENDATIONS ... 68 REFERENCES: ... 70 Appendix A ... 75 Appendix B ... 82 Appendix C ... 86 Appendix D ... 90
IX
List of Figures
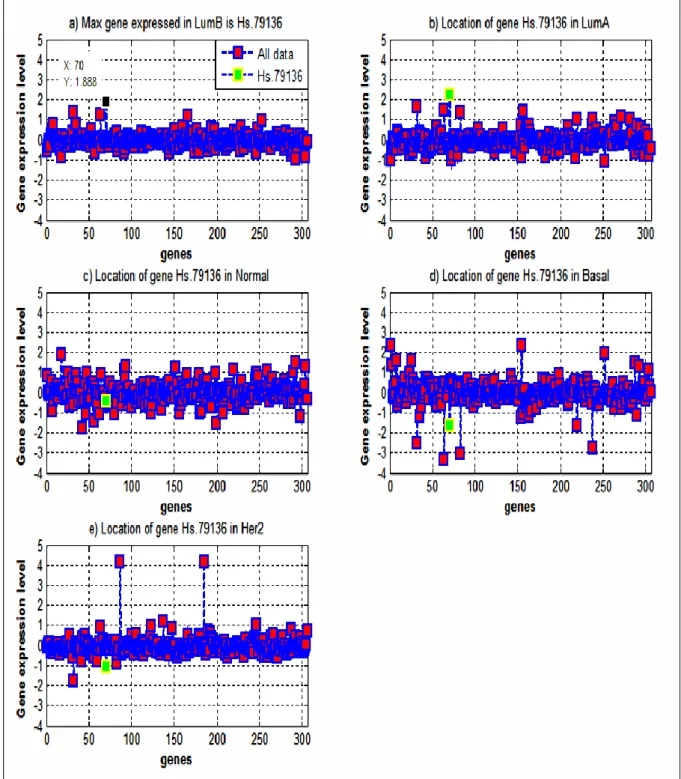
Figure 1: Self-organizing maps ... 28 Figure 2: The median value of the highly expressed gene in LumB (Hs. 79136 in black
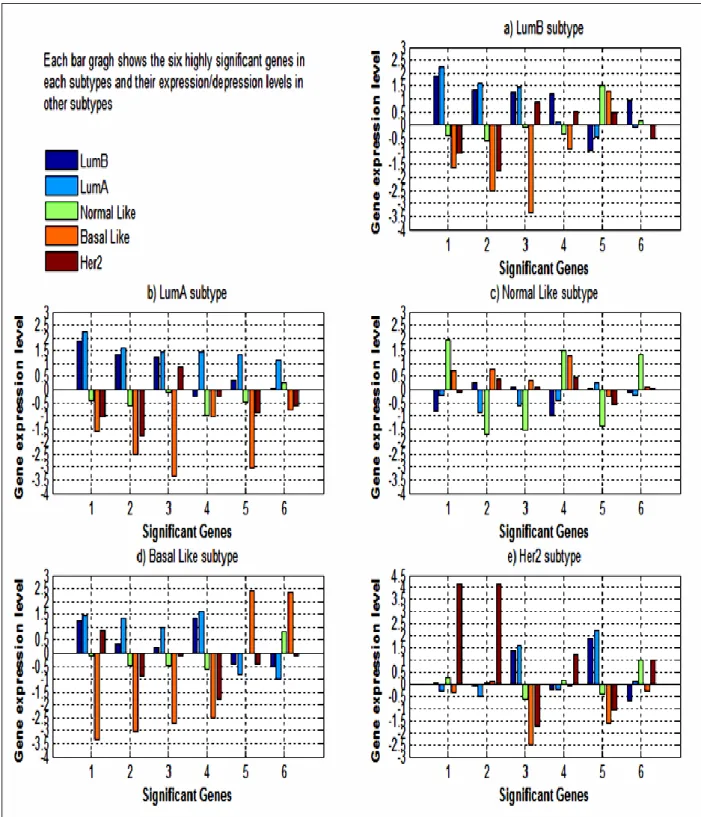
colour) compared to its median expression levels in other subtypes (green colour). . 32 Figure 3: The median expression level of the most highly expressed/inhibited six genes in
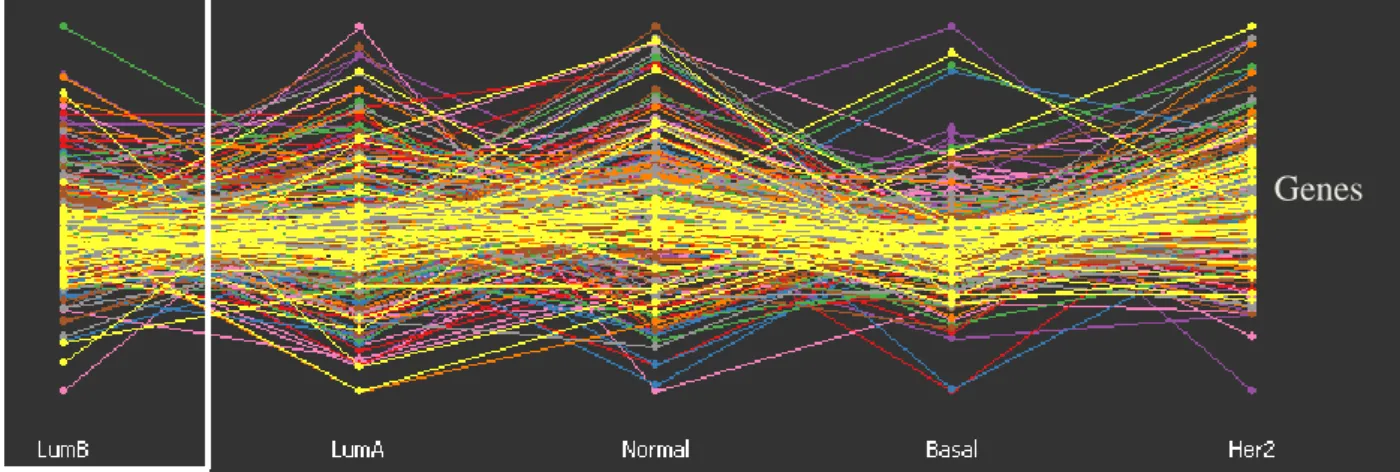
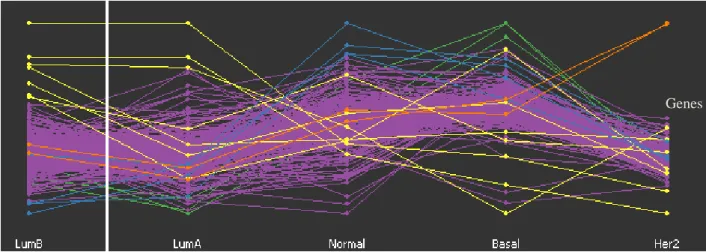
LumB, LumA, Normal Like, Basal Like, and Her2 subtypes. ... 36 Figure 4: GGobi software based parallel coordinate plot for the 306 genes across the 249
patients representing the 5 subtypes. ... 37 Figure 5: GGobi software displays a parallel coordinates for the 306 genes across the 249
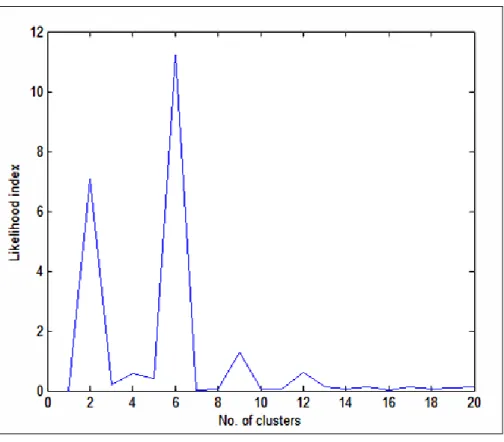
patients (subtypes) and highlighting only the most highly expressed genes visually and label them with different colours. ... 38 Figure 6: Ward likelihood index of hierarchical method for various numbers of clusters of
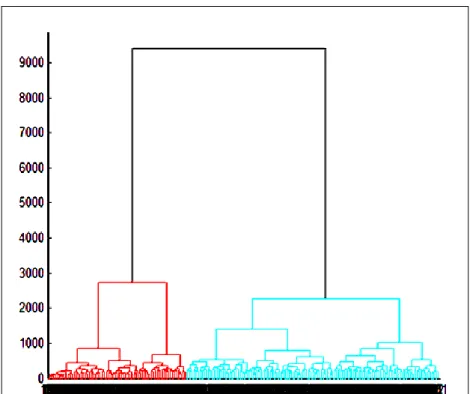
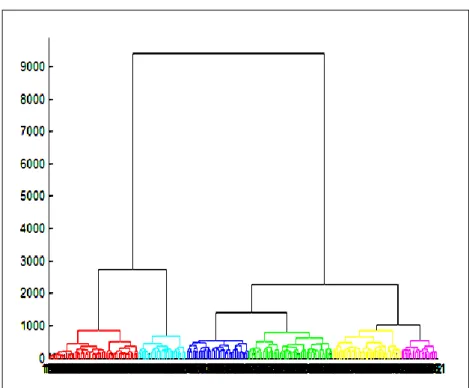
patients (subtypes). ... 41 Figure 7: A dendrogram specifying the two clusters of patients (at cut off point 2727)
according to their correlation strength. ... 43 Figure 8: A dendrogram specifying the five clusters of patients (at cut off point 1050)
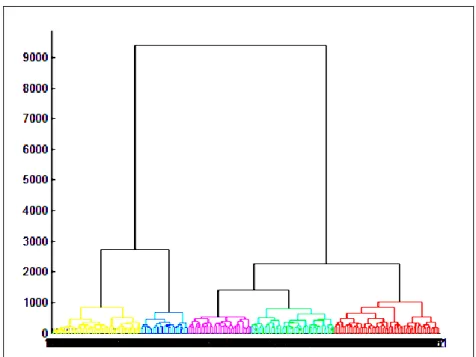
according to their correlation strength ... 45 Figure 9: A dendrogram specifying the six clusters of patients (at cut off point 847) according
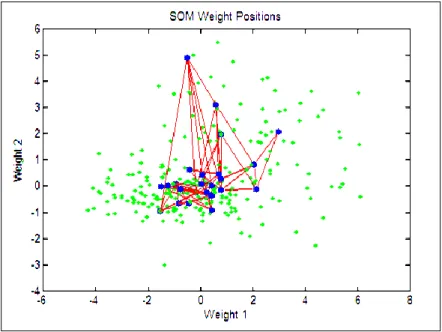
to their correlation strength ... 47 Figure 10: SOM plot of the inputs (green dots) and weights (blue) showing how the SOM
spans the input space. Neighbour neurons are connected by red lines. ... 50 Figure 11: SOM layer showing neurons as blue and their direct neighbour relations with red
lines. The neighbour patches (potential clusters) are coloured from black to yellow to show how close each neuron's weight is to that of its neighbours. ... 51 Figure 12: SOM layer with each neuron showing the number of inputs (patients) that it
classifies. The relative number of patients for each neuron is shown via the size of a coloured patch... 51 Figure 13: SOM layer with each neuron showing the number of inputs (patients) that it
classifies from each subtype (LumB, LumA, Normal Like, Basal Like and Her2). .. 52 Figure 14: Ward likelihood index for various numbers of clusters of SOM map neurons. ... 53 Figure 15: A dendrogram specifying the two clusters of patients (at cut off point 3000)
according to their correlation strength ... 56 Figure 16: A dendrogram specifying the five clusters of patients (at cut off point 1050)
according to their correlation strength ... 58 Figure 17: A dendrogram specifying the seven clusters of patients (at cut off point 845)
according to their correlation strength. ... 60 Figure 18: Bar graph illustrating the four most highly expressed genes in LumB vs. the
expression of the same genes in the other subtypes based on median log ratio. ... 75 Figure 19: The median expression of the highly expressed gene in LumA (black colour) vs. its
expression (green colour) in the rest of the examined subtypes. ... 76 Figure 20: Bar graph illustrating the four most highly expressed genes in LumA vs. the
expression of the same genes in the other subtypes based on median log ratio. ... 77 Figure 21: The median expression of the highly expressed gene in Normal (black colour) vs. the same gene expression in the rest of the subtypes (green colour). ... 78 Figure 22: The median expression of the highly expressed gene in Her2 (black colour) vs. the
same gene expression in the rest of the subtypes (green colour). ... 79 Figure 23: GGobi software based display of a scatterplot matrix for the 306 genes across the
249 patients for the subtypes highlighting only the most highly expressed genes visually and labelling them with different colours. ... 80
X
Figure 24: GGobi software based display of a time series (sequential) plot for the 306 genes across the 249 patients in the five subtypes highlighting only the most highly
expressed genes visually and labelling them with different colours. ... 81 Figure 25: A dendrogram using hierarchical single linkage method representing the
distribution of patients according to their correlation strength to clusters. ... 82 Figure 26: A dendrogram using hierarchical average method representing the distribution of
patients according to their correlation strength to clusters. ... 82 Figure 27: A dendrogram using hierarchical centroid method representing the distribution of patients according to their correlation strength to clusters. ... 83 Figure 28: A dendrogram using hierarchical complete linkage method representing the
distribution of patients according to their correlation strength to clusters. ... 83 Figure 29: A dendrogram using hierarchical median method representing the distribution of
patients according to their correlation strength to clusters. ... 84 Figure 30: A dendrogram using hierarchical Ward method representing the distribution of
patients according to their correlation strength to clusters. ... 84 Figure 31: A dendrogram using hierarchical weighted method representing the distribution of
XI
List of Tables
Table 3.1: The combined datasets of Sorlie et al. (2001; 2003), Van't Veer et al. (2002) and Sotiriou et al. (2003) arranged by Hu et al (2006). ... 22 Table 4.1: A summary of the six most significant genes with their expression levels in each
subtype. (The colour indicates if a gene is significant in more than one subtype). .... 35 Table 4.2: Two clusters obtained from the hierarchical-ward method of the current study... 42 Table 4.3: Matching percentage between original work and current study of hierarchical-ward
method. ... 42 Table 4.4: Five sub-clusters obtained from the hierarchical-ward method of the current study.
... 44 Table 4.5: Matching percentage between original work and current study of the 5 sub-clusters
obtained by hierarchical-ward method. ... 44 Table 4.6: Matching percentage between original work and current study of the 6 sub-clusters
obtained by hierarchical-ward method. ... 46 Table 4.7: The distribution comparison between the original five subtypes and the five
sub-clusters obtained from the hierarchical-ward method in the current study. ... 48 Table 4.8: The distribution comparison between the original five subtypes and the six
sub-clusters obtained from the hierarchical-ward method in the current study. ... 49 Table 4.9: Two clusters obtained from the SOM-Ward method including the number of
patients in each cluster. ... 55 Table 4.10: Comparison of the two clusters obtained from the current SOM-Ward with the
original subtypes ... 55 Table 4.11: Current data of SOM five sub-clusters including the number of patients in each
sub-cluster . ... 57 Table 4.12: compression of the five clusters from SOM with the original dataset 5 subtypes
(Hu et al. 2006). ... 58 Table 4.13: SOM seven clusters including the number of patients in each cluster. ... 60 Table 4.14: Comparison of the seven clusters from SOM with the original 5 subtypes (Hu et al. 2006). ... 60 Table 4.15: The distribution comparison between the original five subtypes and the five sub-clusters obtained from the SOM-Ward method in the current study. ... 62 Table 4.16: The distribution comparison between the original five subtypes and the seven
1
Chapter One
1 BACKGROUND
Breast cancer is a disease in which some cells multiply without control to form an abnormal mass. The most common form of breast cancer originates in the cells that line the ducts that carry milk to the nipple (ductal carcinoma). Other forms of breast cancer originate from the glands that produce milk (lobular cancer) or from other parts of the breast. Breast cancer is a common cause of death in women in New Zealand and worldwide (Ref. Global Cancer Statistics). Although Breast cancer occurs in both men and women, statistics show that this disease occurs 100 times more frequently in women than in men (Sasco, Lowenfels et al. 1993).
Globally, breast cancer incidence rates are highest in North America and northern Europe although incidence rate is decreasing in these parts of the world. The incidence rate is usually considered the lowest in Asia and Africa but there has been an increase in the rate in the recent years. These international differences are thought to be related to societal changes occurring during industrialization (e.g. changes in fat intake, body weight, age at menarche, and/or lactation, and reproductive patterns such as fewer pregnancies and later age at first birth) (Parkin, Bray et al. 2005). Studies of increasing breast cancer among first-generation daughters of Japanese Americans suggest that environmental and lifestyle factors are of greater significance than are genetic factors in explaining international differences in breast cancer risk (Johnson 2001; Deapen, Liu et al. 2002; Lacey, Devesa et al. 2002). Since 1975, mortality rates of Breast cancer have declined. These were because of the improvements of adjuvant therapies and attributed to the increased use of screening mammography (Berry, Cronin et al. 2005).
2
1.1 Aetiology and risk factors
The frequency of this disease in women has prompted an intensive study of risk factors for developing breast cancer to gain clues as to its aetiology as well as to identify modifiable risk factors that would be helpful for prevention strategies. Risk factors of breast cancer include age and gender. These are considered as one of the strongest risk factors (Jemal, Siegel et al. 2010). It is rarely found before the age of 25 except in some certain familial cases. The incidence rises throughout women’s lifetime (Robbins and cotrans), Race and ethnicity is another factor. In the US, although breast cancer is common in women of every major ethnic group there are interracial differences (Pike, Spicer et al. 1993; Peto and Mack 2000; Bradley, Given et al. 2002; Palmer, Wise et al. 2003; Jatoi, Chen et al. 2007; Jemal, Thun et al. 2008; Society 2009 - 2010). Much of these ethnic differences are attributable to factors associated with lifestyle and socioeconomic status (e.g. access to diagnosis and treatment).
Several lifestyle factors including body size, physical activity and dietary factors can contribute to the risk of breast cancer (van den Brandt, Spiegelman et al. 2000; Morimoto, White et al. 2002; Feigelson, Jonas et al. 2004; Lahmann, Hoffmann et al. 2004; Eliassen, Colditz et al. 2006; Ahn, Schatzkin et al. 2007).
Reproductive and hormonal factors such as prolonged exposure to higher concentrations of endogenous estrogen increases the risk of breast cancer (Kelsey, Gammon et al. 1993; Parkin, Bray et al. 2005).
Family history is an important risk factor for breast cancer where strong genetic mutations with little relation to environmental differences have been reported (Lichtenstein, Holm et al. 2000; Peto and Mack 2000; Ahn, Schatzkin et al. 2007).
Exposure to ionizing radiation of the chest at a young age, as occurs with radiotherapy treatment or in survivors of atomic bomb or nuclear plant accidents, is associated with an
3
increased risk of breast cancer (Guibout, Adjadj et al. 2005; Pukkala, Kesminiene et al. 2006; Ostroumova, Preston et al. 2008).
1.2 Pathology
More than 95 percent of breast malignancies arise from the breast epithelial elements and are therefore carcinomas. The term "breast carcinoma" encompasses a diverse group of lesions that differ in microscopic appearance and biologic behaviour, although these disorders are often discussed as a single disease.
The invasive breast carcinomas consist of several histological subtypes. These include infiltrating ductal (76 %), invasive lobular (8 %), ductal/lobular (7%), mucinous (colloid) (2.4%), tubular (1.5%), medullary (1.2%), and papillary (1%).
1.3 Symptoms and Signs
Most women with symptomatic rather than screen-detected breast cancer present with a painless increasing mass which may also be associated with nipple discharge, skin tethering, ulceration and, in inflammatory cancers, oedema and erythema. In developing countries, 80% are likely to be present with advanced disease and metastases. (Clark 2009)
Breast cancer can also present as a subtle change in the general appearance of the breast, such as an increase or decrease in size, a change in symmetry. There are conditions that may resemble the symptoms of breast cancer such as those related to menstrual cycles (cyclic or non-cyclic), and whether these symptoms are aggravated or alleviated by any activities or medications (Blake Cady 1998; Monica Morrow 2000).
4
1.4 Diagnostic investigations
The diagnostic evaluation of a patient suspected of having breast cancer includes screening and diagnostic breast imaging and breast biopsy. The majority of breast cancers are diagnosed as a result of an abnormal mammogram, but not all mammographic findings represent cancer (Stomper 2000; Ostroumova, Preston et al. 2008). It has been reported that fewer than 10 percent of cancers can be detected solely by physical examination and over 90 percent mammographically (Ostroumova, Preston et al. 2008). Positive mammographic findings mainly represent soft tissue masses and microcalcifications.
Contrast-enhanced breast magnetic resonance imaging (MRI) may complement mammographic staging, because the latter is more sensitive and is assumed that it would estimate the extent of disease more accurately than conventional imaging. However, the MRI may sometimes produce falsely positive result and can delay treatment by necessitating additional biopsies (Berg, Gutierrez et al. 2004; Bleicher, Ciocca et al. 2009).
Targeted ultrasonography is a useful diagnostic test to evaluate a palpable mass or an area of abnormality detected on mammogram. It is particularly useful for assessing whether a mass is solid or cystic in nature.
Chest radiography, abdominal/pelvic computed tomography (CT) scanning, and bone scans are other techniques commonly used in evaluating different body parts for the presence of metastatic disease.
Abnormal screening mammogram often needs further diagnostic evaluation with magnification views, spot compression views, targeted ultrasonography, tissue sampling or
5
biopsy (Barlow, Lehman et al. 2002). Biopsy helps obtaining sufficient diagnostic material using the least invasive approach and to avoid surgical excision of benign lesions (Barlow, Lehman et al. 2002).
Fine needle aspiration (FNA) is a classical method to determine the histopathological features of breast lumps by obtaining samples from cellular lesions and metastatic lymph nodes. A major advantage of FNA is that it can be easily and quickly performed at the time of a diagnostic study, with potential for an immediate preliminary interpretation (Pisano, Fajardo et al. 2001). However, the FNA has some disadvantages and produce false negative results in inexperienced hands (Pisano, Fajardo et al. 2001).
Core needle biopsy (CNB) is a procedure that removes small but solid samples of tissue using a hollow "core" needle that has a special cutting edge. Compared to FNA, CNB offers a more definitive histological diagnosis, avoids inadequate samples and may permit the distinction between invasive versus in situ cancer (Verkooijen 2002).
Tumour markers are used to assess the estrogen receptor (ER), progesterone receptor (PR), and human epidermal growth factor receptor 2 (HER2) status, and should be made on every primary invasive breast cancer to identify patients likely to benefit from endocrine and/or anti-HER2 therapy (Verkooijen 2002).
1.5 Treatment
1.5.1 Early breast cancer
The treatment of early breast cancer includes the treatment of locoregional disease with surgery, radiation therapy, or both, and the treatment of systemic disease with one or a
6
combination of chemotherapy, endocrine therapy, or biologic therapy. The need for, timing, and selection of therapy are based upon tumour variables such as histology, stage, and tumour markers; patient variables such as age, menopausal status, and comorbid conditions; as well as patient preference, such as a desire for breast preservation (Clark 2009).
1.5.2 Neoadjuvant systemic therapy
Neoadjuvant systemic therapy prior to local treatment may be required to improve surgical outcomes and options. For operable breast cancer, the aim is to increase the chance of breast conserving surgery in patients who would otherwise require mastectomy. For inoperable locally advanced breast cancers, the aim is to achieve operability.
Surgery as a local treatment may vary from wide local excision or segmental mastectomy and breast conservation for masses < 4 cm in diameter, to simple mastectomy with or without reconstruction. The choice is dictated by the location and extent of the breast mass in relation to the breast size, and patient preferences (Clark 2009). Breast cancer surgery has changed dramatically over the past several decades and continues to evolve (Cuzick, Stewart et al. 1994).
Radiotherapy is another local treatment that is given to the conserved breast after wide local excision to reduce local recurrence and to the chest wall after mastectomy if there are risk factors such as proximity to surgical margins or lymph node metastases, to complete the local control measures.
Adjuvant systemic therapy is also a local treatment that refers to the administration of endocrine therapy, chemotherapy, and/or biologic therapy after definitive local therapy for
7
breast cancer. Adjuvant systematic therapy has made a significant advancement in breast cancer patients with regards to disease-free survival and overall survival. (Carlson 2005; Goldhirsch, Glick et al. 2005). Using computer-based software, Adjuvant, is proved to be helpful in objectively estimating survival and benefit from adjuvant therapy, for early stage breast cancer patients, based on the clinico pathlogic features mentioned above (Ravdin, Siminoff et al. 2001). However, Adjuvant does not benefit very young women (Olivotto, Bajdik et al. 2005). Although, Adjuvant is useful in predicting the outcome for an individual patient when the clinico pathologic features are known, those clinic-pathologic features do not take into account the biological complexity of an individual’s tumour. Therefore, more reliable and precise prognostic and predictive models are needed to estimate what Adjuvant therapy should be offered to an individual patient.
1.5.3 Advanced breast cancer
Patients with established metastatic (i.e. advanced) disease may require endocrine therapy, chemotherapy and radiotherapy. The treatment is not curative but may be of great palliative benefit and consistent often with many years of good-quality life.
High levels of oestrogen receptors (ER) and progesterone receptors (PR) in their tumour have greater chance of responding to endocrine treatments. Endocrine therapy is usually tried first in patients with characteristics indications to respond and who do not have immediately life-threatening disease (Clark 2009). On the other hand, chemotherapy is used for patients who are unlikely to respond to hormonal treatment or who fail to respond to endocrine therapy or who require a rapid response if at risk such as in liver or respiratory failure cases. If chosen carefully, chemotherapy can provide good-quality palliation and prolongation of life (Clark 2009).
8
1.6 Molecular intrinsic subtypes of breast cancer
Breast cancer is a heterogeneous and phenotypically diverse disease. Breast tumours are characterised by cellular and molecular heterogeneity and large number of genes potentially involved in controlling cell growth, death, and differentiation. Some cancers such as Lymph node metastases (Fisher, Costantino et al. 1993), histologic grade (Elston and Ellis 1991), expression of steroid and growth factor receptors (Vollenweiderzerargui, Barrelet et al. 1986; Torregrosa, Bolufer et al. 1997), estrogen-inducible genes like cathepsin D (Foekens, Look et al. 1999), protooncogenes like ERBB2 (Slamon, Godolphin et al. 1989), and mutations in the TP53 gene (Bergh, Norberg et al. 1995; Borresen, Andersen et al. 1995) have been correlated to prognosis. However, individual prognostic factors provide limited information about the cellular changes induced by the disease. For example, removal of ovaries used to be considered as therapeutic in the past, which was successful in some patients, but not others. This shows that the prognostic value of many of these parameters may mislead the interpretation (Howat, Barnes et al. 1983; Battaglia, Scambia et al. 1988). It has been shown that correlating tumour cell gene’s cDNA microarrays with specific features of phenotypic variation might provide better understating of the taxonomy of cancer (Golub, Slonim et al. 1999; Alizadeh, Eisen et al. 2000; Perou, Sorlie et al. 2000; Hedenfalk, Duggan et al. 2001). These observations emphasize the importance of studying genetic basis of this disease to gain a better understanding.
Characterization (profiling) of breast cancers has advanced significantly since the turn of the millennium due to the development of sophisticated technologies. These include gene expression arrays, which permit simultaneous measurement of thousands of genes to create a molecular portrait of the tumour. Gene-expression profiling has helped in identifying breast cancer molecular subtypes that have distinct behaviour and response to therapy; and in the
9
development of prognostic and predictive molecular signatures. These in turn, have resulted in a better understanding of the biological heterogeneity of breast cancer. Microarray analyses on breast cancers have identified gene expression profiles able to separate tumour classes associated with patient survival (Sorlie, Tibshirani et al. 2003; Wang, Klijn et al. 2005).
Several studies on genome-wide expression patterns in cancer types, including lymphoma, breast, lung, liver, ovarian and soft tissue sarcomas have been carried out over the years. A common feature of these studies has been the emergence of tumour subtypes with distinct gene expression patterns for each subtype. The differences in gene expression patterns among these subtypes are likely to reflect basic differences in the cell biology of the tumours (Sorlie, Tibshirani et al. 2003; Sotiriou, Neo et al. 2003). Gene expression profiling, using microarrays to which cDNA or oligonucleotide probes are affixed, allows simultaneous measurement of the activity (expression) of thousands of genes in a breast cancer cell.
Gene expression arrays represent the level of expression of a group of genes in a semi-quantitative manner by comparing the level of messenger RNA (mRNA) to that of the mRNA of the same gene from a reference sample.
The two main types of molecular profiling techniques commonly used in the laboratory are “supervised” and “unsupervised” analyses. In supervised analyses, the gene sets are designed to differentiate tumours by a defined clinical endpoint; as such, the subtypes of cancer can be identified based exclusively on the clinical data. Prognostic molecular profiles (prognosis signatures) are examples of supervised analyses (Bair and Tibshirani 2004).
Unsupervised analysis (clustering) permits examination of gene expression patterns regardless of clinical endpoints and reflects inherent biologic differences. This approach does not use
10
any of the clinical information about the patient and therefore the subgroups are identified only by using the gene expression data (Bair and Tibshirani 2004).
In addition, there is the semi-supervised analysis which combines both gene expression data and clinical data. Clinical data is used to identify a list of genes that correlate with the clinical variables of interest and then unsupervised clustering techniques are applied to this subset of the genes (Bair and Tibshirani 2004). An example for the semi-supervised is the "intrinsic" subtypes.
1.6.1 Intrinsic subtypes of breast cancer
The intrinsic subtypes can generally be classified into two groups in relation to the expression of hormone receptor-related genes (Sorlie, Perou et al. 2001). Gene expression studies have identified several distinct breast cancers within these intrinsic subtype groups. The main subtypes are as follow: estrogen receptor (ER)-negative tumours: basal-like, human epidermal growth factor receptor-2 (HER2)-enriched and normal-like; and ER-positive tumours: luminal A and luminal B. A sixth breast cancer subtype, termed Claudine-low, has also been identified (Carey, Dees et al. 2007) as well as a Luminal C subtype (Sorlie et at. 2001). These subtypes differ markedly in prognosis and in the therapeutic targets they express. It is agreed that the first three are the major subtypes (Carey, Dees et al. 2007). The list of genes that differentiates the different subtypes is called the intrinsic list. It is made up of several clusters of genes relating to ER expression.
It has been found that ER-positive and ER-negative are two biologically different breast cancers and may derive from different progenitor cells.
11
1.6.1.1
The luminal cancers, A and B
These are so called because they are characterized by expression of genes similar to that expressed by normal breast luminal epithelial cells, and may overlap with ER-positive breast cancers. They typically express luminal cytokeratins 8 and 18. These are the most common subtypes that make up the majority of ER-positive breast cancers, and are characterized by expression of ER, PR, and other genes associated with ER activation.
Luminal A and luminal B have some important molecular and prognostic distinctions.
Luminal A tumours, which probably make up about 40 percent of all breast cancers, usually have high expression of ER-related genes, low expression of the HER2 cluster of genes, and low expression of proliferation-related genes (Fan, Oh et al. 2006; Hu, Fan et al. 2006). Luminal A tumours carry the best prognosis of all breast cancer subtypes (Voduc, Cheang et al. ; Sorlie, Perou et al. 2001; Sorlie, Tibshirani et al. 2003; Sotiriou, Neo et al. 2003; Loi, Haibe-Kains et al. 2007).
The less common (about 20 percent) luminal B tumours have relatively lower expression of ER-related genes, variable expression of the HER2 cluster, and higher expression of the proliferation cluster. Luminal B tumours carry a worse prognosis than luminal A tumours (Voduc, Cheang et al.) and with poor prognostic of 70-genes signature (Fan, Oh et al. 2006). Most luminal B cancers have high Recurrence Scores.
12
1.6.1.2
HER2-enriched
The HER2-enriched subtype (previously known as HER2+/ER-) makes up about 10 to 15 percent of breast cancers. It is characterized by high expression of the HER2, proliferation gene clusters, and low expression of the luminal cluster. For this reason, these tumours are typically negative for ER and PR, and positive for HER2. It is important to note that this subtype comprises only about half of clinically HER2-positive breast cancer. The other half has high expression of both the HER2 and luminal gene clusters and fall in a luminal subtype. In the era before HER2-targeted therapy, this subtype carried a poor prognosis (Voduc, Cheang et al.). This adverse natural history has been markedly affected by therapeutic advances in HER2-directed therapy.
1.6.1.3
Basal-like
The basal-like subtype makes up about 15 to 20 percent of breast cancers. It is so called because of some expression similarities to that of the basal epithelial cells. It is characterized by low expression of the luminal and HER2 gene clusters. For this reason, these tumours are typically ER-, PR-, and HER2-negative on clinical assays. It is therefore, nicknamed "triple-negative" (Olopade and Grushko 2001; Sorlie, Tibshirani et al. 2003; Foulkes, Brunet et al. 2004).
Basal-like breast cancer has unique risk factors. The most intriguing is that over 80 percent of cancers arising in women born with a mutation in the breast cancer gene 1 (BRCA1), early onset gene, are basal-like (Olopade and Grushko 2001; Sorlie, Tibshirani et al. 2003; Foulkes, Brunet et al. 2004). Nevertheless, most basal-like breast cancers are sporadic, and the BRCA1 gene and protein appear intact in these tumours. A commonly held assumption, but unproven,
13
is that the BRCA1 pathway is abnormal in sporadic basal-like breast cancer. This may have therapeutic implications since this pathway is important in DNA repair.
There is a notable association between the basal-like subtype, race and age. Population-based studies suggest that the basal-like subtype is overrepresented in breast cancer in African-American women, and developing during the premenopausal years (Fan, Oh et al. 2006; Millikan, Newman et al. 2008; Lund, Trivers et al. 2009; Parker, Mullins et al. 2009). This may explain its prevalence among young African-American women. Basal-like breast cancer is known to have poor prognosis; and this may contribute in part to the worse outcomes experienced by African-American women with breast cancer (Voduc, Cheang et al.). Fortunately, studies suggest that basal-like breast cancers are sensitive to modern chemotherapy (Rouzier, Perou et al. 2005; Carey, Dees et al. 2007). However, the absence of targeted therapy, of known effectiveness,to this subtype remains a real obstacle to improving outcomes.
1.6.1.4
Claudin-low
This newly described subtype is found in non-basal triple-negative breast cancers, which is uncommon but interesting because of its expression of epithelial-mesenchymal transition genes and characteristics reminiscent of stem cells.
This subtype comprises a minority of triple-negative breast cancers. It is characterized by low to absent expression of epithelial cell-cell adhesion genes (claudin 3, 4 and 7, E-cadherin), differentiated luminal cell surface markers (EpCAM and MUC1) and enrichment for epithelial-to-mesenchymal transition markers, immune response genes and cancer stem cell-like features (CD44+/CD24-, high ALDH1A1) (Carey, Dees et al. 2007). In contrast to
basal-14
like breast cancers, claudin-low tumours appear to be slower growing and, with features of mesenchymal and mammary stem cells, of different oncogenic origin.
1.6.1.5
Normal-like
This subtype was one of the first subtypes identified by gene expression arrays and consistently appears in breast cancer clusters. It is typified by similar gene expression pattern as normal breast cells, and thus remains enigmatic as to whether it represents a separate subtype or a technical artefact introduced by low tumour cell composition of the sampled specimen.
The challenge is how to define the intrinsic subtypes of breast cancer. They have been identified using cluster analysis of gene expression data from frozen banked tissue. This method uses fixed tissues and has poor reproducible classification. Recently, a new assay (PAM50) has been developed. It is a 50-gene reverse transcription-polymerase chain reaction (RT-PCR) based method, and is derived from a 500-gene intrinsic list. It can be performed on fixed tissue but has not yet been sufficiently validated for clinical use (Parker, Mullins et al. 2009). Others methods include immunohistochemical surrogates for the intrinsic subtypes. These are reasonable but also have not been validated, and the simplest schema using clinical assays for ER, progesterone receptor (PR), and HER2 misclassify a significant proportion of tumours (Carey, Perou et al. 2006).
1.6.2 Prognosis of intrinsic subtypes
The intrinsic subtypes were developed to identify relevant biology, not for prognosis. However, in multiple independent datasets, these subtypes correlate with prognosis. In
15
general, patients with the luminal A subtype have the best prognosis; patients with the other major hormone receptor-positive subtype, luminal B, suffers a significantly worse outcome. In a population-based study of nearly 500 tumours using immunohistochemical proxies for the subtypes, the best outcome was observed among patients with luminal A tumours compared with the other subtypes, and the worst outcome was seen among basal-like breast cancers (Carey, Perou et al. 2006). Both the basal-like and HER2-enriched subtypes have the worst survival chances, at least until recently. The HER2-targeting has altered the outcome for the HER2-enriched subtype and HER2-positive luminal cancers.
In summary, clustering or unsupervised classification approaches are used to build groups of genes, with related expression patterns, and separate genes into highly similar groups without predefined group labels. Clustering is a common method of gene expression data analyses. Most researchers use clustering methods based on similarity/dissimilarity, distance measure and hierarchical clustering. Several studies have concluded that using gene-expression profiling would be potentially crucial as a new prognostic and predictive tool. However, validation of the clinical use of this technology, at the moment, is still a major challenge for microarray studies, particularly with clinical implications.
The conflicting number of clusters reported by different studies may be due to the number of samples analysed and/or the method of analysis in identifying the overlapping between cluster classes. Almost all previous studies applied Hierarchical clustering method, and no attempts have been made to use alternative clustering methods that might be more helpful in clearly identifying the clusters, and the present study aimed at exploring the possibility of using combined clustering analysis methods to enhance the identification accuracy.
16
Chapter Two
2 OBJECTIVES OF THE STUDY
Breast cancer patients with the same diagnostic and clinical prognostic profile can have markedly different clinical outcomes. Classification of breast cancer based on gene expression profiling captures the molecular complexity of tumours. Patterns that distinguish subtypes further can provide a more refined stratification of the patients compared to individual tumour markers Hu et al., (2006). Current classifications assign a patient’s gene expression signature to a single class (i.e. subtype). This means that all patients in a subtype should show similar expression patterns. Although this has been considered generally true, it is now recognised that a reason for relapse or an adverse response to therapy is that some patients normally do not clearly show typical symptoms of one subtype. Such patients may be on the borderline of a subtype, may show symptoms of more than one subtype, or there are other subtypes currently unknown.
This study aims at further exploring the characters of novel breast cancer genes (intrinsic genes) that have been previously identified and to refine the classification of breast cancer subtypes through advanced gene expression data analyses. The primary aim of this study is to do a new analysis by combining two known different clustering methods; (i.e. Hierarchical clustering and Self-organizing maps (SOM)). The data used in the current analysis method were those reported by Hu et al (2006). The training data contains 259 samples (patients) representing five subtypes of cancer (Luminal A, Luminal B, HER2-enriched, Basal-like, and Normal-like); and the 306 genes identified by Hu et al., (2006) and used to obtain a corresponding set of five class centroids using hierarchical clustering (Table 3.1).
17
The proposed new approach may help: (i) Study characteristic spread of gene expression patterns within a predefined subtype. This will provide more clarity into the variability within a subtype. (ii) Identify similarity/closeness and/or overlapping of subtypes which may help identify patients who cannot be clearly categorised into a specific subtype. This can help in choosing the appropriate treatment.
18
Chapter Three
3 MATERIALS AND METHOD
Methods used previously by four main investigating groups were adopted as a base line for the analysis in the present study. A brief description of the work of these groups is as follows:
Sorlie et al (2001) studied 85 tissue samples in which tumour specimens contained more than 50% tumour cells and the mRNA microarrays for those cells were processed. They selected 456 cDNA clones from an 8,102 intrinsic gene list as representatives for Basal-like, ERBB2+, Normal Breast-like, Luminal Subtype C, Luminal Subtype B and Luminal Subtype A. Those genes were with significantly greater variation in expression between different tumours than between paired samples from the same tumour. This measure was taken to represent inherent properties of the tumours themselves rather than just differences between different samplings. They concluded that relating gene expression patterns to clinical outcomes is a key issue in understanding the biological diversity of the tumours, and this will improve the chances of choosing the suitable type of treatment.
Later, Sorlie et al., (2003) conducted a study to further refine the previously defined (Sorlie et al., 2001) subtypes of breast tumours that have distinct patterns of gene expression. They used Hierarchical (unsupervised) clustering analysis based on expression pattern of 534 intrinsic genes. These genes were selected on the basis of the similarity of the expression level. The results of the study supported the concept that the studied breast tumour subtypes represent biologically distinct disease entities.
19
Van't Veer et al. (2002) used DNA microarray analysis on primary breast tumours of 117 patients, and applied supervised classification to identify a gene expression signature strongly predictive of a short interval to distant metastases in patients without tumour cells in local lymph nodes at diagnosis.
Approximately 5,000 genes were selected out of 25,000 genes because they are significantly regulated in more than 3 tumours out of 78. These selected genes were clustered on the basis of their similarities. They suggested that the tumours can be divided into two types on the basis of this set of significant genes. The first type is a good prognostic (i.e. related to low metastasis risk) and the second type is a poor prognostic (i.e. associated with a high metastasis risk). Their finding of separating tumour classes associated with patient survival supported those previously reported by Sorlie et at. (2001), but they extended the work to gene expression (or genetic profile) associations with survival in an untreated, node negative cohort. In their work to identify reliable good and poor prognostic tumours they used a powerful three-step supervised classification method, similar to those used previously by (Gruvberger, Ringnér et al. 2001; He and Friend 2001; Khan J 2001). The correlation coefficient of the expression for each gene with disease outcome was calculated. It was found that 231 genes were significantly associated with disease outcome. The 231 genes were then rank-ordered on the basis of the magnitude of the correlation coefficient. This was followed by optimizing the number of genes in the 'prognosis classifier' by sequentially adding subsets of 5 genes from the top of this rank-ordered list and evaluating its power for correct classification using the 'leave-one-out' method for cross-validation. The accuracy improved until the optimal number of marker genes was reached, which was 70 genes. Their results showed that the gene expression profile outperformed the available clinical parameters, at the time, in predicting disease outcome. Their findings provided a strategy to select patients who would benefit from adjuvant therapy.
20
Sotiriou et al. (2003) selected 99 patients out of 700 patient population and the overall survival for this group was adjusted for standard prognostic factors of tumour size and nodal status comparable to the population. They conducted a study of comprehensive gene expression patterns generated from cDNA microarrays obtained with a 7,650-feature microarray (using unsupervised hierarchical clustering approach) and correlated that with detailed clinico-pathological characteristics and clinical outcome in the group of 99 node-negative and node-positive breast cancer patients. Gene expression patterns were found to be strongly associated with estrogen receptor (ER) status and to be the most important discriminator of expression subtypes, but moderately associated with grade, and not associated with menopausal status, nodal status, or tumour size. Hierarchical cluster analysis segregated the tumours into two main groups based on their ER status, which correlated well with basal and luminal characteristics. Their findings were in strong agreement with the findings of Perou et at. (2000), Sorlie et at. (2001) and Van't Veer et al. (2002) that the ER biology plays a central role in breast carcinogenesis defining the configuration of the final tumour.
The conditions and outcomes of the studies mentioned above have been used by Hu et al. (2006) who conducted breast cancer microarray analyses and subtype clarification study on a set of 259 breast cancer samples, represented by 306 expressed genes. This dataset was collected from the above four different studies (Table 3.1). These are ‘Gene expression patterns of breast carcinomas distinguish tumour subclasses with clinical implications’ (Sorlie, Perou et al. 2001), ‘Gene expression profiling predicts clinical outcome of breast cancer’ (van 't Veer, Dai et al. 2002), ‘Repeated observation of breast tumour subtypes in
21
independent gene expression datasets’ (Sorlie, Tibshirani et al. 2003) and ‘Breast cancer classification and prognosis based on gene expression profiles from a population-based study’(Sotiriou, Neo et al. 2003).
The collected data was pooled and analysed by Hu et al. (2006) to define intrinsic subtypes by utilising pathological/clinical data as well as gene expression data. They first evaluated the datasets independently, and then combined them to find 306 breast genes which were analysed using the hierarchical clustering method. Hu et al. (2006) created a single data table from these four sets as follow:
i. Firstly, identifying the common genes present across all four microarray datasets (2800 genes).
ii. Secondly, Using Distance Weighted Discrimination (DWD) to combine these four datasets (Benito, Parker et al. 2004).
DWD is a multivariate analyses tool that performs statistical corrections to reduce systematic biases resulting in separate datasets. It then makes a global adjustment to compensate for these biases: in essence, each separate dataset is a multi-dimensional cloud of data points. It takes two point clouds and shifts one, such that it more optimally overlaps the other.
iii. Finally, they determined that 306 of the 1300 unique intrinsic genes were present in the combined test set and performed a hierarchical clustering analysis.
22
Table 3.1: The combined datasets of Sorlie et al. (2001; 2003), Van't Veer et al. (2002) and Sotiriou et al. (2003) arranged by Hu et al (2006). Microarray type Validation Informative genes Metastasis determinants References cDNA Independent datasets
306 genes Luminal A, Luminal B,
HER2-enriched, Basal-like, and Normal-like Hu et al., (2006) cDNA Independent training set
99 genes invasive ductal carcinomas;
46 individuals were node negative and 53 were node positive
Sotiriou, et al., (2003).
cDNA Crossvalidation 534 intrinsic genes Repeated finding in independent datasets Sorlie et al., 2003 Oligonucleotide Independent training set
70 genes ‘Good signature’ is related
to low metastasis risk; a ‘poor signature’ is associated with a high metastasis risk.
Van't Veer et al., (2002)
cDNA 456 ‘intrinsic’
genes
‘Luminal A’ tumours have a better outcome than ‘luminal B’ tumours. Worst outcome is for ‘basal-like’ and ‘ERBB2+’ tumours
Sorlie et al., (2001)
The work of Hu et al., (2006) identified the five main subtypes corresponding to the previously defined HER2+/ER-, Basal-like, LumA, LumB and Normal Breast like tumour groups (Perou, Sorlie et al. 2000; Sorlie, Perou et al. 2001). This type of analysis provides more statistical power to perform multivariate analyses. It would also yield more meaningful results because any findings would need to be shared/present across all four datasets.
The finding of Hu et al., (2006) is considered as the starting point for this proposed study. The Matlab 5 Toolboxes used to investigate the datasets in this study are: SOM Toolbox for SOM and Statistics Toolbox for both Ward and Hierarchical clustering. SOM Toolbox can be downloaded free of charge under the GNU General Public License from http://www.cis.hut.fi/projects/somtoolbox.
23
3.1 Methods of analyses
In this study, after a pilot study to explore the most highly influential genes (potential markers) in each subtype, we used a new approach of analyses by combining two pairs of analyses methods (Hierarchical-Ward and SOM-Ward clustering) to:
Diagnostic markers for each subtype (pilot study).
Validate the clusters found by the original authors Hu et al., (2006).
Find relationship or similarity between subtypes to identify subtypes that can mask each other.
Identify possible new cancer subtypes.
Three specific methods are going to be used in this study in an in-depth investigation of tumour subtypes: Hierarchical clustering, Self-organizing maps (SOM) and Ward method and with these three methods, it will be possible to display differences more clearly between the subtypes than using only one method. These methods are employed after an initial pilot study involving the most significant genes. A summary of these methods is as follows:
3.1.1 Ward Method
In Statistics, Ward method uses an analysis of variance approach to evaluate the distances between clusters. Ward's minimum variance method is a special case of the objective function approach originally presented by (Ward 1963). Ward suggested a general agglomerative hierarchical clustering procedure that, in general, is regarded as very efficient; however, it tends to create clusters of small size, where the criterion for choosing the pair of clusters to merge at each step is based on the optimal value of an objective function. To illustrate the procedure, Ward used the example where the objective function is error sum of squares, and this example is known as Ward's method or more precisely Ward's minimum variance
24
method. In brief, this method attempts to minimize the Sum of Squares (SS) of any two (hypothetical) clusters that can be formed at each step (Ward 1963). Ward method works as follow:
Uses an analysis of variance approach to evaluate the distances between clusters.
Attempts to minimize the Sum of Squares (SS) of any two (hypothetical) clusters that can be formed at each step.
Where and denote two specific clusters nr and ns denote the number of data
points in the two clusters and and denote the centres of gravity of the clusters; is the Euclidean norm.
The mean and cardinality of the new cluster built as a product of the merger step is computed as follows
When Ward method used on a trained SOM (Section 3.1.3), the homogeneity of clusters within the map is achieved by merging only neurons and clusters that are neighbours in the map (Samarasinghe 2007). Ward method helps to find the optimum cluster structure that indicates the best level of clustering. This method computes the likelihood of various numbers
25
of clusters from which the most appropriate number of clusters can be obtained based on a likelihood index defined as
Where is the distance between the centres of the two cluster to be merged in the current step, and and are the distance between merged clusters in the previous step and the step earlier than the previous. is the number of cluster left.
3.1.2 Hierarchical clustering method
Hierarchical clustering (connectivity based clustering) is one of the most straightforward methods among numerous ways in which clusters can be formed. It is based on the core idea of objects being more related to nearby objects than to objects farther away. It can be either agglomerative (aggregating single patient into clusters) or divisive (dividing complete data set into partitions) (Johnson's 1967).
Agglomerative hierarchical clustering considers each case as a cluster. Any two objects that have the smallest value on the distance measure (or largest value if similarities are used) are joined into a single cluster. Either a third patient is added to this cluster that already containing the two objects, or a new cluster is formed by merging two new other objects. At each step, individual objects are added to existing clusters, two individuals are combined, or two existing clusters are combined.
The distance between two clusters with more than one patient in a cluster can be defined in different ways. For example, average distances between all pairs of patients formed by taking
26
one member from each of the two clusters in turn and calculating the distance to other members to find the average distance. Or the largest or smallest distance between two patients that are in different clusters can be taken. Computing methods to measure the distance between clusters are available; however, different methods suffer from producing different solutions.
The distance between sets of observations as a function of the pairwise distances between observations is determined by linkage criteria.
The linkage function uses the distance information generated to determine the proximity of objects to each other. Once the proximity between objects in the data set has been computed the objects are paired into binary clusters, and the newly formed clusters are grouped into larger clusters until a hierarchical tree is formed. Different distances, different clusters will form, what is known as the dendrogram. A dendrogram is a tree diagram frequently used to illustrate the arrangement of the clusters produced by the hierarchical clustering. It is a useful approach to illustrate the clustering of genes or samples in Computational Biology.
To form clusters using a hierarchical cluster analysis, the following must be identified: a criterion to determine the similarity (or distance) between patients (such as Euclidean distance); a criterion to determine the merging of identified clusters at consecutive steps (such as minimum variance); and selecting the number of clusters to represent a particular dataset. The Ward method can be applied with hierarchical clustering to find the optimal number of clusters in the dendrogram.
27
3.1.3 Self-organizing maps (SOM)
The self-organizing map (SOM) is an artificial neural network algorithm used to visualize and interpret large high-dimensional datasets. This helps us to understand these high dimensional data by organising them on a map of reduced dimensions. The learning process is competitive and unsupervised. The components of SOMs are nodes or neurons that are usually arranged in a two-dimensional hexagonal or rectangular grid. A neuron is represented by a weight vector with the same dimension as the input vector and neuron weights are initially set to small random value. Neurons in a trained map represent the centre of gravity of a cluster input vectors. Self-organizing maps operate in two modes: training to build the map using input examples, and mapping to automatically classify a new input vector. The Euclidean distance is the most commonly used method to determine the neuron with the shortest distance to an input, called “the winner”. SOMs preserve topological properties of the input space. They use a neighbourhood feature to adjust neuron weights, not only of the winner neurons with the closest distance to an input vector, but also of their neighbour neurons. Furthermore, it presents mapping from a higher dimensional input space to a lower dimensional map space. This makes it possible to visualise the organisation of input vectors. Learning in self-organizing maps aims to specialise parts of the network to respond similarly to certain input patterns.
Figure 1 gives a pictorial example of a trained SOM; where the darker colour represents the area of larger distance between neurons (i.e., between weights). Smaller distances are represented by the lighter colour. This shows that the white areas represent different clusters and the black lines represent the boundaries between them.
28
Figure 1: Self-organizing maps
3.1.3.1
Self-Organizing Map algorithm
Assume that some sample datasets have to be mapped onto an SOM. The set of input samples is described by a real vector
x(t)ЄRn
[5]
Where (t) is the index of the sample, or the discrete-time coordinate. Each node (i) in the map
is represented by a weight vector
mi(t)ЄRn [6]
which has the same number of elements as the input vector x(t). The SOM algorithm
performs an iteration process, where the initial values of the components of the weight vector, mi(t), may be selected at random. In practical applications, however, the model
vectors are more profitably initialized in some orderly fashion, e.g., along a two-dimensional subspace, spanned by the two principal eigenvectors of the input data vectors (Kohonen 1995c). Additionally, a batch version of the SOM algorithm may also be used (Kohonen
29
1995c). The mi(t) which matches best with x(t) in some metric, is thought to map that input
into its location. The self-organizing algorithm creates the ordered mapping as a repetition of the following basic tasks:
i. An input vector x(t) is compared with all the weight vectors mi(t). The best-matching
unit (node) on the map is selected. It is often called the winner.
ii. The weight vectors of the winner and a number of its neighbouring nodes in the array
are changed towards the input vector according to the learning principle specified below.
The basic idea behind the learning process of SOM is that, for each sample input vector x(t), the winner and the nodes in its neighbourhood are brought closer to x(t) in the input data space. During the learning process, individual changes may be contradictory. However, the net outcome in the process is that ordered values for the mi(t) emerge over the map. If the number of available input samples is restricted, the samples must be presented iteratively to the SOM algorithm.
Adaptation of the weight vectors in the learning process may take place according to the following equations:
mi(t + 1) = mi(t)+α(t)Nc(t) [x(t) – mi(t)]foreachiЄNc(t), [7]
Otherwise,
mi(t + 1) = mi(t) [8]
where t is the discrete-time index of the variables, the factor α(t) Є [0,1] is a scalar that defines the relative size of the learning step (learning rate), and Nc(t) specifies the strength of
30
The radius of the neighbourhood, at the beginning of the learning process, is fairly large. However, it is made to shrink during learning. This ensures that the global order is obtained already at the beginning, whereas towards the end, as the radius gets smaller, the local corrections of the model vectors in the map will be more specific. Gaussian neighbour strength as a function of radius is commonly used. The learning rate α(t) also decreases during learning.
31
Chapter Four
4 RESULTS
4.1 Pilot investigation
An initial analysis was conducted on 306 genes involving 5 types of cancer across 249 samples (patients). The set of data was the same as that used in the study of Hu et al. (2006). The purpose of the analysis was to identify genes that might be significantly related to each individual subtype, by using a preliminary exploration of the 306 genes (described below). If a gene is highly significant in one subtype but not significant in any other subtype, this can be used as a unique marker exclusive to that subtype.
The 306 genes were plotted against the gene expression level of each patient under each subtype. The value of the expression level is represented by ratio of (Abnormal/Normal). These values can be classified into normal, highly expressed, or highly depressed. Both the highly expressed and the highly depressed are indicators of cancer. The data were analysed using Matlab software to identify the median expression level of the most significantly expressed genes.
The results of the analysis are illustrated in Figure 2. The figure shows that the most significantly expressed gene in LumB subtype is Hs.79136 gene, at +1.888 expression level (Figure 2a, black colour). The expression level of the same gene (green colour) was +2.225 in LumA (Figure 2b), -0.402 in Normal Like (Figure 2c), -1.638 in Her2 (Figure 2d), and -1.063 in Basal Like (Figure 2e), respectively.
From these results it is evident that the Hs.79136 gene has significant expression levels, in different degrees, across almost all studied subtypes. For example, this gene is more highly