Graduate Theses and Dissertations Iowa State University Capstones, Theses and Dissertations 2017
Value-based model and analysis of autonomous
unmanned aircraft systems based on operational
scenario
Akash Vidyadharan Iowa State University
Follow this and additional works at:https://lib.dr.iastate.edu/etd
Part of theAerospace Engineering Commons, and theCivil Engineering Commons
This Thesis is brought to you for free and open access by the Iowa State University Capstones, Theses and Dissertations at Iowa State University Digital Repository. It has been accepted for inclusion in Graduate Theses and Dissertations by an authorized administrator of Iowa State University Digital Repository. For more information, please [email protected].
Recommended Citation
Vidyadharan, Akash, "Value-based model and analysis of autonomous unmanned aircraft systems based on operational scenario" (2017).Graduate Theses and Dissertations. 16685.
i
Value-based model and analysis of autonomous unmanned aircraft systems based on operational scenario
by
Akash Vidyadharan
A thesis submitted to the graduate faculty
in partial fulfillment of the requirements for the degree of MASTER OF SCIENCE
Major: Aerospace Engineering
Program of Study Committee: Christina Bloebaum, Co-major Professor
Halil Ceylan, Co-major Professor Thomas Ward III
Clark Wolf
The student author and the program of study committee are solely responsible for the content of this thesis. The Graduate College will ensure this thesis is globally accessible
and will not permit alterations after a degree is conferred.
Iowa State University
Ames, Iowa
2017
ii TABLE OF CONTENTS Page LIST OF FIGURES iv LIST OF TABLES v NOMENCLATURE vi ACKNOWLEDGMENTS vii ABSTRACT viii CHAPTER 1 INTRODUCTION 1
CHAPTER 2 RESEARCH QUESTIONS 4
Research Question 1 4
Research Question 2 5
Research Question 3 6
Organization of Thesis 7
CHAPTER 3 BACKGROUND 8
Unmanned Aircraft Systems 9
Structural Health Monitoring 11
Systems Engineering 12
Multidisciplinary Design Optimization 15
iii
CHAPTER 4 UNMANNED AIRCRAFT SYSTEM MODEL 18
CHAPTER 5 VALUE MODEL AND ANALYSIS 26
Value Model for Operational Scenario 29
Value Model for UAS Rating and Evaluation 36
CHAPTER 6 APPLICATION OF DEVELOPED VALUE MODEL 43
Operations Value and Risk Analysis 44
Evaluation of UAS Operational Scenarios using Value Function 46
CHAPTER 7 VALUE FUNCTION SENSITIVITY ANALYSIS 62
Operational Scenario 1 Sensitivity Analysis 63
Operational Scenario 2 Sensitivity Analysis 65
Operational Scenario 3 Sensitivity Analysis 67
CHAPTER 8 SUMMARY, CONCLUSION AND FUTURE WORK 69
Summary and Conclusion 69
Future Work 70
REFERENCES 71
APPENDIX MATLAB CODE FOR OPERATIONS VALUE AND
iv
LIST OF FIGURES
Page
Figure 1 Hexacopter and Quadcopter UAS in flight 10
Figure 2 Systems Engineering V-Model 14
Figure 3 Value-Driven Design Process 16
Figure 4 Hierarchical decomposition of a fixed-wing UAV system 18
Figure 5 Hierarchical decomposition of a multi-copter UAV system 19
Figure 6 Design Structure Matrix of a multirotor UAS 20
Figure 7 Multicopter UAS breakdown and connection to performance attributes 21
Figure 8 Primary stakeholders in UAS operations 25
Figure 9 Parameters for operational scenario and UAS rating 26
Figure 10 Model for decision analysis of UAS operations 28
Figure 11 Model representing relation between environment and task complexity 29
Figure 12 Model relating autonomy level and technology readiness level 36
v
LIST OF TABLES
Page
Table 1 List of attributes and design variables of a fixed-wing UAS 22
Table 2 Preferences of UAS operators from various industries 24
Table 3 List of infrastructure types with attributes and metrics 31
Table 4 List of data acquisition methods with metrics 33
Table 5 List of attributes with weights for data acquisition methods 34
Table 6 List of Autonomy Levels (AL) with descriptions 38
Table 7 List of Technology Readiness Levels (TRL) with description 39
Table 8 Selection of AL and TRL values for ATRA 41
Table 9 Attribute weights and values for paved urban road 47
Table 10 Attribute weights and values for Distant HD Aerial Imagery 49
Table 11 Attribute weights and values for a three story building 51
Table 12 Attribute Weights and Values for Infrared Thermography 52
Table 13 Attribute weights and values for a Wind Turbine 55
Table 14 Attribute Weights and Values for Ultrasonic Contact NDE 56
Table 15 Attribute weights and values for Suspension Bridge Superstructure 59
Table 16 Attribute Weights and Values for LiDAR 60
Table 17 Sensitivity analysis of Operational Scenario 1 63
Table 18 Sensitivity analysis of Operational Scenario 2 65
vi
NOMENCLATURE
UAS Unmanned Aircraft System UAV Unmanned Aerial Vehicle NAS National Airspace System SHM Structural Health Monitoring NDE Non-Destructive Evaluation FAA Federal Aviation Administration
NTIA National Telecommunications & Information Administration IRB Institutional Review Board
SE Systems Engineering
MDO Multidisciplinary Design Optimization MOO Multi-Objective Optimization
VDD Value-Driven Design DSM Design Structure Matrix DV Design Variables AL Autonomy Level
TRL Technology Readiness Level
ATRA Autonomy and Technology Readiness Assessment GNC Guidance Navigation Control
GPR Ground Penetrating Radar GPS Global Positioning System IMU Inertial Measurement Unit FPV First Person View
vii
ACKNOWLEDGMENTS
First and foremost, I would like to express my sincere gratitude to my major professor and advisor, Dr. Christina Bloebaum for her continuous support and guidance during the course of my concurrent BS / MS degree in Aerospace Engineering. Her valuable advice and insight of the opportunities in the field of Aerospace and Systems Engineering gave me the knowledge and strength to endure through this challenging program. I would also like to extend my gratitude to my Co-major professor Dr. Halil Ceylan for sharing his pearls of wisdom and unique point of view in this field and providing me with many valuable opportunities and experiences with projects from the FAA and the civil engineering department.
I would also like to thank my committee members, Dr. Thomas Ward III and Dr. Clark Wolf, for their guidance, encouragement and constructive criticism needed for the completion of my thesis. My sincere thanks also goes to my mentors and friends Dr. Hanumanthrao Kannan, Dr. Benjamin Kwasa, Dr. Sunghwan Kim, Dr. Gopalakrishnan Kasthurirangan, Robert, Chris, David, Subu, Suresh and Nazreen who closely mentored, encouraged and helped me immensely throughout the course of my research, easing the struggle and making my time at Iowa State University a wonderful experience.
I would like to thank my parents and sister who believed in my abilities and without whose unconditional love and support, this may not have been possible. Last but not least, I would like to acknowledge my best friend Tyler Carter who has had an immense amount of positive influence on me during my time at Iowa State University.
viii
ABSTRACT
In recent years, the use of UAS has moved much beyond the realm of military operations and has made its way into the hands of consumers and commercial industries. Although the applications of UAS in commercial industries are virtually endless, there are many issues regarding its operations that need to be considered before these valuable pieces of equipment may be allowed to run free in the skies. Currently, UAS operations in public domain is guided and controlled by the FAA Part 107 rules after overwhelming public pressure caused by the earlier 333 exemption [1]. In order to approach such larger issues, this thesis will exploit the use of value models, which will help to quantify how the different environmental and operational scenarios play a role in UAS operations based on the task being performed.
The primary aim of this research is to use the attributes of key factors of the UAS such as the Autonomy Levels (AL) and Technology Readiness Levels (TRL) along with its operating scenario factors such as the environmental complexity and task complexity, based on the operating environment in which the UAS performs its task. To analyze the performance of autonomous UAS in different operational scenarios, the physical characteristics and class of the UAS may be linked to its AL and TRL. Using these parameters, the risks faced by the UAS in a particular mission are quantified and a value is assigned to the abstract entities involved. Although there are many critical questions with respect to good practices to be followed by UAS operators in order to obtain valuable data and information on the structures being scanned and monitored, there are many other major challenges with regards to large scale operations of UAS such as the ethical, legal and societal implications that have to be addressed.
1
CHAPTER 1
INTRODUCTION
The introduction of UAS technology on a large scale may very well be the next major
technological breakthrough in the field of aviation for performing a wide variety of applications in a relatively safe and cost effective manner. This breakthrough is projected to create thousands of new jobs and billions of dollars of economic development [2]. The introduction of UAS into the National Airspace System (NAS) comes with a lot of advantages and some disadvantages which translates to gains and losses for different stakeholders involved. Unfortunately, the challenge faced by the government and multiple stakeholders who wish to use UAS technology on a large scale are the issues tied to safety, policy, law, ethics and privacy. This research study involves understanding the different factors that affect the deployment of UAS on a large scale by taking into account operational constraints and issues associated with it. Understanding these factors from the viewpoints of the users and operators may be used to aid in amending and developing policies for UAS operations, which is directly related to the ongoing controversy regarding the regulations of UAS.
With the recent increase in the number of UAS in the skies, measures have to be taken to properly regulate and safely carry out the transition into this new realm of aerial vehicles. This process will require the coordination and involvement of academia, industry, government agencies like the Federal Aviation Administration, Department of Defense, local authorities and private sectors alike in order to successfully implement a safe, efficient and robust system for commercial UAS operations [3]. The ultimate goal of such a high level partnership between these agencies would be to successfully integrate sUAS operations into the NAS in order to
2
enhance the use of UAS for commercial applications, while heavily weighing on the ethical, legal societal and environmental implications of these technologies. The current UAS boom for civil applications must be cautiously carried out without violating any rights or safety of individuals or the environment.
The primary goal of this research study is to create a value model for UAS by taking into account the technical, environmental and operational scenarios involved in order to possibly create a decision analysis simulation to analyze and rate different UAS based on its components, autonomy level and technology readiness level. This in turn may be used in the future to understand the dilemma between the preferences of the stakeholders and the regulations to model the inefficiencies induced in UAS operations due to policy requirements. The research will involve using a combination of various tools and frameworks such as Multidisciplinary Design Optimization (MDO), Value-Driven Design (VDD), and Decision Analysis (DA) to analyze and understand the various factors involved while designing and operating UAS on a large scale for the use of SHM and civil applications.
The methodology for this research will necessitate identifying different classes and types of UAS that can be used for commercial purposes and connecting the physical characteristics of these UAS to virtual characteristics such as AL and TRL in order to evaluate these system for the purpose of SHM, while staying compliant with the FAA Part 107 regulations. These evaluation methodologies of the software and hardware of UAS can in turn be used to rate their performance and guide operational activities based on the task being performed around the different operational scenarios. This way, the value model will be able to correlate the UAS to the operational environment that it performs tasks in. These characteristics can be represented in the form of attributes and design variables to create a value model that can capture and
3
incorporate the technical design aspects of the UAV to the societal and legal aspects of deploying UAS. In order to rate the performance capability of the UAS in its operational scenario and to abide by the legal and societal constraints, the autonomy level and technology readiness levels of the associated and relevant components play a key role in the value model.
The new Part 107 rules put forth by the FAA regarding the operations of sUAS will be used as the primary platform to setup the different scenarios to use either a single UAV or a swarm of UAVs to monitor different types of structures autonomously in order to provide a holistic view of the condition of the structure being surveyed. The use of UAS will open up new domains of unexplored potential in the field of SHM and provide an efficient solution to the current techniques being employed. In order to implement this system in an efficient manner, we will use the VDD approach of SE. This methodology will provide an interdisciplinary approach to the implementation of the system while being able to communicate the design and operational requirements with the preferences of the stakeholders including the UAS pilots, operators and the FAA. This will help in identify relationships between the subsystems of the overall system while including economic theories to better optimize the design and operation of the UAS swarm based on the mission scenario, while incorporating the preferences of the stakeholders [4].
The focus of the next chapter is to concisely describe the three research questions developed for this research project and the approach to addressing each of the questions, as well as the subtasks involved in each of these studies.
4
CHAPTER 2
RESEARCH QUESTIONS
This chapter explains the research questions and tasks that were formulated in order to initiate the search to form a value model that can be used to improve and optimize the operations of a UAS based on its operational scenario.
Research Question 1
“How do the different environmental and operational scenarios play a role in UAS operations with regards to the task being performed?”
This research question will be address with the task of first creating an ‘operational scenario complexity’ list of different types of infrastructure that will be scanned by the UAS in a typical mission, this list will be formed by rating the different infrastructures with a system of metrics backed by a list of attributes that contribute to the complexity of the operational scenario. Each of the attributes will have a weight based on the volume of impact that it has on the infrastructure being tested. The second task will be to create a ‘task complexity’ table which will rate the different methods of data acquisition that can be used by the UAS to scan the infrastructures. Similar to the ‘operational scenario complexity’, attributes will be used to create a system of weights for the different tasks in the list based on the primary factors affecting the process of collecting the different types of data remotely using a drone. These attributes will be supported by metrics in order to assign weights to the list of data acquisition methods to link back to the operational scenario, thus creating a connection between these parameters.
5
Research Question 2
“How are the physical characteristics and class of UAS linked to the AL and TRL to performance in different operational scenarios?”
This research question will be used to draw relationships between the hardware and software elements of the UAS. This will be done with the help of a value model that will separate out the primary parameters of the UAS, such as size, class, technology readiness level and autonomy level. The primary challenge of this research question will be to link the autonomy levels and technology readiness levels to the size and class of the UAS to enable a performance based evaluation of the UAS with regards to the operational scenario.
The software elements, namely AL and TRL will be linked together by the ATRA framework whose primary aim would be to create a link between the software components of the UAS. The ATRA can then be used to further connect to hardware elements to the different types of UAS such as fixed wing, hybrid or multirotor. The size class of the UAS will also be used in the model to study the feasibility between the size and class of the drone with respect to the AL and TRL required for the different mission scenarios and objectives to be performed by the UAS.
The task for this research question will be to investigate a meaningful sequence of relationships between the class, size, AL and TRL of a UAS with respect to its performance in the different operational scenarios discussed in the previous research questions. This will be done with the formulation of a value function that will be capable of evaluating the required levels of autonomy for different mission scenarios based on environment and task to be performed.
6
Research Question 3
“Can this value based model be used to perform risk analysis on autonomous UAS operations based on ethical, legal and societal issues?”
The value based models that have been developed in the previous two research questions can be stretched to further to investigate a bargain model over the system attributes to understand the risks that may occur during UAS operations in different mission scenarios. In order to understand the trade-offs, heuristic methods may be used to incorporate the existing FAA rules and regulations to perform the analysis between UAS ratings model and operational scenario models to extract an estimate risk value in a particular scenario. Once this has been achieved, checks and balances can be used to control, avoid and eliminate the risks and can be supported with thorough consideration of ethical, legal and societal issues.
A primary task of this research question will be to incorporate the existing Part 107 FAA rules in the form of constraints on the design variables of the UAS itself. This will help to not only base the design of the UAS within the legal constraints, but also formulate an optimization function for the UAS based on the minimization of mass. In order to expand this into a value model, the stakeholders and their true preferences may be listed out by studying multiple sources that provide the viewpoints of the different stakeholders; values may also be assigned to the key regulations put forth by the FAA and penalties may be imposed on operations that violate these regulations. This way, ethical, legal and societal issues may be used to determine the risks in autonomous UAS operations and quantify the penalties involved.
7
Organization of Thesis
Chapters 1 and 2 provided an overview of the current state of UAS operations in the commercial setting and a glimpse into the motivation behind the research along with a set of well defined research questions that may be used as a starting point to solve some of the potential issues with the sUAS commercial operations for SHM purposes. Chapter 3 will provide a detailed background on the subjects of unmanned aircraft systems, structural health monitoring, systems engineering, multidisciplinary design optimizations and value-driven design, which is necessary for proceeding through this thesis and understanding the core topics addressed in this research. Chapter 4 will focus on explaining and describing the breakdown of a fixed wing and multicopter UAS model which will be used as examples to link to the operational scenarios for SHM. Chapter 5 will provide an initiation to the linkages between the different tasks the UAS will be performing and the environmental scenario of the operations. This chapter will also help to quantify the links between the physical characteristics of a UAS such as its class and size to its AL and TRL in order for it to perform assigned tasks in the different operational scenarios. Chapter 6 will delve into the different types of traditional SHM techniques and quantifying their effectiveness against the proposed UAS-SHM method, supported by detailed studies and discussions of the pros and cons of the different techniques. Last but not the least, Chapter 7 will summarize the final conclusions of this research and lay the foundations for future work that could be extended from this research and the possible new areas that it may be expanded into.
8
CHAPTER 3
BACKGROUND
The operations of UAS in the civil environment is an extremely difficult issue to address due the large amount of ambiguity surrounding its position in the vast and complex activities occurring in the civil airspace. Value models will be used extensively in this thesis to highlight the advantages of connecting the different attributes of the physical components of a UAS to its levels of autonomy and operational conditions in order to create synergy between the operation, equipment and personnel involved and thus overcome the need to use traditional requirements based methods to set constraints on UAS operations. This value based systems approach to the operations of UAS in civil airspace will help facilitate a comprehensive view of the issues and better align the discussions within the appropriate scope of topics.
A fixed wing and multicopter UAS models will be used to address the couplings between the UAS hardware & software components to the infrastructure it will be performing SHM on and the tasks that the UAS will be performing. This model can be used to obtain system and operational correlations to further investigate the impact that UAS operations could have on the environment by performing multiple studies using simulations. The content in this chapter gives a detailed background of the key topics of this thesis such as the history and development of the fields of UAS and SHM. It also gives a detailed overview regarding the supporting frameworks required to understand the formulation of this research methodology such as traditional systems engineering, multidisciplinary design optimization and value-driven design.
9
Unmanned Aircraft Systems
Unmanned Aircraft Systems (UAS) also known as Unmanned Aerial Vehicles (UAV) or drones are basically aircrafts that don’t have a human pilot on-board. These aircrafts are usually controlled remotely by a human operator and can have varying levels of control autonomy between the human operator and the on-board flight computer and control systems based on their capabilities [5]. UAS provide greater mobility to further the potential for exploration by effectively providing three dimensions of motion control to the user. Although the origins of UAS applications can be traced back to military purposes, as of today, it has the potential to play a key game changing role in applications pertaining to many different industries such as security surveillance, search and rescue, photography, mass media, agriculture, package deliveries and recreational uses [6].
Recently, UAS have taken to the skies in large numbers and is poised to have a major impact on the US and global economy as a whole. There are many credible sources that provide evidence of multiple billions of dollars of economic development and activity generated by the induction of UAS in civil applications, this in turn will help to create thousands of new well paying jobs across the world [7]. According to a report by the Association for Unmanned Vehicle Systems (AUVSI) in 2013, the expansion of UAS in civil industries could create up to 103,776 jobs by 2025 and the tax revenue to the states could reach up to $462 million in the first 11 years after its integration into the NAS. Every year that UAS integration into civilian airspace is delayed, the US loses more than $10 billion in positive economic impact, this amounts to losses of about $27.6 million per day [8].
10
The first large scale commercial use of UAS started in Japan for agricultural applications in the 1990s. The primary UAS used for this purpose was the Yamaha R-Max, which was commissioned as an industrial-use unmanned helicopter in 1987, these efforts took place due to a request from the Ministry of Agriculture, Forestry and Fishery of Japan for the development of a UAV for crop-dusting purpose [9]. The Yamaha R-Max is a highly capable first generation UAV, which is equipped with a 2-cylinder, water cooled gasoline engine that is capable of lifting a payload of approximately 35 lbs for 60 minutes without refuelling. The electronic systems include a 500 Mb embedded flash drive for data storage, IMU, 3-axis Magnetometer, SONAR altimeter and RADAR altimeter for altitude control and stabilization [10]. The Yamaha R-Max is capable of spraying up to 2 acres of land in 6 minutes and has sprayed almost 310,000 hectares of Japanese farmland since 1995.
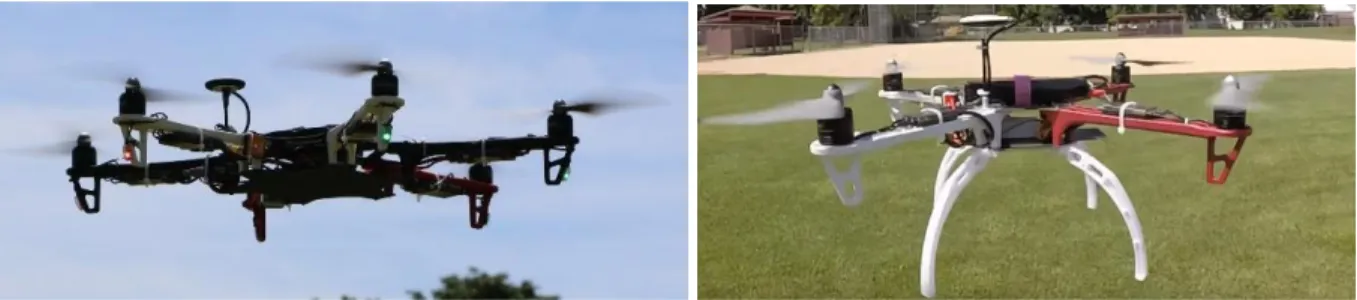
Figure 1. Hexacopter and Quadcopter UAS in flight
Today, the trend of UAS design has changed from a helicopter style system to multirotor hexacopter and quadcopter designs as seen in Fig. 1. These new designs of UAS provide it with more dynamic stability and lift capability for relatively smaller size of the rotor blades. Currently, the largest drone manufacturer is DJI with a net valuation of $10 billion, followed by Parrot and the Berkeley based 3D Robotics which had net sales worth $50 million in 2015 [11].
11
Structural Health Monitoring
Testing civil infrastructure manually is an expensive and relatively dangerous task. Many times a lift or a crane is used to allow manual access to inspect the ‘hard to reach’ locations where damage may have occurred [12]. Structural Health Monitoring (SHM) is an important tool to help improve the safety and maintainability of vital civil and transportation infrastructures. Due to the deterioration of civil infrastructure caused by time and other factors, the importance of SHM cannot be underemphasized. The primary aims of SHM is to provide the diagnostics or state of an infrastructure during every moment of its life of all the different parts and of the full assembly of all the parts constituting the structure. SHM is more than just an improved way of performing Non-Destructive Evaluation of a structure, it is a complex and multidisciplinary process comprising of visual monitoring, integration of sensors, smart materials, data transmission, computation and even predictive modelling of the entire structure itself [13].
As of today, SHM is performed manually by engineers, technicians and inspectors spending vast amounts of field time mapping and inspecting the structure for defects with the help of tripod or vehicle mounted equipment which have limited reach. Advances in bridge SHM have been enhanced with the help of stationary sensors that are strategically placed under or on the surface of the structure, capable of monitoring stresses and vibrational loads. Unfortunately, infrastructures that are old or located in remote areas cannot be monitored using such embedded sensor techniques [14]. Current inspection practices involve visual inspections, acoustic emission, ultrasonic testing .etc. These techniques revolve around previous knowledge of where the damage is in order to perform a detailed study of the holistic condition of the structure.
12
Systems Engineering
Systems Engineering is a field of engineering that is concerned with identifying relationships between the elements or subsystems of an overall system. It is an interdisciplinary approach and means to enable the realization of successful systems. Focusing on the relationships between the elements or subsystems, decision theory, statistics and optimization are used as the underlying frameworks in designing a successful system [15]. Using the basic framework, systems engineering focuses on the stakeholder’s preference and handles issues that can arise during the development cycle. The procedure involves documenting requirements, synthesizing designs and validating the system while considering the complete problem and needs of the stakeholder. These processes have been used and practiced for over half a century, allowing designers to track the requirements given by the stakeholders [16]. However, failures still occur, although sometimes, in the long run they may be unavoidable.
It is the role of systems engineering to learn from these failures and find ways to improve the design of a system. Developing, understanding and control of the system interface, development of test and verification plans, and proper allocation of requirements are crucial to good systems engineering [17]. In a detailed design phase, the role of systems engineering is to guide, coordinate, and facilitate component design engineering activities. Using good practices and learning from our failures, we may develop methods to solve the issues that may occur during a system's life cycle. Systems engineering brings back the sense of art and excitement into engineering, as we examine the human interactions with the physical aspects of engineering [15]. Capturing the interactions of human decisions through the development of engineered systems may cause arise in complication as the size of the design team increases. Systems engineering
13
takes into account logical human organization and manages the complexity incorporated into the design process [15].
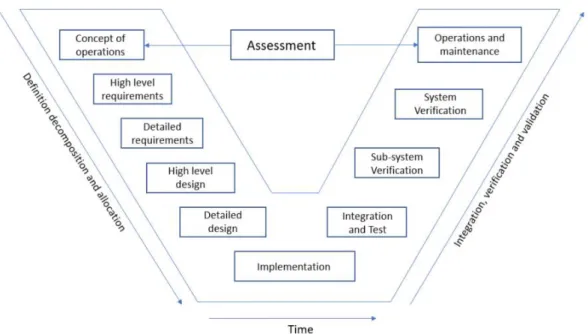
Presently, Systems Engineering is heavily requirements based. The current approach to using systems engineering method involves communicating the requirements down the organizational hierarchical order of the corporation [18]. The requirements for the system are set by the stakeholders in the highest level of decision making in an organization. The requirements are formed based on physical interferences, environmental limitations, legacy, knowledge. etc. The failure to form requirements properly is the main reason that systems fail [19]. The requirements made by the stakeholders are based on the needs of the customer, but these requirements fail to highlight the true preferences of the stakeholder. The primary requirements are then passed down the levels of the organizational hierarchy to the teams of their respective subsystem. In each level of the hierarchy, the subsystem teams form their own set of requirements and continue to pass them down to smaller subsystem teams. The design is considered to be achieved once all the requirements are satisfied at a component level. These requirements based systems engineering methods does not capture the stakeholders’ true preferences and are susceptible to time and cost overflows [4]. Another traditional method of systems engineering is using the standard systems engineering V process and the waterfall processes shown in Fig. 2. The V process involves flowing down the V from the left and allocating requirements to every component until the lowest level, and then climbing up the right-hand V and implementing these requirements at each component level. The problem with this method is the lack of an objective function which limits its practical application in a detailed design process [20].
14
Figure 2. Systems Engineering V-Model
The waterfall method is a sequential development model and the requirements for one phase are set before moving to the next phase. It is a linear process and is easy to implement. Each step is frozen before the moving on to the next step. This allows the requirements to be clear before the development begins. The problem with this method is that issues with one phase of the design may be carried over to the next phase; since the requirements cannot be changed once the process has started, it may lead to a badly structured system [21]. The traditional systems engineering and optimization processes have limitations in determining the best system design while being unable to capture the preferences of the stakeholders and customers.
15
Multidisciplinary Design Optimization
The term Multidisciplinary Design Optimization (MDO) was created in 1947 by Arthur Roderick Collar “as the study of the mutual interactions that take place within the triangle of the initial, elastic, and aerodynamic forces acting on structural members” [22]. During the 1980s, MDO arose from structural optimization [4]. The huge jump in computation since the 1980’s enabled the inclusion of aerospace engineering companies, agencies, and academic researchers into optimization. As engineered systems become more detailed in complexity, new methods need to be implemented to help designers get an optimum system design. MDO focuses on the numerical optimization for design on systems which involve a number of disciplines or subsystems [18]. The main function for MDO is to optimize a system that has multiple subsystems that interact with each other. To achieve the optimum system, each subsystem has to be captured to understand how it affects the overall performance of the design. A well-known example where MDO is used is with the interaction of aerodynamics and structures. There was a strong interaction with these two subsystems; therefore, aeroelasticity was created to analyze these interactions [22]. As systems grow in size and complexity, it is important to incorporate the use of MDO into the design process as we capture the interactions that occur between the many subsystems. Using the MDO problem early in the design process and taking advantage of the advanced computational analysis tools, designers can improve a design while reducing the time and cost of the design cycle [15]. However, as designs become more dependent on the stakeholder, designers need to take preferences into account while working in the design cycle.
16
Value Driven Design
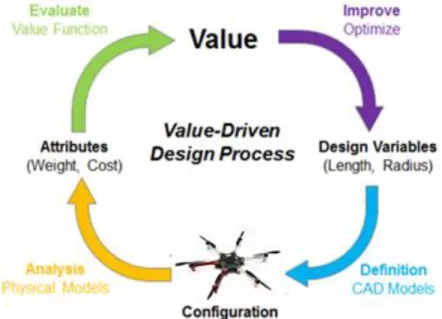
Value Driven Design (VDD) is a movement that uses economic theory to transform systems engineering and better use optimization to improve the designs of large systems, particularly in aerospace and defense [23]. Value Driven Design captures the preferences of the stakeholders by adding new elements into the design process. The process of Value Driven Design used in the design of large scale complex engineered systems is represented in Fig. 3. Instead of having requirements flow down to the subsystems, the preferences of the stakeholder are prioritized. This expands the design base, as requirements that are generally passed down in traditional SE methods may limit the overall design. By not limiting the design to requirements, all areas of the design can be explored to find the optimum design for the stakeholder.
Figure 3. Value-Driven Design Process
VDD is involved with defining a process that provides a value to a detailed design when components are designed in relative isolation [24]. This is done through the creation of a value function, similar to an objective function; however, there are significantly lower constraints on
17
the design. This value given to the design has no meaning to anyone else except the stakeholder, as it monitors and expresses the stakeholder’s preference. Typically, this value is monetary depending on if the stakeholder wants to maximize profit or minimize cost. The designer can create a value function that is not monetary; it is up to the stakeholder and designer to understand their system and discover ways to begin the design process. Value-Driven Design is an approach to systems engineering originally intended for use during the detailed design phase of systems development. VDD focuses on providing an objective function to each component to guide design work [25]. Value Driven Design is a framework that can be applied to MDO and aims to reduce the number of requirements applied to attributes of components of the system. It also attempts to reduce the number of constraints applied to optimization techniques and captures the true preference of the stakeholders.
Furthermore, VDD enables design optimization of the entire system as well as each component. It does so by using a value function to search for the best design and a higher number from the value function indicates a better design. It also helps to prevent design trade conflicts thereby preventing dead-loss trade combinations. When teams work at cross purposes in an organization to meet each requirement for their subsystems, it may lead to a net increase in cost and also decrease the performance and reliability of the system. VDD helps to prevent this ‘dead loss’ by creating a value function that encompasses all the attributes and trade factors which are consistent among components at all levels. Finally, it prevents cost growth and performance erosion by eliminating requirements at component levels and improving system attributes, thereby eliminating the source of cost growth and associated delay [26].
18
CHAPTER 4
UNMANNED AIRCRAFT SYSTEM MODEL
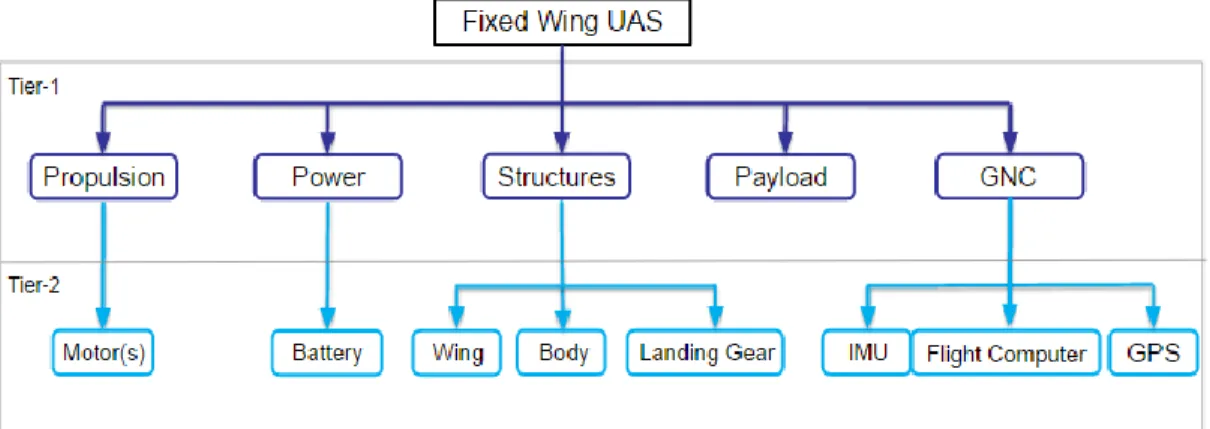
The following UAS model will lay the groundwork required to demonstrate the use of traditional SE approach along with the formulation of a multi-objective optimization function. A basic two tiered breakdown of a fixed wing and multicopter UAS model has been developed as a part of this research in order to serve as a test bed for the execution of different operational scenarios required to perform different tasks critical to SHM. The hierarchical model shown in Fig. 4 describes a two-tiered decomposition of a fixed wing UAV subsystems. This will be used to further explore the attributes and design variables along with their impact on operations. For a fixed wing UAV, each of these subsystems are further broken down into subsystems in lower tiers and are defined by 24 design variables shown in Table. 1. This model created will help to further our knowledge on the understanding of a UAV system and will be valuable in connecting key attributes to performance parameters in the different operational scenarios being tested.
Figure 4. Hierarchical decomposition of a fixed-wing UAV system
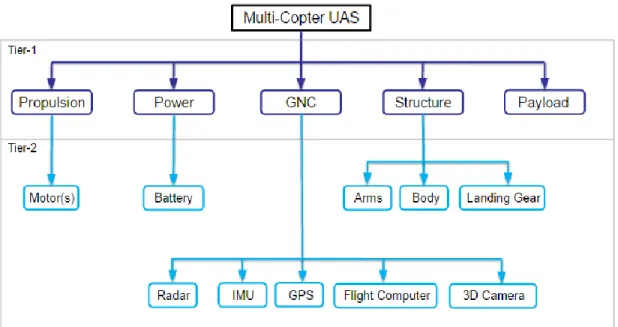
Similarly, a hierarchical decomposition for a multicopter UAV along with its subsystems in two tiers are shown in Fig. 5, we see that the simplified model of a multicopter UAV has five
19
primary subsystems in its first tier: Propulsion, Power, GNC, Structures and Payload. The subsystem components of a UAS that has been broken down hierarchically can be used to further to explore a second level of components that create the makeup of the multirotor UAV. These levels can then be used to understand the connection between each of the disciplines of the UAV. The second tier of subsystems comprise of motors, battery, IMU, GPS, flight computer, 3D FPV camera, SONAR, arms, body and landing gear [27]. Since this is a relatively large model, each of the primary disciplines and their subsystems namely GNC, structures, power, propulsion and payload will interact with each. In order to capture the couplings of these interactions, a DSM will be used as shown in Fig. 6.
20
Figure 6. Design Structure Matrix of a multirotor UAS
The DSM shown above has the capability to visualize the connections between the subsystems as couplings, feed forwards, and feedbacks [28]. This makes it easier for the user to model and analyze the system and shows how the dependencies among the subsystems can be used to further improve the system as a whole. Using this DSM and the hierarchical breakdown models, we can list out the performance attributes that are affected by the first tier subsystems as shown in Fig. 7. As seen from the figure below, propulsion affects the altitude, endurance and payload weight that can be carried by the UAS; power from the battery affects endurance and range; GNC affects range, stability and autonomy level; while the structure affects payload volume, payload weight, proximity and maneuverability. The payload attached to the UAS can be removed based on its mission profile and task, thereby affecting the capability and tasks that can be performed by the UAS. The payload attributes can be changed based on the types of sensing equipment that will be attached to the UAS.
21
Figures 7. Multicopter UAS breakdown and connection to performance attributes
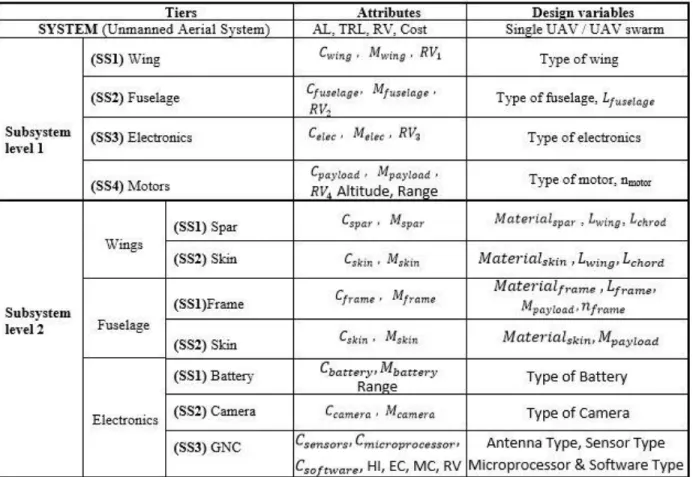
The fixed wing UAV being studied in this case will have the primary mission of surveying and performing SHM on infrastructure, while abiding by the FAA Part 107 regulations. The hierarchical model breakdown of a fixed wing UAV to assign attributes and design variables to each of the subsystem parts will be focused on setting guidelines and aiding the UAV designer to stick to the legal limits set by the government, while also catering to needs and preferences of the UAS operators from different industries as discussed earlier. The first tier of subsystems comprise of propulsion, power, structures, GNC and payload. This first tier is further broken down into a second tier of components such as motor, wing, body, landing gear, IMU, flight computer and GPS. Each of the individual subsystem levels of the fixed wing UAV and their associated design variables that could be used for analysis in a value model are described in Table 1 below.
22
Table 1. List of attributes and design variables of a fixed-wing UAS
In order to set up the optimization process, we needed to develop an objective function that captures the goals of the stakeholders and abide by the legal constraints set by the FAA. Equation. 1 is the formulation for the minimization of mass approach. These constraints need to have a sense of meaning due to its interaction with other objects, laws of physics, and mission success criteria. The mass is assumed to be a summation of all of the subsystems that have a mass which could affect the system.
23
Equation 1. Formulation of minimization of mass approach
The side constraints that are introduced in this example are: length of the wing, chord, fuselage, and mass of the payload. These side constraints are developed to fit within physical bounds, such as to keep the mass of the UAS from dropping below zero or making it too heavy for takeoff. The inequality constraints on the other hand are based directly on the FAA Part 107 rules for UAS operations, such as maintaining a total mass of the UAV to be less than 55 lbs, maximum speed less than 100 mph, maximum flight altitude of 400 ft above ground level and flight missions must be carried out within visual line-of-sight [29]. These constraints used in the traditional MDO formulation represent the desires of the stakeholder, which in this case is the government, and highlights the regions in the design space that are deemed infeasible to use while designing the fixed wing UAS.
We can assume the stakeholders in this setup to be the government (FAA), UAV designer and the UAV operator. Based on the preferences, each stakeholder will have a different value, so the value given only makes sense to the stakeholder. The true preferences of the stakeholders interested in taking advantage of UAS can be obtained by analyzing the viewpoints of
24
stakeholders obtained from multiple sources and summarized in Table. 2. This table is a representation of the true preferences of UAS operators from different industries, the data presented in the table is extracted from the NTIA convened multi-stakeholder discussions due to a Presidential Memorandum issued by former President Obama for "Promoting Economic Competitiveness While Safeguarding Privacy, Civil Rights, and Civil Liberties in Domestic Use of Unmanned Aircraft Systems." [30]. This meeting comprised of members and entities from academia, industry, government sectors and civil society, thereby giving a holistic view of their combined opinions for the development of regulation with regards to UAS.
Table 2. Preferences of UAS operators from various industries
Farmers & Ag associations Energy & Construction University Researchers
Media Houses & Journalists Operation Precision Agriculture Inspection & Maintenance Research & Education Photojournalism Task Photos - RGB, IR, NDVI Spraying
Power line inspect Gas leaks detection Thermography
Tool for R&D in multiple fields
Photo and video footage for news
Environment Rural Farmland Urban & Rural areas Confined zones Busy urban areas
Issues Ownership of
scan data. Intrusion over private land.
Current rules are too constraining
Privacy laws need to be loosened Treat institutes different from commercial entities No reqs to disclose details. Time for training & registration
Requirements Training
programs needed UAS must have ID for tracking. Special operations exemptions for inspection & maintenance Use IRB regulations for schools not FAA
No additional privacy regulations for drone use
25
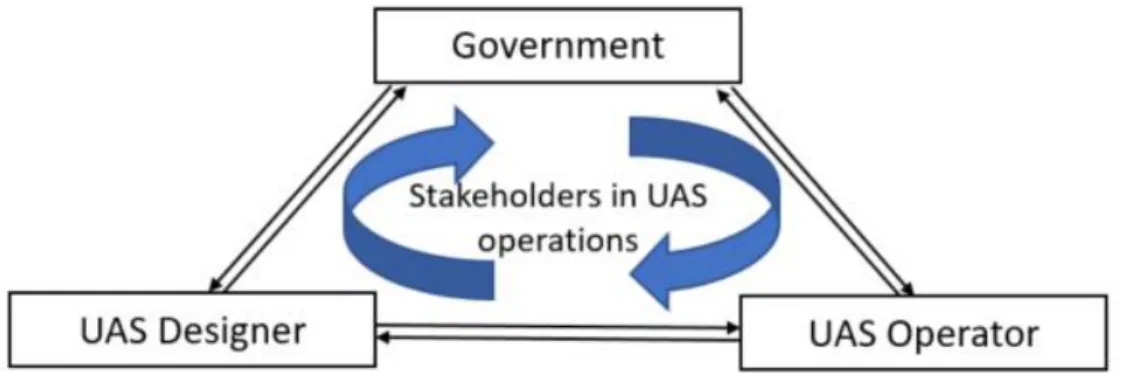
Figure 8. Primary stakeholders in UAS operations
In Table. 2, we used the examples of agricultural associations representing farmers, energy & construction companies, university researchers representing academia and media houses representing the journalist's point of view. These potential UAS operators have different operations and tasks based on their mission scenario, whether it be scanning a field, spraying pesticides or fertilizers on farmland, inspecting tanks for gas leaks or for capturing footage of an event to show on television. Due to the nature of the different operations, the requirements, needs and issues faced by each of the operators also vary from case-to-case based on the operational environment and tasks to be performed. Since the final say in the regulations depends on the government, UAS designers play a critical role in the cycle of designing the UAS with sufficient AL and TRL to oversee and possibly restrict these operators from violating the rules and regulations put forth by the FAA. This dilemma between the primary stakeholders in this case, namely, the government, operator and designer is shown in Fig. 8. The model for understanding the required AL and TRL for a UAS based on tasks and operational environments will be discussed in the following chapter using the example of SHM.
26
CHAPTER 5
VALUE MODEL AND ANALYSIS
The primary aim of this chapter will be to provide a detailed overview of the relations that were drawn between different tasks that the UAS will be performing with respect to the environmental scenario of the operations as well as the physical characteristics of a UAS such as its class and size to its AL and TRL. This chapter will also explain the approaches to quantifying the relationships between the UAS characteristics and operational scenarios, this way showing how all the parts of the puzzle fit together and explaining their effects on one another. This chapter could serve as a launchpad for the creation of risk and bargain models.
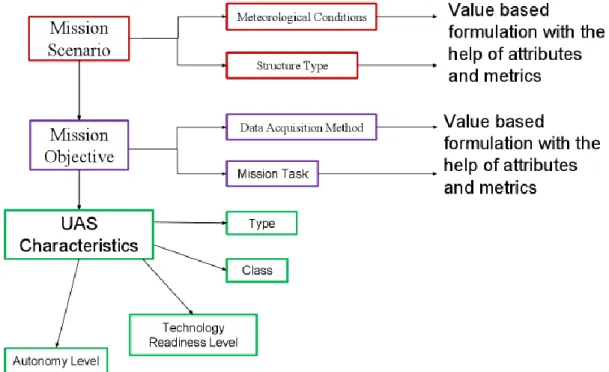
Figure 9. Parameters for operational scenario and UAS rating
The primary parameters involved in the operations involving a UAS are: The mission scenario, mission objective and the UAS characteristics, as shown in Fig. 9 above. The mission
27
scenario is defined by the meteorological conditions and the structure type; the mission objective is defined by the data acquisition method used and mission tasks and the UAS characteristics are divided by its size, class, AL and TRL. The structure type and the data acquisition method will have a set of attributes and metrics that will help to determine its complexity. This methodology can be used as a universal model for analyzing the operational scenarios for UAS in other applications such as precision agriculture or photojournalism, but in this research project, we will use the example of SHM to understand the effects of the operational scenario on the UAS. This example will be used to demonstrate the amount of complexities involved in the process of UAS based SHM and how optimal performance may be achieved.
The Fig. 10 below shows an elaborated model for performing decision analysis on UAS operations. We see that this model is divided into two main parts: Operational scenario and UAS evaluation. The operational scenario is further divided into environmental complexity and task complexity, while the UAS evaluation is divided into AL and TRL. The operational scenario and UAS evaluation can be used in the future to perform risk modelling and analysis on operations based on the UAS autonomy. This can also be used to create a bargain model for the comparison of UAS based SHM with other forms of traditional SHM based on quality v/s dollar comparison. The next two subtopics of this chapter will elaborately explain the creation of the value models for the operational scenario and the UAS evaluation separately along with the types of metrics and ratings that were used to evaluate the parameters involved.
28
29
Value Model for Operational Scenario
This topic will focus on explaining the operational scenario aspect of the decision analysis model explained earlier. The two main parameters that are used to evaluate the operational scenario in our model are: Environment Complexity and Task Complexity. The environment complexity is further subdivided based on the meteorological conditions and the infrastructure type around which the UAS will be operating. The task complexity is subdivided into data acquisition type and vehicle type. This model with the subdivisions of each of the categories of operational scenario is illustrated in Fig. 11 shown below. A combined analysis of each of these parameters will be used to understand the effects of operational scenario on the UAS while performing its tasks. In order to quantify each of these parameters, common types of scenarios were studied based on their tasks and environment, then metrics were created for the two main subdivisions of these parameters that define operational scenario: Infrastructure Type and Data Acquisition Type. These metrics are supported by weighted attributes and these weights are assigned based on the value of its relevance to the attributes.
30
The infrastructure type is divided based on the structure that will be surveyed by the UAS while performing SHM, for example, buildings, roads, bridges .etc. The meteorological conditions will be based on factors surrounding the infrastructure type where the UAS will be performing and will be evaluated based on temperature, precipitation, wind speeds and humidity. In our model, we will integrate the weather conditions as one of the attributes contributing to the infrastructure type’s complexity. As for task complexity, vehicle type describes the types of UAS that will be used to perform the operations, such as, fixed wing, multicopter, hybrid VTOL, Lighter Than Air (LTA) or a helicopter. The data acquisition types are broadly divided into four different categories: Imagery, 3D modelling, non-contact NDE and contact NDE. These data acquisition types vary in levels of difficulty and are selected based on tasks that a UAS may be capable of performing in order to collect information regarding the health of a structure.
Although there are four major subdivisions for the two parameters pertaining to the operational scenario, in this model, we will only be quantifying the subdivisions that directly affect the UAS operating environment and not the type or class of UAS itself. This analysis will focus on quantifying the infrastructure types and data acquisition methods to compare it to the AL and TRL of the UAS. The reason for using select subdivisions in our analysis is to directly co-relate the environment factors to the autonomy and reliability of the UAS. The UAS type differs from its class; UAS type describes its physical build, while UAS class depends on its size. In this analysis, we will not consider the class or type of UAS for performing applications, instead, focus will be placed on assisting a UAS operator in decision making while using a UAS with a particular AL and TRL in a particular environment or scenario. The next section will explain the creation of the metrics and attributes for the main parameters.
31
The first parameter we will explore in detail with regards to operational scenario is the environmental complexity, this table was put together with a list of different infrastructure types that can be scanned by the UAS. This table of infrastructure type will have a set of metrics ranging from 1 to 10 for a broad range of infrastructures varying in complexities. The value of the metrics increases as the complexity of the infrastructure type increases from open unpaved rural roads to suspension bridge superstructures. These metrics will be supported by attributes that contribute to the complexity of the infrastructure as seen in the table below, such as size of the structure, physical obstacles around the structure, weather when the UAS operations will be conducted, geography of the surrounding location and factors that may cause signal interference to the link between the UAS and the pilot or ground station. These attribute weights will further be rated from 1 to 10 based on the comparative impact it has on each of the attributes. The list of the different infrastructure types with its metrics and attributes are compiled in Table. 3 below.
32
Once we have these metrics and attributes for these infrastructure types setup, we can use it to create a function that can provide us with a value by combining these metrics, attributes and weights. In this model, we assigned equal weight of 0.2 to all the five attributes for the types of infrastructure, although the weights assigned to each of the attributes can be changed based on its importance compared to other attributes. It must be noted that the total sum of the weights of all the attributes must add up to be 1. Each of these attributes also has its own set of metrics ranging from 1 to 10, and this will be based on the impact of that particular attribute on the infrastructure type. For example, the metric value for the ‘size of structure’ attribute for a wind turbine depends on the comparative size of the wind turbine being inspected with regard to other wind turbines.
Equation 2. Formulation of environmental complexity function
Once the infrastructure being scanned is identified and all the metrics and weights have been assigned to the attributes, a mathematical function is formulated as seen in Eq. 2, which quantifies the environmental complexity. This was done by multiplying the infrastructure type metric (ME) with the summation of the product between the assigned attribute weights (wi) and
the attribute metric (Ai). This formula quantifies the environmental complexity value from a
33
The next parameter we will explore in detail with regards to the operational scenario is the data acquisition method, this table was put together with a list of different types of data that may be performed by the UAS as a part of its SHM tasks. This table of data acquisition methods will have a set of metrics ranging from 1 to 10 for SHM tasks that the UAS performs based on its complexity. The value of the metrics increases as the difficulty the task increases from something as simple as distant low resolution imagery to a very complex task like ultrasonic contact NDE. These tasks are subdivided based on the type of data it obtains such as: Imagery, 3D modelling, non-contact NDE and contact NDE. Each of these different classes of data acquisition methods has its own set of attributes based on the way data is collected and due to the different nature of the classes of tasks. The list of the different data acquisition methods with its metrics and sub-divisions are shown in Table. 4 below.
34
Similar to the environmental complexity, the data acquisition methods are supported by attributes that contribute to the complexity of the data acquisition methods seen in Table. 5 below. There are four different sets of attributes for each data acquisition class. The attributes for imagery include equipment weight, image composition, proximity of the UAS to the object and stability required for acquiring good quality data, while attributes for 3D modelling include equipment weight, precision of the data collected, point density of the 3D renders and acquisition time needed to collect substantial amount of dense points of the structure being scanned. For non-contact NDE, the attributes include the weight of the NDE equipment such as the thermal camera or ground penetrating radar (GPR), accuracy of the data collected, minimum proximity required for data collection and the time needed for collecting the data, while for contact NDE, the attributes are equipment weight, precision of the transducers, penetration depth under the surface being scanned and the surface area that can be scanned in one flight.
Table 5. List of attributes with weights for data acquisition methods
Once the metrics and attributes weights for the different data acquisition methods have been set up, we can use it to create a function that can provide us with a value by combining these metrics, attributes and weights. In this model, we have assigned different weights to all the attributes for the data acquisition methods based on its importance compared to other attributes. The total sum of the weights of all the attributes of each data acquisition class must add up to 1. These attribute weights of all the four classes is further rated by metrics ranging from 1 to 10
35
based on the comparative impact of that particular attribute on the data acquisition method. For example, the metric value of ‘equipment weight’ attribute for collecting imagery data depends on the weight of the camera mounted on the UAS compared with the weight of other cameras.
Equation 3. Formulation of task complexity function
Once the task to be performed on the infrastructure has been identified and all the metrics and weights assigned to the attributes are finalized, a mathematical function is formulated as seen in Eq. 3, which quantifies the task complexity based on the data acquisition methods. This is done in a similar way the formula for environmental complexity was derived, which is by multiplying the data acquisition type metric (MT) with the summation of the product between the
assigned attribute weights (wi) and the attribute metric (Ai) of the task type. If more than one
task will be performed in a single mission, the same formula can be applied for the other tasks and the greatest task complexity value amongst the multiple tasks may be used as the final task complexity value to conduct any further analysis. This way, the formula developed in Eq. 3 quantifies the task complexity value from a minimum of 1 to a maximum value of 100, thereby allowing task complexity to be scaled to the environmental complexity.
36
Value Model for UAS Rating and Evaluation
Autonomous mobile robotic technology has rapidly evolved over the last decade and has began to impact multiple sectors across various industries [31]. In order to characterise, compare and evaluate the advancements in autonomy of a vehicle, common taxonomies and terminologies will need to be put in place. As of now, multiple government agencies such as the Department of Defense Joint Program Office (JPO), the U.S. Army Maneuver Support Center, and the National Institute of Standards and Technology (NIST) have separate but related on-going efforts to describe levels of robotic behaviors [32]. Although most of these are military related projects for combat systems, similar autonomous behavioural models can be modified for commercial operations. Although there are multiple references and metrics that have been created for UAS autonomy evaluation, here, we will create a version of the ATRA that can be retrofitted into the larger model for decision analysis of UAS operations explained earlier.
37
The two parameters that are used to evaluate the autonomy and robustness of a system being implemented are: Autonomy Level (AL) and Technology Readiness Level (TRL). These parameters are unified to form the Autonomy and Technology Readiness Assessment (ATRA), which can be used to provide a holistic view of the software component of UAS [33,34]. The formation of the network between the AL and TRL to form the ATRA is shown in Fig. 12 above. The use of this framework to evaluate autonomous UAS can be used to make both qualitative and quantitative comparisons that may be accomplished with the help of a formulated value function. The reason for the creation of such a framework is to enable the UAS community with a common set of evaluation that can be systematically used to compare the autonomy of one UAV to another, no matter the physical components that were used to make it.
The ATRA framework can be used to measure the maturity and robustness of not just UAS, but can also be used for any other vehicle that uses autonomous technology, such as Unmanned Underwater Vehicles (UUV), Unmanned Ground Vehicles (UGV) or even self-driving cars if this framework can be modified appropriately to be utilized universally [35]. In this thesis, we will just use this frameworks to investigate how they can be used in SHM applications to determine the optimal level of autonomy for different tasks to be performed. Here, we will use the definitions of AL, TRL and the ATRA, defined by NiST as Autonomy Levels for Unmanned Systems (ALFUS) [36,37] with necessary modifications from other sources to fit our SHM applications agenda. In this chapter, will use the example of a UAV that was assembled with off the shelf components and control system and evaluate it based on the ATRA framework developed to demonstrate its usage and effectiveness in the evaluation of autonomous UAS, while also keeping track of its operational environment.
38
The first parameter we will explore in detail is the Autonomy Level (AL), this is a set of metrics that is used to systematically evaluate and measure the autonomous capabilities and limitations of a UAS [38]. This metric ranges from 1 to 10, representing the accession of autonomous behaviour from remote controlled UAS with rudimentary first order flight control up to fully autonomous capabilities with no human pilot decision making involved at all. The AL of a UAS is mainly based on its GNC functions, which is the primary attribute to enabling autonomy in the hardware component of the UAS. As the GNC capabilities of the UAS is directly proportional to the autonomous capabilities of the UAS, as the GNC functionalities increases, the Al of the UAS will also increase alongside. The list if the different levels of autonomy for our example is compiled in Table. 6 below.
39
The next parameter we will explore is the Technology Readiness Level (TRL), which is a set of metrics that is used by many companies and government agencies to systematically evaluate and assess the reliability and maturity of the technology being used, which in this case is the autonomous UAS [32]. This metric ranges from 1 to 10 and is related to the advancement of systems development, integration, validation and deployment, ranging from the formulation of basic principles of the system up to its deployment and fully operational status. The TRL of a UAS is mainly based on its systems integration, test environment, mission scenario and performance, which goes hand in hand with the reliability of the combination of autonomy and hardware that can be implemented in the UAS [32]. The levels of TRLs that we will be using for our example here is shown in Table. 7 below.
40
Example of ATRA formulation for a Hexacopter
We will use the example of a DIY hexacopter UAV created by assembling off the shelf components to demonstrate the use of the AL and TRL evaluations in order to create an ATRA graph. In order to evaluate the AL of this UAV, we will need to evaluate its GNC capabilities of its flight controller component. The flight controller used in this UAV is the 3DR Pixhawk mini [39], which is a commercially available flight controller for UAS designed and manufactured by Berkeley based drone company 3D Robotics [40]. This flight control system comes with an inbuilt auto flight stability system, which is assisted by a gyroscope and altimeter to adapt to dynamic changes in its environment such as varying wind speeds to keep it stable during flight.
This flight controller allows for the addition of a modular GPS and compass unit to the main flight controller CPU to allow it to provide accurate positioning via its ground station software - px4 autopilot pro [41]. This mission planner uses GPS assisted waypoint navigation that allows a user to pre-program a path and allow the UAS to execute it autonomously. On referring to the AL table and based on the GNC capabilities of the Pixhawk mini flight controller, we see that it is fully capable of performing tasks up to AL 5, which is ‘Path planning and execution’. As we more up the AL scale to level 6 and so, capabilities such as real time path planning and dynamic mission planning can only been tested and experimented on by modifying the flight control system or ground station software and by the addition of more hardware such as obstacle avoidance sensors to the flight control system that will be capable of enabling these autonomous capabilities into the UAS. Since these capabilities have not been implemented, the AL for ‘safe operations’ will be set at 5 as shown in Table. 8 below.
41
Table 8. Selection of AL and TRL values for ATRA
In order to back our earlier statement of ‘safe operations’ based on AL, we will take advantage of the TRL scale. Since TRL does not only depend on the critical autonomy enabling GNC components, but also on the systems integration and operational reliability of the whole UAS itself, we will have to consider the other hardware components used in the assembly of the UAV when we evaluate the TRL. In this scenario, we see that for AL 5, this UAS has been flown on a regular basis to capture images and videos using its integrated gimbal and camera system using a pre-planned path. This puts its TRL at 8, which according to the metric is ‘Prototype operation in realistic mission scenario’, since path planning operations were used to execute its mission of capturing images and videos and has been carried out only using this one prototype. If a full UAS mission deployment must be considered, the UAV must be mass produced and its missions must be carried out on a regular basis with a track record exhibiting proof of operational success in performing its tasks. Based on this, the hexacopter used in this example receives a TRL of 8 for AL of 5 as highlighted in Table. 8 above.