9 December 2013
Barclays Capital Inc. and/or one of its affiliates does and seeks to do business with companies covered in its research reports. As a result, investors should be aware that the firm may have a conflict of interest that could affect the objectivity of this report.
Investors should consider this report as only a single factor in making their investment decision. This research report has been prepared in whole or in part by equity research analysts based outside the US who are not registered/qualified as research analysts with FINRA.
Global 2014 E&P Spending Outlook
North American Spending to Accelerate
E&P Spending to Top $700 Billion Globally: Global E&P spending is poised to reach a new record of $723 billion in 2014, up 6.1% from $682bn in 2013. 2014 should mark an acceleration of growth in North America to over 7% (led by the U.S.) coupled with continued solid growth (+6%) in international markets, particularly in the Middle East, Latin America, and Russia. We estimate capital budgets in the U.S. and Canada will rise 8.5% and 3%, respectively, up from 4% and -2% in 2014. Companies are basing 2013 spending plans on oil prices of $98 Brent and $89 WTI and U.S. natural gas prices of $3.66. These projections suggest our early look at 2013 spending levels likely underestimates total spending given current commodity price levels.
Majors Under-Spending NOCs: A wave of shareholder activism has proved successful in pushing for change among mid-size IOCs and raised questions about the potential for greater focus on returns and cash flow growth among the Majors. Slowing CAPEX growth from the Majors presents dangers to global oil markets, in our view.
Emphasis Shifting Towards the Well: While our initial expectation for 2014 suggests a modest deceleration in global spending growth, we believe the mix of spending is poised to shift away from large infrastructure projects towards greater drilling, evaluation and completion activity, implying a stronger underlying revenue opportunity for the group and the diversified oil service companies in particular.
North America Poised for a Reacceleration: Spending is set to expand in North America following two years of tepid growth. We expect NAM spending to rise over 7% in 2014, following growth of 2% and in 2013 and 4% in 2012. Increased spending associated with the rise in service-intensive, multi-well, horizontal drilling and production growth is driving this trend and should lead to further spending increases.
Mid-East, LatAm, and Russia Fuel Int’l Spend: E&P spending outside NAM is forecast to reach a record of $524bn (+6%) in 2014. This compares to spending of $496bn in 2013 (+10% from 2012). Limited growth by the Majors (+1% int’l) and corruption probes directed at Chinese NOCs are quelling growth expectations. This is somewhat offset by growth in the Mid-East (+14%), Latam (+13%), and Russia/FSU (11%).
Results Support our Bullish Outlook: We believe the reacceleration of E&P spending in NAM and continuation of the int’l upcycle support our constructive view on the group. The industry is in the early days of a prolonged upcycle, in our view, and consequently we expect market fundamentals to favor service companies for the next several years. The Big Four remains our favorite subcategory, led by SLB and HAL. We continue to emphasize well count over rig count, and our preferred SMID-cap names include CJES, KEG, PTEN, SPN, and TCW. Offshore we continue to be selective and prefer high-spec, UDW pure-plays like ORIG and PACD as well as RDC. We remain bullish on the supply boats and recommend HOS and GLF. Our favorite European names include Technip, Subsea 7 and Wood Group, while in Asia our top pick is Anton Oil.
INDUSTRY UPDATE
North America Oil Services & Drilling
POSITIVE
Unchanged
North America Oil Services & Drilling James C. West
1.212.526.8796
[email protected] BCI, New York
Sean C. Meakim, CFA 1.212.526.4420
[email protected] BCI, New York
Zachary Sadow 1.212.526.7930
[email protected] BCI, New York
Shyam Allam 1.212.526.2687
[email protected] BCI, New York
Matt Johnston 1.212.526.8284
[email protected] BCI, New York
European Oil Services & Drilling Mick Pickup +44 (0)20 3134 6695 [email protected] Barclays, London Haley Silverman +44 (0)20 7773 4457 [email protected] Barclays, London
Asia ex-Japan Oil & Gas Clement Chen +852 2903 2498
[email protected] Barclays Bank, Hong Kong
CONTENTS
A Precarious Time; Two Concerning Trends ... 4
1) Majors Under-Investing Amidst Cash Return Calls ... 4
2) Corruption Probes Challenging Chinese Spending ... 5
We maintain our bullish outlook for oilfield services ... 6
GLOBAL E&P SPENDING UPCYCLE CARRIES ON IN 2014
... 8
Middle East leadership continues, LatAm poised for a bounce back ... 8
Actual Spending Likely to Exceed Current Expectations ... 11
THE INTERNATIONAL UPCYCLE CONTINUES; NAM SPENDING
ACCELERATES
... 12
International Growth Continues ... 12
North America Returns ... 13
Sustained Oil Prices Support View of Long-Term Trend in Spending ... 14
KEY DRIVERS OF E&P SPENDING IN 2014
... 15
Commodity Prices Remain Supportive of NAM E&P CAPEX ... 15
2014 Outlook for WTI Prices will Likely Prove Conservative ... 15
Potential Upside to Current CAPEX Estimates Outweighs Downside Risk ... 16
Natural Gas Price Assumptions for 2014 are below Current Price Levels... 17
More Balanced Upside/Downside Potential tied to Natural Gas CAPEX ... 17
International Operators also Baking in Conservatism ... 19
Upside/Downside Potential Attractive ... 19
Horizontal Drilling, Stimulation Continue to Drive E&P Spend ... 20
Oil Prices Still Dominating Budget Decisions ... 20
Exploration Spending to Remain High; But Growth is Slowing ... 21
Good Outlook for International Exploration... 23
Expectations for Higher Pricing Next Year ... 23
COMPANY TYPE AND REGIONAL BREWKOUT ... 25
Supermajors: Under-investing in our view ... 25
HEalthy U.S. Gains Driven by the Land Market and GulF of Mexico ... 27
Canada Poised for a Return to Growth... 33
North American Independents Continue International Exodus ... 37
Middle East: Saudi Driving Spending ... 38
Latin America: Strong Growth Expected to Continue ... 39
Russia and FSU: Gearing Up for Arctic and Unconventional Exploration ... 40
Europe: Solid Outlook Despite Capital Discipline Calls ... 41
India, Asia and Australia: Pause in Chinese Spending ... 42
Africa: Minimal Near-Term Growth Expected ... 43
THE 2014 BARCLAYS GLOBAL EXPLORATION & PRODUCTION SPENDING OUTLOOK
As we have done in prior years, we surveyed more than 300 oil and gas companies worldwide about their spending intentions for the following year. We began this process in
early November and concluded the data gathering last Friday, December 6th. In this report,
we attempt to include all meaningful spenders on exploration and production on a worldwide basis and where necessary we rely on estimates from our global equity research teams. We believe the report continues to improve in comparative accuracy as well, particularly given the buildout of our Asian oil and gas teams in recent years.
Although our survey of oil and gas company CAPEX programs tends to be accurate directionally, the budgeting process for many companies is still underway and in many cases our mid-year update to our survey indicates higher CAPEX spending than originally forecast in the December reports. We think this trend is likely to continue in 2014, particularly if commodity prices remain above E&P budgeted levels.
In addition to securing capital budget data, we also ask companies detailed questions about the assumptions for and the composition of their budgets. All capital budgets in this report and the supplemental spreadsheet are estimates of Barclays Research and are derived from a variety of sources. We intend to update this report once again in mid-2014.
Please reach out to us directly for a detailed Excel spreadsheet with 2013 and 2014 capital budgets for every company in the survey.
A Precarious Time; Two Concerning Trends
Through the myriad of themes and trends within this and recent years’ spending outlook, we thought it would be noteworthy to highlight two concerning developments evident in this year’s data that could have significant ramifications for the global oil markets.
1)
Majors Under-Investing Amidst Cash Return Calls
First, we believe the wave of shareholder activism targeting mid-sized North American E&Ps is percolating up to the Majors and leading some of these companies to right-size international portfolios and slow spending growth. This capital discipline is being driven by a short-term focus on cash returns in our view and we think investor focus and preference will ultimately shift back to production growth (from cash flow growth). However, in the meantime, we think this period of under-investment by the Majors (we forecast global spending growth by the Majors in 2014 of 2.9%) will lead to a period of underproduction and could drive a structural leg-up in international oil prices. This dynamic is similar to the early-to-mid 2000s, in our view, when insufficient investment by the Majors in 2002 and 2003 (0.9% and 0.3%, respectively) contributed to significant oil price appreciation in 2004 and 2005 (35% and 46%, respectively), as illustrated in Figure 1. Further, this retrenchment from the North American independents and Majors is creating an opportunity for resource-hungry NOCs, which do not always adhere to the principles of western finance and are happy to pick-up additional acreage to fulfill ambitious domestic strategic agendas.
FIGURE 1
Underinvestment by the Majors in 2002 and 2003 may have contributed to 35% oil price appreciation in 2004 and 46% in 2005
Source: Barclays Research, Company Reports, and FactSet 4% 19% 0.9% 0.3% 8.8% 8.2% 15.2% 6.7% 15.3% 0.4% -0.2% 16.1% 11.4% 9.1% 2.9% -40.00% -20.00% 0.00% 20.00% 40.00% 60.00% 2000 2001 2002 2003 2004 2005 2006 2007 2008 2009 2010 2011 2012 2013 2014 Majors Brent
We think this period of under-investment by the Majors will lead to a period of
underproduction and could drive a structural leg-up in international oil prices
2)
Corruption Probes Challenging Chinese Spending
Secondly, we believe that the ongoing corruption investigations in China targeting high-level government officials and senior executives at various state owned enterprises (SOEs) are resulting in a period of relative internal stagnation at the large state-owned oil companies (PetroChina, Sinopec, and CNOOC), as these institutions deal with the associated political fallout. As a result, we expect total spending at these organizations to be modestly up (+3.1% worldwide), down from around 14% growth in 2013. We view the pause in Chinese NOC spending as transitory and anticipate total Chinese spending to increase at least 5%-10% in the coming years (which could prove conservative). Ambitious unconventional gas agendas aimed at improving energy security and pollution concerns should drive spending for the remainder of the decade. Excluding these players, we note that total international spending would be 50bps higher at 6.2% (versus our current international growth expectations of 5.7%).
In addition to expectations for a return to strong multi-year growth levels for the Chinese market, we think the Chinese onshore market is on the cusp of a tectonic shift characterized by further opening of the service market to international and private players (we estimate 80%-90% of the Chinese oil services market is absorbed by state-owned service companies). Ambitious unconventional gas production targets coupled with a dearth of in-country technological expertise will drive this change, in our view. As a result, we think the market could open to as much as 50% in the next five years, potentially increasing the overall onshore market opportunity for private companies by 11.5-fold (to over $16 billion from around $1.5 billion today, assuming 15% onshore spending growth versus 7.5% offshore). While the timing of this dynamic is difficult to determine, we illustrate how we anticipate the Chinese market generally to evolve in Figure 2.
FIGURE 2
We Expect the Chinese Onshore Market to Open Significantly in the Coming Years
Source: Barclays Research $0
$30 $60 $90
Current Year 2 Year 3 Year 4 Year 5
Offshore Onshore (Closed) Onshore (Open)
We view the pause in Chinese NOC spending as transitory and anticipate total Chinese spending to increase at least 5%-10% in the coming years
We think the Chinese market could open to as much as 50% in the next five years
We maintain our bullish outlook for oilfield services
We believe the results of this year’s spending outlook, especially the reacceleration of E&P spending in North America and the continuation of the international upcycle, support our constructive view on the group. The industry remains in what we believe are the early days of a prolonged global upcycle, and consequently we expect market fundamentals to favor service companies for the next several years.
After solid outperformance for the group for much of 2013, concerns over the near-term direction of the oil price coupled with some de-risking across the energy space have brought the group’s gain for the year in line with the broader market over the past month (+26%). We think the group remains attractive on a relative value basis: the OSX is currently trading at only 12.4x and 10.2x 2014 and 2015 earnings, respectively, compared to 15.3x and 14.3x for the S&P 500.
Looking towards 2014, we continue to believe the Big Four (BHI, HAL, SLB and WFT) are the
most compelling stocks in the group and our top pick remains Schlumberger followed by
Halliburton. We are also recommending BakerHughes and Weatherford. We believe these four represent the greatest leverage to the international markets and will also benefit from the acceleration in activity we expect to unfold in North America in 2014, while their respective valuations all remain below historical levels.
With North America offering the greatest delta in 2014 over 2013 (compared to international), we believe investors should be positioning in those SMID cap names likely to benefit from incremental improvements in utilization. We continue to emphasize well count driven stocks over those levered to rig count, as drilling efficiencies and increased service intensity are set to continue in 2014. There are several SMID caps with considerable upside,
in our view, as the acceleration in NAM becomes better recognized, including C&J Energy
Services, Calfrac Well Services, Key Energy Services, Patterson-UTI Energy, Superior Energy Services and Trican Well Service.
Within capital equipment, we prefer National Oilwell Varco and Cameron. While Cameron’s
execution problems and persistent guide-downs have been an issue, we believe execution is poised to improve and think estimates are now at achievable levels.
In the offshore rig space we continue to be selective, as we anticipate a continued bifurcation in the floater market as more than 100 floating rigs are delivered through 2015.
We prefer high-specification, ultra-deepwater pure-plays, including Ocean Rig and Pacific
Drilling. We also think the market is not fully recognizing the earnings power associated
Rowan’s four ultra-deepwater newbuilds. We remain bullish on vessel and logistics shares and believe the coming surge of newbuild rigs coupled with a prolonged increase in offshore oil and gas production and subsea construction will result in a substantial
expansion of earnings power for the vessel providers. Hornbeck is our favorite among the
vessel companies because of its higher and accelerating leverage to the deepwater Gulf of
Mexico followed by GulfMark, which also has solid deepwater GOM exposure as well as a
unique footprint in the North Sea.
In Europe, we expect the disappointing performance of 2013 to unwind in 2014, the sector (BEUOILS Index Bloomberg) has underperformed the wider European markets by 30% YTD, despite backlogs hitting all-time highs. Part of this was driven by expectations of spending declines, predicated on a more cautious approach from the Supermajors, but as our results show, spending continues to grow. Another part was executional issues across the sector which led to a series of high profile profit warnings in 2013. This was largely derived from projects signed in the tougher 2009-10 period, most of which has or will work through the order book. As such we expect investors to start to focus on the strong backlogs for the companies.
The OSX’s multiple remains well below that of the broader market
The large cap diversifieds remain the most attractive, in our view, led by SLB
A reacceleration of activity in North America should benefit several SMID cap names in our space
We anticipate a renewed bifurcation in the floater market
Our favorite names in Europe include Technip, Subsea7 and Wood Group
Our preferred plays in European oil services are Technip, Subsea7 and Wood Group. The first two have record backlogs and outlook for further growth as subsea spending accelerates ahead of the industry average, yet are trading at PE relatives similar to the 1998-99 period. We expect this disconnect to unwind. Wood Group, on the other hand is not a backlog driven business. Its engineering business, we believe, should benefit from the desire of the oil industry to maximise its capital, a result which we believe can only be driven by higher upfront engineering. In addition, its facilities management business, PSN, should show growth from continued activity levels in the U.S. shales, an unique exposure among its European peers.
Our top pick among our Asian oil services and rig builders coverage is Anton Oil. We see
2014 as a key year for China’s onshore upstream CAPEX due to the increased scrutiny on oil companies to deliver efficiencies and better manage capital spending. We believe Anton Oil is best positioned to benefit from the growing preference from China’s oil industry to higher value-add and more efficient OFS providers and we expect the company’s increased collaboration with Schlumberger and its increasingly integrated model to drive through the best returns amongst its peers.
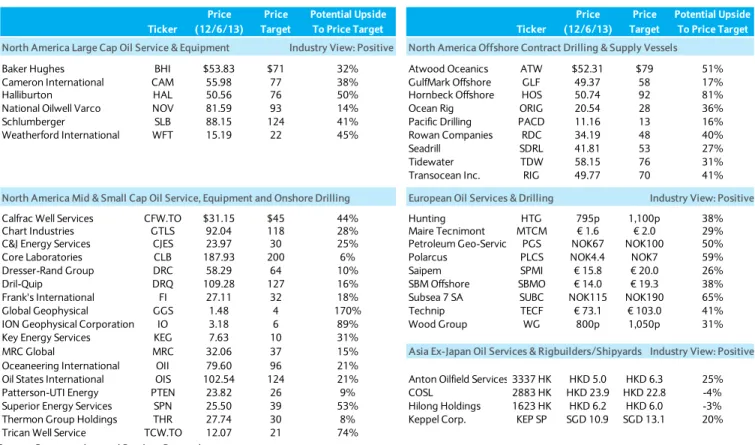
Our Overweight recommendations and current price targets are listed below.
FIGURE 3
Overweight Stocks
Source: Company data and Barclays Research
For full disclosures on each covered company, including details of our company-specific valuation methodology and risks, please refer to http://publicresearch.barcap.com.
Price Price Potential Upside Price Price Potential Upside Ticker (12/6/13) Target To Price Target Ticker (12/6/13) Target To Price Target
North America Large Cap Oil Service & Equipment Industry View: Positive North America Offshore Contract Drilling & Supply Vessels
Baker Hughes BHI $53.83 $71 32% Atwood Oceanics ATW $52.31 $79 51%
Cameron International CAM 55.98 77 38% GulfMark Offshore GLF 49.37 58 17%
Halliburton HAL 50.56 76 50% Hornbeck Offshore HOS 50.74 92 81%
National Oilwell Varco NOV 81.59 93 14% Ocean Rig ORIG 20.54 28 36%
Schlumberger SLB 88.15 124 41% Pacific Drilling PACD 11.16 13 16%
Weatherford International WFT 15.19 22 45% Rowan Companies RDC 34.19 48 40%
Seadrill SDRL 41.81 53 27%
Tidewater TDW 58.15 76 31%
Transocean Inc. RIG 49.77 70 41%
North America Mid & Small Cap Oil Service, Equipment and Onshore Drilling European Oil Services & Drilling Industry View: Positive
Calfrac Well Services CFW.TO $31.15 $45 44% Hunting HTG 795p 1,100p 38% Chart Industries GTLS 92.04 118 28% Maire Tecnimont MTCM € 1.6 € 2.0 29% C&J Energy Services CJES 23.97 30 25% Petroleum Geo-Servic PGS NOK67 NOK100 50%
Core Laboratories CLB 187.93 200 6% Polarcus PLCS NOK4.4 NOK7 59%
Dresser-Rand Group DRC 58.29 64 10% Saipem SPMI € 15.8 € 20.0 26%
Dril-Quip DRQ 109.28 127 16% SBM Offshore SBMO € 14.0 € 19.3 38%
Frank's International FI 27.11 32 18% Subsea 7 SA SUBC NOK115 NOK190 65%
Global Geophysical GGS 1.48 4 170% Technip TECF € 73.1 € 103.0 41%
ION Geophysical Corporation IO 3.18 6 89% Wood Group WG 800p 1,050p 31% Key Energy Services KEG 7.63 10 31%
MRC Global MRC 32.06 37 15% Asia Ex-Japan Oil Services & Rigbuilders/Shipyards Industry View: Positive
Oceaneering International OII 79.60 96 21%
Oil States International OIS 102.54 124 21% Anton Oilfield Services 3337 HK HKD 5.0 HKD 6.3 25% Patterson-UTI Energy PTEN 23.82 26 9% COSL 2883 HK HKD 23.9 HKD 22.8 -4% Superior Energy Services SPN 25.50 39 53% Hilong Holdings 1623 HK HKD 6.2 HKD 6.0 -3% Thermon Group Holdings THR 27.74 30 8% Keppel Corp. KEP SP SGD 10.9 SGD 13.1 20% Trican Well Service TCW.TO 12.07 21 74%
Anton Oil is our preferred way to gain leverage to the Chinese onshore services market
GLOBAL E&P SPENDING UPCYCLE CARRIES ON IN 2014
We project global exploration and production expenditures will rise for the fifth consecutive year in 2014. Over the past four weeks we have had discussions with more than 300 oil and gas companies to assess the health of the industry and the outlook for future growth. The budgets and regional breakouts in this report are Barclays Research estimates.
Next year should mark an acceleration in North America spending growth to over 7% (led by the United States) coupled with continued solid growth (+6%) in several international markets, particularly in the Middle East, Latin America, and Russia. We estimate capital budgets in the U.S. and Canada will rise 8.5% and 3%, respectively, up from 4% and -2% in 2013. Companies are basing 2014 spending plans on oil prices of $98 Brent and $89 WTI and U.S. natural gas prices of $3.66. These projections suggest our early look at 2014 spending levels may underestimate total spending given current commodity price levels.
FIGURE 4
Worldwide E&P Capital Spending By Company Type/Region, 2013-2014
Source: Barclays Research
*We use companies that spend primarily in their home regions as a proxy for the regional forecasts detailed in the previous charts.
Middle East leadership continues, LatAm poised for a bounce back
The Middles East should once again be the fastest growing oilfield services market at more than 14% in 2014, led by significant capital expansions expected for Saudi Aramco and Kuwait Oil Co. After a relative pause in spending growth for Latin America in 2013, the region is poised to return to very solid growth (+13%), driven by a reacceleration of spending in Mexico by PEMEX as well as another aggressive budget for PDVSA in Venezuela, while Petrobras remains in a relative holding pattern. Russian CAPEX is another source of strength, rising 11% in 2014, led by substantial increases in E&P activity from Lukoil (+21% to $14.4 billion) and Rosneft (+26% to $16.6 billion). Gazprom Neft should also spend more in 2014, though this growth is somewhat offset by Gazprom, which we expect to be down 11% in 2014, as the state giant faces increasing competition (from state rivals and private players) and attempts to root out inefficiency. Europe should also post solid growth at 8%, with strong gains from OMV, Eni and Statoil.
2013A 2014E +/- % US Spending 156,163.6143,989.3 12,174.4 8.5% Canada Spending 41,738.2 43,068.8 1,330.6 3.2% NAM Spending: $185,727 $199,232 $13,505 7.3% Middle East 34,791.0 39,812.0 5,021.0 14.4% Latin America 74,590.0 84,159.0 9,569.0 12.8% Russia/FSU 53,940.1 59,844.0 5,903.9 10.9% Europe 46,684.3 50,312.6 3,628.3 7.8% India, Asia & Australia 124,178.2120,928.0 3,250.2 2.7% Majors (Int'l Spending) 115,413.0113,992.0 1,421.0 1.2% Africa 25,241.0 25,337.1 96.1 0.4% NAM Independents (Int'l Spending) 19,395.0 18,547.0 (848.0) -4.4%
Other 6,401.2 6,475.6 74.4 1.2%
Int'l Spending: $495,963 $524,078 $28,116 5.7%
Worldwide E&P Spending: $681,690 $723,311 $41,621 6.1%
Global E&P spending is set to grow about 6% in 2014 to $723 billion in the fifth straight year of growth
We expect the fastest growth to take place in the Middle East, Latin America and Russia
Spending in India, Asia & Australia is projected to post modest growth in 2014 (up 3% vs. 2013), as solid spending increases from Petronas, Pertamina and ONGC are partially offset by declines from Inpex and Santos, while the Chinese NOCs plan mostly flattish spending. Facing increasing pressure from investors to be more selective in its CAPEX plans, Total’s pullback in upstream spending (down 9%) largely mitigates modest increases from the other Supermajors, leading to flattish spending for the group in 2014 (+1%). The North American independents have been selling assets abroad to fund development programs on U.S. land, leading to an expected pullback (-4%) in international CAPEX in 2014. African spending should remain roughly in line with 2013 spending levels.
FIGURE 5
Worldwide E&P Capital Spending By Company Type/Region, 2013-2014 ($ in Millions)
Source: Barclays Research
FIGURE 6
2014 Worldwide E&P Capital Spending By Company Type/Region
US Spending continues to dominate worldwide E&P CAPEX
Source: Barclays Research 0 50,000 100,000 150,000 200,000 US Spending Canada Spending Majors (Int'l Spending) NAM Independents (Int'l Spending)
Middle East Latin America
Russia/FSU Europe India, Asia & Australia Africa Other 2013A 2014E US Spending 22% Canada Spending 6% Majors (Int'l Spending) 16% NAM Independents (Int'l Spending) 3% Middle East 5% Latin America 12% Russia/FSU 8% Europe 7% India, Asia &
Australia 17% Africa 3% Other 1%
FIGURE 7
Worldwide exploration & production capital spending to approach $725 Billion in 2014
Note: $ in millions
Actual Spending Likely to Exceed Current Expectations
Although directionally accurate, our spending forecasts tend to capture budgeting activity as a snapshot in time and in many cases overall spending tends to overshoot our initial forecast. Since 2000, there have been only two instances in which capital spending growth has fallen below the forecasts derived from our survey. The first was 2010, when the spending outcome was marginally lower than expected (we attribute the 1% miss vs. our forecast mostly to Macondo-related activity declines). Next, in 2012 our original forecast of 10% annual spending growth fell short of the actual outcome by roughly 120 basis points. The shortfall was dominated by widespread activity drop-offs in North America, particularly in Canada.
The outcome for 2013 appears poised to resume the long-standing pattern where actual spending outpaces our forecast. Our original spending estimate for 2013, released last December, suggested year over year growth of 6.6% for global E&P spending with most of the uptick driven by international markets while the U.S. and Canada remained flat. Our most recent discussions with the E&Ps indicate that global spending increased 7.4% in 2013 from 2012 as spending gains in the international and U.S. markets will likely exceed our original forecast from last year.
FIGURE 8
Analysis of Historical Report Accuracy
While our survey has been directionally accurate over time, it also tends to prove conservative relative to actual spending levels
Source: Company data and Barclays Research (20%) (10%) 0% 10% 20% 30% Forecast Outcome
THE INTERNATIONAL UPCYCLE CONTINUES; NAM SPENDING ACCELERATES
Transitory issues related to Chinese spending and growing investor preference for cash flow returns among IOCs will likely weigh somewhat on international spending in 2014; however, we continue to believe we are in the midst of a multi-year, double-digit growth spending upcycle internationally characterized by increased drilling in complex geologies on land and exploration and development of traditional and emerging deepwater basins. The NOCs continue to push forward with aggressive drilling programs. Although North America has historically been a short-cycle market characterized by volatile swings in activity, the shift towards oil-directed and liquids rich activity has significantly reduced the cyclicality in the region and will result in more consistent spending levels, in our view. Long-term and across cycles, we expect spending growth in North America to remain in the mid to high single digits through at least 2017.
FIGURE 9
Barclays Multi-Year Exploration & Production Spending Forecast
Source: Company data and Barclays Research
International Growth Continues
E&P spending abroad is forecast to reach a record of $524 billion (+6%) in 2014. This compares to spending of $496 billion in 2013, which rose 10% from 2012 levels. Sustained high oil prices, the sanctioning of major projects, and the delivery of a large number of offshore rigs in both 2014 and 2015 are driving the increases in spending. Further, we note that international spending is expected to impacted by flattish Chinese NOC spending in 2014 (due to corruption probes) and slowing capital spending growth from the Majors. A continued focus on developing domestic portfolios for the NAM independents is exacerbating this trend. An uptick in unrest and uncertainty in Africa (as well as administrative delays in Nigeria) are weighing on growth as well. Outside these transitory issues, growth is expected to be strong internationally, led by the Middle East (+14%), Latin America (+13%), and Russia/FSU (+11%).
0 200,000 400,000 600,000 800,000 1,000,000 1,200,000 2005 2006 2007 2008 2009 2010 2011 2012 2013 2014 2015 2016 2017 Cap it a l S p end ing ($ 's in M illi ons )
United States Canada Outside North America Actual Estimates
We continue to expect double-digit growth internationally on average through at least 2017
North America Returns
Following several years of intense CAPEX acceleration, 2013 is proving to be a period of digestion for the North American upstream market, particularly the U.S. land market. Following this year’s respite, we think North America is poised to resume a steady upward trend in activity levels beginning in 2014 with an initial forecast of 7% growth. We think the modest pause in spending growth in 2013 was the result of a combination of factors including drilling and well service efficiencies in the land market, which enabled the E&Ps to realize lower costs, and a more general capital deployment adjustment on the part of the operators as they assessed resource acreage and began to position for the next phase of the unconventional revolution in North America.
Next year, we anticipate an acceleration in the U.S. in the range of 8.5% growth while Canada should return to modest growth (+3%) following two years of declines. U.S. land spending in 2014 will be characterized by a shift towards full-scale development drilling as NAM independents address the growing inventory of undrilled wells in their acreage by allocating additional capital to the U.S. land market. The Gulf of Mexico continues to be a bright spot, with an additional 17 floaters scheduled to mobilize to the region through 1Q15, giving us visibility on 58 contracted deepwater rigs over the next year and a half. In Canada, the installation of midstream infrastructure, an influx of capital from the majors and NOCs and a burgeoning LNG export market all point to an upward trajectory of E&P spending in Canada for the balance of the decade, in our view. While the impact to 2014 is likely to be rather modest, we see scope for upside in the latter part of the year from incremental activity tied to LNG exports.
FIGURE 10
Historical and Forecast North American E&P Spending
Note: Dollars in millions
Source: Company data and Barclays Research -20,000 40,000 60,000 80,000 100,000 120,000 140,000 160,000 180,000 200,000 2006 2007 2008 2009 2010 2011 2012 2013 2014 Canada US
Our initial survey indicates North American CAPEX to grow 7% in 2014, led by the United States
FIGURE 11
Summary of Oil and Gas E&P Expenditures
FIGURE 12
2014 E&P Spending by Geography
Note: Dollars in millions
Source: Company data and Barclays Research
Source: Company data and Barclays Research
Sustained Oil Prices Support View of Long-Term Trend in Spending
The increase in global capital expenditure budgets forecast for 2014 should be supported by the current commodity price environment, in our view. In the North American markets, E&P spending levels have consistently expanded amid the sustained high price for oil over the last several years and we think the trend will continue in 2014 as the industry further shifts into development mode and operators take advantage of attractive well economics, premium service technology and a favorable business environment in which to deploy capital. International oil prices are also supportive of increased spending levels, and we anticipate the large NOCs that dominate spending internationally will continue to expand capital budgets as breakeven economics for most plays outside NAM are favorable at levels well below the current price of Brent.
2013A 2014E +/- % Count
US Spending 156,163.6143,989.3 12,174.4 8.5% Canada Spending 41,738.2 43,068.8 1,330.6 3.2% NAM Spending: $185,727 $199,232 $13,505 7.3% Int'l Spending: 524,078.5495,962.6 28,115.9 5.7% Worldwide E&P Spending: $681,690 $723,311 $41,621 6.1% 309 United States 22% Canada 6% Outside North America 72%
KEY DRIVERS OF E&P SPENDING IN 2014
Our spending analysis goes beyond simply gauging year over year changes in E&P capital budgets. We ask the operators a number of questions surrounding commodity price assumptions, technology trends and geo-markets to better understand the key drivers of E&P spending patterns. We find these discussions instructive with respect to the industry’s view on capital allocation.
Commodity Prices Remain Supportive of NAM E&P CAPEX
One of the most important questions we ask our surveyed companies is: “What Oil and Natural Gas price are you assuming to plan your capital budget?” Operators in North America are basing 2014 capital budgets on an average oil price of $89 WTI and an average natural gas price of $3.66 Henry Hub (or $3.33 AECO for Canadians using the Alberta benchmark). These budgeted levels compare to current prices of $98 WTI, $4.11 Henry Hub and $3.79 AECO.
2014 Outlook for WTI Prices will Likely Prove Conservative
Our surveyed companies have consistently used conservative oil prices when budgeting for upstream spending. Since 2000, E&Ps have provided an initial WTI price outlook that has fallen short of the realized price by an average of 21%. With the initial WTI budget assumption for 2014 of $89/bbl 10% lower than the current price of WTI at $98/bbl, we think the trend of E&Ps underestimating future oil prices will continue.
We believe conservatism on the part of the North American E&Ps when budgeting for oil prices supports our view that the industry can withstand moderate commodity price volatility and a modest drop in prices over the next year without impacting upstream activity. Barclays Research is currently forecasting an average WTI price of $98/bbl for 2014, which is in line-with current levels.
FIGURE 13
E&P Budget Assumptions for WTI vs. Actual Prices ($/bbl)
Source: Barclays Research, Company Data
Year Actual Price Initial E&P Outlook Difference, % Mid-Year E&P Outlook Difference, %
2000 $30.30 $19.25 -36.5% $22.04 -27.3% 2001 $26.00 $25.25 -2.9% $26.00 0.0% 2002 $26.10 $21.09 -19.2% $22.00 -15.7% 2003 $31.00 $23.22 -25.1% $24.11 -22.2% 2004 $41.50 $25.29 -39.1% $28.44 -31.5% 2005 $56.70 $35.81 -36.8% $40.85 -28.0% 2006 $66.20 $49.89 -24.6% $55.70 -15.9% 2007 $72.40 $55.65 -23.1% $56.90 -21.4% 2008 $99.70 $67.91 -31.9% $85.23 -14.5% 2009 $62.10 $58.30 -6.1% $50.18 -19.2% 2010 $79.60 $70.16 -11.9% $73.56 -7.6% 2011 $95.10 $77.32 -18.7% $87.02 -8.5% 2012 $94.08 $87.17 -7.3% $94.57 0.5% 2013E $98.00* $84.51 -13.8% $86.50 -11.7% 2014E $97.00* $89.44 -7.8% Average, 2000-2013 -21.2% -15.9%
*2013 and 2014 actual are Barclays Research estimates
E&Ps are using $89 WTI for their 2014 CAPEX budgets
Potential Upside to Current CAPEX Estimates Outweighs Downside Risk
North American operators indicated they would likely increase upstream spending if WTI prices increase moderately from current levels. Additionally, the NAM E&Ps have budgeted in a large cushion should oil prices decline next year. According to our discussions, the average E&P benchmarking off WTI would boost CAPEX if WTI averages $107/bbl next year (a modest 9% premium over current levels). Conversely, the price at which most E&Ps would begin reducing CAPEX is significantly lower than current levels at $74/bbl, or a 25% discount to today’s price. We think the average thresholds suggested by the operators indicate an attractive upside/downside scenario for spending next year.
FIGURE 14
WTI Price Thresholds for Increased/Reduced CAPEX in 2014
Source: Barclays Research, Company Data, Factset
While the average price at which NAM E&Ps will boost CAPEX is $107/bbl, a large percentage of our surveyed companies indicated they would likely increase spending at levels closer to $100/bbl. The chart below highlights the percentage of companies that would increase 2014 CAPEX at various price levels for WTI and shows that nearly half of NAM E&Ps would consider raising upstream spend if WTI averages $100 next year (a slight 2% premium from current levels).
FIGURE 15
Percent of NAM E&Ps Likely to Boost CAPEX at Various WTI Price Levels
Source: Barclays Research, Company Data 70 75 80 85 90 95 100 105 110 $/bbl
WTI $/bbl (LTM) Avg. Trigger for Increased 2014 CAPEX Avg. Trigger for Reduced 2014 CAPEX
47% 35% 18% 0% 5% 10% 15% 20% 25% 30% 35% 40% 45% 50% $100 $105-$110 +$110
Natural Gas Price Assumptions for 2014 are below Current Price Levels
North American operators taking part in our survey have consistently missed the mark in forecasting natural gas prices, though we think the impact of natural gas prices on current spending estimates will likely be lower than in past years given the prolific shift towards oil activity. From 2009 to 2012, E&Ps significantly overestimated the price of natural gas when planning the upcoming year’s budget by an average of 31%. It appears the trend of excessive optimism surrounding natural gas prices has reversed course in 2013. Henry Hub prices have averaged $3.69/mmbtu YTD, which is 6% higher than the initial price assumption offered by the E&Ps a year ago and roughly 2% higher than the assumption offered during the mid-year outlook in June.
Assuming stable natural gas prices the remainder of the year (Barclays Research estimates the average natural gas price for 2013E will finish at $3.75), 2013 will be the first year since the 2008 peak in which the E&Ps underestimated the full year average price for gas. The data collected for the 2014 outlook suggests a repeat for next year. Current Henry Hub prices, at $4.11/mmbtu, are 13% higher than the assumption of $3.66/mmbtu currently factored into operator budgets. Barclays Research estimates the price for natural gas in the U.S. will average $3.88/mmbtu next year.
FIGURE 16
E&P Budget Assumptions for Natural Gas vs. Actual Prices ($/mmbtu)
Source: Barclays Research, Company Data
More Balanced Upside/Downside Potential tied to Natural Gas CAPEX
NAM E&Ps suggested that an average natural gas price of $4.57/mmbtu would likely lead to higher upstream spending next year, a 10% premium over current levels and an 18% premium over the Barclays Research estimate of $3.88/mmbtu. On the other hand, the average operator we surveyed indicated it would not cut back on its spending plans unless the price for natural gas averaged $3.16/mmbtu, a 24% discount from current levels and 18% lower than the Barclays Research estimate for next year.
Year Actual Price Initial E&P Outlook Difference, % Mid-Year E&P Outlook Difference, %
2000 $4.32 $2.38 -44.9% $2.58 -40.3% 2001 $4.05 $3.75 -7.4% $4.40 8.6% 2002 $3.37 $2.83 -16.0% $3.03 -10.1% 2003 $5.49 $3.42 -37.7% $4.10 -25.3% 2004 $6.18 $4.17 -32.5% $4.76 -23.0% 2005 $9.48 $5.39 -43.1% $5.74 -39.5% 2006 $6.98 $7.64 9.5% $6.96 -0.3% 2007 $7.12 $6.70 -5.9% $6.74 -5.3% 2008 $8.89 $6.78 -23.7% $8.07 -9.2% 2009 $4.16 $6.35 52.6% $4.68 12.5% 2010 $4.40 $5.21 18.4% $4.65 5.7% 2011 $4.02 $4.31 7.2% $4.31 7.2% 2012 $2.82 $4.08 44.7% $2.40 -14.9% 2013E $3.75* $3.47 -7.5% $3.62 -3.5% 2014E $3.88* $3.66 -5.8% Average, 2000-2013 -6.2% -9.8%
*2013 and 2014 actual are Barclays Research estimates
North American E&Ps are budgeting $3.66/mmbtu for 2014
FIGURE 17
Henry Hub Price Thresholds for Increased/Reduced CAPEX in 2014
Source: Barclays Research, Company Data, Factset
Similar to the sensitivity breakdown for oil prices assumptions, we discovered that while the average operator would not likely boost CAPEX until price levels reached $4.57/mmbtu, a good percentage of E&Ps would allocate more capital to upstream activity at higher natural gas prices.
While the average price at which NAM E&Ps will boost CAPEX is $4.57/mmbtu, a large percentage of our surveyed companies indicated they would likely increase spending at levels closer to $4.00/mmbtu. The chart below highlights the percentage of companies that would increase 2014 CAPEX at various price levels for Henry Hub prices and shows that over 25% of NAM E&Ps would consider boosting upstream spending if Henry Hub prices average $4.00 next year (versus current levels of $4.11).
FIGURE 18
Percent of NAM E&Ps Likely to Boost CAPEX at Various Henry Hub Price Levels
Source: Barclays Research, Company Data 2.50 3.00 3.50 4.00 4.50 5.00 $/mmbtu
Nat Gas $/mmbtu Avg. Trigger for Increased 2014 CAPEX Avg. Trigger for Reduced 2014 CAPEX
26% 37% 37% 0% 5% 10% 15% 20% 25% 30% 35% 40% $4.00 $4.25-$4.50 +$4.50
International Operators also Baking in Conservatism
Prior to 2011, our survey offered only one blended oil price forecast, given the historically small spread between West Texas Intermediate and Brent (~3% on average from 2000 to 2010). However, after the spread widened in 2010, we began asking the companies to specify which benchmark they are using in their budget assumptions. Those tracking Brent have offered forecasts in line with the tradition of underestimating the actual price; the average Brent price forecast for 2013, offered in last year’s survey, was $98, a 10% discount to the YTD Brent average of $108.6, and in line with the full year 2013 Barclays Research estimate of $108. Results for this year’s survey are likewise conservative with respondents forecasting an average Brent price of $98 once again, a 7% discount to the Barclays Research 2013 estimate of $105.
FIGURE 19
E&P Budget Assumptions for Brent vs. Actual Prices ($/bbl)
Source: Barclays Research, Company Data
Upside/Downside Potential Attractive
The results from respondents related to operator willingness to increase or reduce budgets based on fluctuations in commodity prices are compelling in our view, with a bias toward the upside. According to our discussions, the average E&P benchmarking off Brent would boost CAPEX if Brent averages $120/bbl next year (a modest 8% premium over current levels). Conversely, the price at which most E&Ps would begin reducing CAPEX is significantly lower than current levels at $77/bbl, or a 30% discount to today’s price. We think the average thresholds suggested by the operators indicate an attractive upside/downside scenario for spending next year.
Year Actual Price Initial E&P Outlook Difference, % Mid-Year E&P Outlook Difference, %
2000 $28.50 $19.25 -32.5% $22.04 -22.7% 2001 $24.90 $25.25 1.4% $26.00 4.4% 2002 $25.00 $21.09 -15.6% $22.00 -12.0% 2003 $28.50 $23.22 -18.5% $24.11 -15.4% 2004 $38.00 $25.29 -33.4% $28.44 -25.2% 2005 $55.30 $35.81 -35.2% $40.85 -26.1% 2006 $66.10 $49.89 -24.5% $55.70 -15.7% 2007 $72.70 $55.65 -23.5% $56.90 -21.7% 2008 $98.40 $67.91 -31.0% $85.23 -13.4% 2009 $62.70 $58.30 -7.0% $50.18 -20.0% 2010 $80.30 $70.16 -12.6% $73.56 -8.4% 2011 $110.90 $77.32 -30.3% $87.02 -21.5% 2012 $111.41 $97.73 -12.3% $100.10 -10.2% 2013E $108.00* $97.93 -9.3% $101.25 -6.3% 2014E $105.00* $97.78 -6.9% Average, 2000-2013 -20.3% -15.3%
FIGURE 20
Brent Price Thresholds for Increased/Reduced CAPEX in 2014
Source: Barclays Research, Company Data, Factset
Horizontal Drilling, Stimulation Continue to Drive E&P Spend
For the sixth consecutive year, Fracturing/Stimulation and Horizontal Drilling were most commonly cited among operators as having the greatest impact on their spending plans. 3D/4D Seismic fell, which is not surprising given recent shift away from exploration spending and towards Reservoir Recovery Optimization, which was up significantly. Directional Drilling, MWD/LWD, Artificial Lift, Intelligent Well Completions, and Drill Bit Technology were also frequently mentioned as important technologies used in the oilfield.
FIGURE 21
Most Important Technologies (ranked by percentage of responses)
Source: Barclays Research
Oil Prices Still Dominating Budget Decisions
Our most recent surveys indicate that oil prices remain the overwhelming determinant of E&P spending, with over 60% of respondents claiming that the price of oil will be a key factor in 2014 budget plans. The renaissance continues in North America and this marks the fourth year in a row in which companies indicated that oil prices weighed more heavily on spending decisions than gas prices. Additionally, a renewed focus on cash flow was a common theme during our conversations and has risen significantly as a priority among E&Ps over the past two years.
70 80 90 100 110 120 130 $/bbl
Brent $/bbl (LTM) Avg. Trigger for Increased 2014 CAPEX Avg. Trigger for Reduced 2014 CAPEX
2014 2013 2012 2011 2010 2009 2008 2007 2006 2005 2004 2003 2002 2001 2000
Fracturing/Stimulation 27% 22% 29% 28% 23% 26% 21% 26% 22% 16% 19% 14% 18% 11% 11%
Horizontal Drilling 24% 24% 26% 25% 23% 22% 16% 14% 16% 16% 14% 15% 14% 17% 12%
Reservoir Recovery Optimization 12% 6% 5% 6% 7% 7% 10% 9% 7% 8% 9% 10% NA NA NA
3D/4D Seismic 11% 19% 10% 19% 20% 19% 22% 22% 25% 29% 27% 29% 36% 58% 58%
Directional Drilling 7% 7% 9% 7% 7% 7% 11% 10% 9% 9% 11% 11% 11% 4% 4%
Measurement / Logging While Drilling 5% 5% 6% 4% 5% 1% 3% 4% 2% 1% 1% 3% 2% 1% 1%
Drill Bit Technology 4% 3% 3% 5% 5% 6% 4% 5% 8% 9% 5% 4% 4% 3% 2%
Artificial Lift 4% 2% 3% NA NA NA NA NA NA NA NA NA NA NA NA
Intelligent Well Completions 3% 7% 5% 2% 2% 3% 3% 4% 4% 4% 5% 5% 6% 1% 1%
Deepwater Technology 3% 1% 3% 1% 2% 1% 2% 0% 1% 1% 1% 2% 2% 1% 4%
Other 1% 2% NA NA NA NA NA NA NA NA NA NA NA NA NA
Expandable Products 0% 2% 0% 1% 1% 1% 0% 0% 0% 1% 1% 0% NA NA NA
Continuing the massive shift in activity from gas plays to oil, over 60% of respondents cited oil prices as a key factor in their 2014 CAPEX plans
FIGURE 22
Key Determinants of E&P Spending in 2000-2014E (percentage of responses)
Source: Barclays Research
Cash flow has traditionally ranked high as a key determinant for E&P companies and we believe it will remain an important determinant of spending in 2014. We think companies will continue to drill as long as it is economic and they have the cash flow to support drilling. The majority of companies we surveyed (63%) expect to spend within their cash flow during 2014, with 21% projecting expenditures to be equal to cash flow and 42% expecting spending to be less than cash flow. This compares to 67% of companies which expect to spend within cash flow in 2013 including 33% anticipating expenditures will equal cash flow and 34% which expect expenditures will be less than cash flow.
FIGURE 23
E&P Spending vs. Cash Flow in 2013
FIGURE 24
E&P Spending vs. Cash Flow in 2014
Source: Barclays Research Source: Barclays Research
Exploration Spending to Remain High, But Growth is Slowing
The majority of our surveyed companies (53%) indicated that exploration budgets would remain stable or decrease next year, up from 42% last year. Despite the recent pullback in exploration spending, we believe there is room for budgets to grow given the long term trend towards finding increasingly complex and expensive reserves. While the near-term outlook for exploration is somewhat mixed, we expect exploration budgets to remain elevated over the long term as offshore operators move into deeper waters to search for oil and gas and onshore companies increasingly shift towards unconventional plays.
2014 2013 2012 2011 2010 2009 2008 2007 2006 2005 2004 2003 2002 2001 2000
Oil Prices 63% 70% 54% 49% 45% 49% 39% 39% 51% 50% 44% 43% 51% 47% 59%
Cash Flow 60% 64% 46% 53% 48% 48% 47% 42% 36% 60% 54% 53% 59% 65% 68%
Drilling Success 37% 39% 31% 25% 21% 26% 39% 35% 34% 43% 43% 30% 30% 44% 41%
Natural Gas Prices 30% 42% 47% 42% 54% 55% 51% 53% 61% 52% 73% 55% 67% 66% 68%
Prospect Availability 27% 30% 32% 22% 18% 23% 45% 42% 53% 58% 51% 55% 39% 60% 45% Drilling Costs 27% 24% 29% 24% 24% 31% 36% 37% 40% 41% 38% 35% 49% 35% 31% Capital Availability 20% 24% 32% 26% 35% 29% 23% 28% 23% 32% 39% 36% 37% 43% 52% Other 7% 6% NA NA NA NA NA NA NA NA NA NA NA NA NA Less Than 34% Equal To 33% Greater Than 33% Less Than 42% Equal To 21% Greater Than 37%
More E&Ps are planning to spend below cash flow in 2014 (42%) than in 2013 (34%)
We think there is room for growth in exploration budgets as increasingly complex and expensive reserves are pursued
FIGURE 25
2013 Exploration Budget versus Total E&P Capital Expenditures
FIGURE 26
2014 Exploration Budget versus Total E&P Capital Expenditures
Source: Barclays Research Source: Barclays Research
Stable 26% Increasing 58% Decreasing 16% Stable 37% Increasing 47% Decreasing 16%
Good Outlook for International Exploration
The outlook for the economics of exploration mostly improved for 2014 versus the prior year. International exploration economics continue to be viewed favorably among the regions in our survey, and 63% of companies believe the economics for 2014 are “excellent” or “good.” The outlook in the U.S. also remains positive, and 65% of companies responded “excellent” or “good.” The proportion of companies that responded “poor” decreased most significantly in Canada where the majority of respondents now view the region more positively. Approximately 88% of companies believe conditions in Canada are “good” or “fair,” up from 58% in 2013.
FIGURE 27
Economics of Exploration in the U.S., Canada, and Outside North America
Source: Barclays Research
Expectations for Higher Pricing Next Year
E&P companies are expecting service prices to increase in 2014 and roughly 40% of respondents expect fracturing/stimulation and drilling cost increases in 2014. We expect high levels of utilization will drive prices higher internationally across the full array of service and equipment product lines. We believe that capacity for well servicing and stimulation will tighten in 2014 and price increases may follow and day-rates for land rigs will modestly increase as a higher percentage of the industry fleet will be made up of high-spec units that command better pricing.
FIGURE 28
% of Respondents who Expect Increased Costs in 2014 (by product area)
FIGURE 29
% of Respondents who Expect Decreased Costs in 2014 (by product area)
Source: Barclays Research Source: Barclays Research
Excellent Good Fair Poor
2014 2013 2012 2011 2010 2009 2008 2014 2013 2012 2011 2010 2009 2008 2014 2013 2012 2011 2010 2009 2008 2014 2013 2012 2011 2010 2009 2008 United States 24% 28% 15% 8% 2% 5% 11% 41% 56% 42% 38% 44% 53% 49% 35% 12% 42% 37% 43% 34% 35% 0% 4% 2% 17% 11% 8% 4% Canada 13% 17% 9% 9% 0% 5% 4% 63% 33% 48% 35% 21% 32% 32% 25% 25% 39% 33% 62% 51% 50% 0% 25% 4% 23% 17% 12% 14% International 18% 29% 26% 24% 26% 18% 23% 45% 46% 42% 37% 53% 37% 43% 27% 13% 32% 28% 12% 39% 30% 9% 13% 0% 11% 9% 5% 4% Labor 6% Acreage 7% Drilling 20% Other Services 13% Transportation 7% Tubulars 13% Equipment 7% All 7% Fracturing and Stimulation 20% None 34% All 8% 3D Seismic 8% Completion 17% Drilling 8% Other Services 25% About 40% of respondents expect fracturing/stimulation and drilling cost increases in 2014
SUPERMAJORS: UNDER-INVESTING IN OUR VIEW
Following several years of investor preference for production growth over cash flow growth, the pendulum has recently swung the other way, creating a period of soul searching for the Supermajors. The European majors, led by Total (as well as Statoil), are leading the call for capital constraints and attempting to adhere to investor concerns about cost overruns and lackluster cash returns (particularly in the current yield-hungry environment). As a result, we think there is scope for large projects to be postponed and potentially scrapped in the
coming years and expect more scrutiny around ones that remain on the table. We think this
slowing of capital spending growth being expressed by the Majors presents dangers to global oil markets. This trend is reminiscent of the early-to-mid 2000s, another time the Majors failed to invest, contributing to significant oil price appreciation in the mid-2000s. We expect an increasing divergence of capital allocation strategies will emerge among the Supermajors with some of these companies rising to the competitive challenges presented by the NOCs (which are increasingly pursuing unconventional and offshore opportunities), and others retreating from prior production growth strategies in an effort to satisfy near-term shareholder demands. This dynamic should exacerbate the rise of the NOCs and create more international opportunities for these state-owned players.
FIGURE 30
Aggregate Supermajor E&P Spending, 2006 to 2014E ($’s in Billions)
Source: Company Data and Barclays Research
0 20,000 40,000 60,000 80,000 100,000 120,000 2006 2007 2008 2009 2010 2011 2012 2013 2014E
The European majors, led by Total (as well as Statoil), are leading the call for capital constraints
“The Barclays Supermajors”
NOCs Outpacing Majors in “Barclays Supermajor” Spending
Before we take a walk around the world and discuss the outlooks for individual markets, let's first discuss the “Barclays Supermajors”, a mix of IOCs and NOCs that spend over $15 billion globally. This year there are two new entrants to this club of mega-spenders, including Rosneft and PDVSA (15 companies in total, up from 13 last year). The dated term “Supermajor” which referred to those companies with fully integrated exploration, production, refining and marketing capabilities is no longer relevant as a new class of global players have evolved. The majority of the new “Supermajors” spend virtually everywhere and this group is anticipated to drive international spending in the coming years. These companies (53% of which are NOCs), are also driving innovation and R&D spending in their home countries and abroad (via new technology hubs around the world). The Barclays Supermajors should continue to scour the globe in search of incremental production and drive international spending higher in the coming years. In aggregate, the Barclays Supermajors are expected to increase 2014 international budgets by 7% (down from 10% in 2013); however, we note that the NOCs included in the Barclays Supermajors are expected to grow spending over 11.5% in 2014 (11% internationally). Further, excluding PetroChina (the world’s largest spender which we expect to exhibit flat spending in 2014 due to transitory corruption probes within the company and in the Chinese government), the NOCs in the Barclays Supermajors would be expected to be up over 15%. On the other hand, the IOCs in this group are increasing spending by an anemic 3% worldwide and 2% internationally.
This group of Barclays Supermajors is shown in Figure 31 and represents about $357 billion in annual spending or 49% of the total market (up from 45% in 2013) and spends $302 billion internationally (58% of total international spending). All but two are increasing E&P spending this year, with the exceptions being Petrobras and Total. In the U.S., the Barclays Supermajors are expected to spend $42.6 billion, up from $39.3 billion in 2013 (+8.5%), largely driven by increased U.S. spending by Chevron, ConocoPhillips, and CNOOC. We believe these increases are driven primarily by steadily increasing spending in the U.S. land market and the substantial activity growth that is unfolding in the U.S. Gulf of Mexico (in addition to increased Alaska spend for ConocoPhillips).
FIGURE 31
The Barclays Supermajors – Worldwide E&P Spending, 2013 and 2014E ($ in Millions)
Source: Company Data and Barclays Research
0 5,000 10,000 15,000 20,000 25,000 30,000 35,000 40,000 45,000 PDVSA Conoco Phillips
Rosneft CNOOC Petronas Saudi Aramco
BP Statoil Pemex Total Petrobras Shell Chevron Exxon PetroChina 2013 2014E
HEALTHY U.S. GAINS DRIVEN BY THE LAND MARKET AND GULF OF MEXICO
After a slight breather in 2013 following several years of intense CAPEX acceleration, we think activity levels in the U.S. market are poised to resume a steady upward trend in 2014. Spending gains in the U.S. after the 2009 downturn were impressive, with annual increases in upstream CAPEX averaging ~20% from 2009 through 2012. In 2013, there was a tapering in spending increases, though the trend was still positive as we expect 2013 CAPEX in the U.S. will be roughly 4.3% higher than 2012 levels.
We think the modest pause in spending acceleration in 2013 was the result of a combination of factors including drilling and well service efficiencies in the land market, which enabled the E&Ps to realize lower costs, and a more general capital deployment adjustment on the part of the operators as they assessed resource acreage and began to position for the next phase of the unconventional revolution in North America. We believe well inventories are at the highest levels ever for companies that drill in the United States. Next year, we anticipate a renewed acceleration and are forecasting an 8.5% increase in upstream spending. We think spending gains will be dominated by the large independents who typically spend more than $1 billion in the domestic market, though smaller E&Ps are poised to pick up spending as well.
FIGURE 32
U.S. Spending Breakout by Company Budget Size ($ in millions)
Source: Barclays Research, Company Data
Shift to Full Scale Development will Require Increased CAPEX
in the U.S. Land Market
We believe activity in the U.S. land market in 2014 will be driven by several key trends as the industry moves into the next phase of upstream activity, a phase we think will be characterized by full scale development of the shale plays. Proven oil reserves in the U.S. have surged to the highest level in 30 years and many of the NAM independents – who led the way in exploring the shale frontier during the initial phase of the unconventional revolution – are sitting on multiple years (in some cases decades) worth of drilling inventory. Against this backdrop, we expect the E&Ps – led by the NAM independents – to address the growing inventory of undrilled wells in their acreage by allocating additional capital to the U.S. land market.
We also believe technology will become a driving factor in capital allocation as operators continue to seek out providers who possess the expertise to efficiently complete and service the growing number of wells poised to come on line over the next year. This of course plays into the strengths of the major integrated service companies and sophisticated SMID caps. Lastly, we continue to believe upstream spending will be dominated by oil directed activity
2014E 2013E YoY % Companies Change Surveyed
Spending less than $50mm 630 610 3% 46
Spending between $50mm and $100mm 852 681 25% 10
Total Spending under $100mm 1,482 1,291 15% 56
Spending between $100mm and $1bn 25,262 24,954 1% 53
Spending more than $1bn 129,420 117,744 10% 40
Total U.S. Spending 156,164 143,989 8.5% 149
We think activity levels in the U.S. market are poised to resume a steady upward trend in 2014
We are forecasting an 8.5% increase in U.S. upstream spending next year
We think the next phase of the unconventional revolution in the U.S. will be characterized by full-scale development of the shale plays
We continue to believe upstream spending will be dominated by oil directed activity next year
next year. We thinking spending gains in the Permian basin will outpace the rest of the market and are also bullish on activity levels in the Bakken, Eagle Ford, Niobrara and Granite Wash.
Current WTI Prices are Supportive of Increased Capital Budgets
Historically, the correlation between oil prices in North America and upstream spending in the U.S. has been extremely high (the R-squared between nominal prices for WTI and U.S. upstream CAPEX is over 0.90 from 1985 through 2010). In recent years, however, we have seen a decoupling of the relationship between oil prices and upstream spending as CAPEX levels have risen consistently year over year amid an environment of relatively flat WTI prices. From 2011 to 2013E, upstream CAPEX in the U.S. has increased over 13% while WTI prices have averaged less than a 2% gain.
We believe this phenomenon is explained by the fundamental shift in spending patterns brought on by the unconventional revolution. Unconventional wells cost more than 2x the average conventional well to drill and complete and are also more costly to maintain. We also believe this trend is sustainable – provided oil prices remain relatively stable and do not sustain a prolonged decline below the ~$80/bbl threshold that would likely result in budget cutbacks from the U.S. E&Ps. Surging U.S. production is also adding to this trend.
FIGURE 33
U.S. E&P Spending vs. WTI (1985-2014E)
Source: Barclays Research, Thomson ONE, Company Data
Basin Outlook Dominated by the Oil Plays
We think the Permian will be a dominant driver of incremental activity in the U.S. land basins next year. Horizontal activity is becoming the predominant form of drilling as operators continue to exploit the unconventional resources in the region and a number E&Ps have plans to ramp unconventional activity in the Permian next year, notably Pioneer Natural Resources. Traditional big spenders in the Permian include Pioneer, Apache, Anadarko, Devon, and Concho – all of which plan to substantially increase spending in the U.S. next year.
Other oil plays should see activity ramps from the large independents next year as well. In the Bakken, Continental Resources, the most active E&P in the region, has plans to ramp upstream spending by nearly 14% in 2014. The bulk of Continental’s budget will be deployed in the Bakken where the company intends to increase its net well count by 22%. Additional capital (roughly $900 million) will be allocated to the emerging “SCOOP” play in Oklahoma, where Continental plans to increases it well count by over 30%. Noble Energy is expected to surge upstream CAPEX by over 40% in 2014. Noble is a prolific spender in the
0 20 40 60 80 100 120 0 20,000 40,000 60,000 80,000 100,000 120,000 140,000 160,000 180,000 WTI $/bbl
U.S. E&P CAPEX
U.S. CAPEX Nominal WTI ($/bbl)
We continue to believe upstream spending will be dominated by oil directed activity next year
We think the Permian will be a dominant driver of incremental activity in the U.S. land basins next year
Other oil plays should see activity ramps from the large independents next year as well
U.S. with a diverse set of assets that includes offshore plays in the Gulf of Mexico; however, we think the most notable spending trend from the company relates to its long-term plans in the Niobrara where the company is targeting a long-term run rate of new well completions that is +40% higher than current levels.
FIGURE 34
CAPEX Trends from Key U.S. Independent E&Ps
Source: Barclays Research, Company Data
A Further Look into the Implications for Increased Horizontal Activity in the
Permian in 2014
The Permian has been a challenging basin for many service companies in 2013 due to a supply glut of service equipment across multiple product lines, particularly products tied to new well completions. The outlook is improving and fundamentals should continue to inflect in favor of the service companies throughout 2014, in our view. Our E&P spending data indicates solid spending increases from many of the traditional Permian operators and other industry participants we have spoken with in recent weeks have suggested the Permian could experience net additions for horizontal rigs in the 50-70 unit range, or a ~35% increase from current levels. We think the demand tied to these units would help fully rebalance the market for pressure pumpers and provide better utilization for coiled tubing units, wireline equipment and land rigs.
FIGURE 35
Permian Horizontal Rig Count (LTM)
Source: RigData, Barclays Research
We think a number of companies will be beneficiaries of the uptick in horizontal drilling in the Permian. The land drillers, particularly HP and PTEN, have strong exposure to the West Texas markets and are likely candidates for additional newbuild awards – several have already been announced. However, we think the companies that will benefit most from the incremental activity are those companies with underutilized assets already positioned in the region that have leverage to well directed service lines. BAS, CJES and KEG have the
2013 U.S. CAPEX 2014 U.S. CAPEX % change
Anadarko Petroleum Corp. $5,625 $6,225 10.7%
Apache 5,550 5,875 5.9%
Concho Resources 1,560 2,047 31.2%
Continental Resources 3,600 4,100 13.9%
Devon Energy 4,340 5,940 36.9%
Noble Energy 2,574 3,632 41.1%
Pioneer Natural Resources 2,550 2,850 11.8%
66% 63% 61% 60% 56% 57% 58% 58% 57% 55% 52% 49% 48% 47% 34% 37% 39% 40% 44% 43% 42% 42% 43% 45% 48% 51% 52% 53% 0% 10% 20% 30% 40% 50% 60% 70% 80% 90% 100% Vertical Horizontal
The Permian could experience net additions for horizontal rigs in the 50-70 unit range
We think the companies that will benefit most are those with underutilized assets already positioned in the region that have leverage to well directed service lines
strongest overall exposure from their current asset dispositions but we prefer CJES and KEG given the relative quality of the equipment in the respective fleets.
FIGURE 36
Permian Revenue Contribution Estimates
Source: Company data, Barclays Research
Leverage to the Well Count will Continue to be a Critical Factor
Just as important as how much the U.S. E&Ps spend next year is the manner in which they spend it. We think the trend of spending less on rigs and more on completions will continue. Additionally, we think an increasing amount of capital will be directed to production phase services. Artificial lift is a critical component to economic production in the liquid shales and the first large batch of new generation oil wells – drilled during the early stages of the oil renaissance – will begin crossing the age threshold when they require more maintenance, repair and workover services. We think this obviously favors those companies with leverage to increasing well counts – the large cap diversifieds and the SMID-cap service companies – and we think the E&Ps will increasingly look to partner with those companies that possess new technology that meets the need for efficient completion and production service work. This is an area where the large caps excel (Baker’s new FLEX pump is a good example of next generation lift technology for oil wells). Select SMID-caps are also moving up the technology curve in the U.S. land basins (CLB’s new Fracorator system is a potentially disruptive technology aimed at meeting demand for more efficient stimulation services).
Company Revenue Exposure
BAS 44% CJES 35% KEG 22% PTEN 20% HP 19% SPN 10% NBR 8% TCW 8% PD 6% MRC 5% OIS 5% ESI 4%
We think the trend of spending less on rigs and more on completions will continue
FIGURE 37
Total U.S. Well Completions
FIGURE 38
Total Footage Drilled (MM feet)
Source: American Petroleum Institute Quarterly Well Completion Report Source: American Petroleum Institute Quarterly Well Completion Report 4,000 6,000 8,000 10,000 12,000 14,000 16,000 Mar -00 Jan-0 1 No v-0 1 Se p-0 2 Jul -0 3 May -04 Mar -05 Jan-0 6 No v-0 6 Se p-0 7 Jul -0 8 May -09 Mar -10 Jan-1 1 No v-1 1 Se p-1 2 0 20 40 60 80 100 Mar -00 Jan-0 1 No v-0 1 Se p-0 2 Jul -0 3 May -04 Mar -05 Jan-0 6 No v-0 6 Se p-0 7 Jul -0 8 May -09 Mar -10 Jan-1 1 No v-1 1 Se p-1 2