Long noncoding RNA
H19
protects from dietary
obesity by promoting brown adipose tissue
commitment and function
I N A U G U R A L – D I S S E R T A T I O N
zur
Erlangung des Doktorgrades
der Mathematisch-Naturwissenschaftlichen Fakultät
der Universität zu Köln
vorgelegt von
ELENA SCHMIDT
aus Ludwigsburg
KÖLN 2018Table of Contents
Figure Index ... V Table Index ... VII Abbreviations ... VIII
1 Introduction ... 1
1.1The obesity pandemic ... 1
1.1.1 Obesity, type 2 diabetes mellitus, and other obesity-associated diseases ... 2
1.2 Regulation of energy metabolism by adipose tissue thermogenesis in mice ... 3
1.2.1 White adipose tissue ... 4
1.2.2 Brown and beige adipose tissue ... 6
1.2.2.1 Development of brown and beige adipocytes ... 6
1.2.2.2 Characteristics of brown and beige adipocytes ... 7
1.2.2.3 Induction of thermogenesis in brown and beige fat ... 8
1.2.2.4 Brown adipose tissue as therapeutic target for human obesity ... 11
1.3 The non-coding genome ... 12
1.3.1 Long noncoding RNAs and genomic localization ... 13
1.3.2 Multifaceted control of gene expression by lncRNAs ... 13
1.3.3 Metabolic regulation by lncRNAs ... 15
1.3.4 Regulation of brown and beige adipocyte differentiation by lncRNAs ... 15
1.4 Genomic imprinting ... 16
1.4.1 Genomic imprinting and thermogenesis ... 18
1.4.2 The lncRNA H19 ... 19
1.4.2.1 Regulation of H19 expression ... 21
1.4.2.2 Regulation of gene expression by H19 ... 22
1.4.2.3 H19 in the regulation of diabetes ... 22
1.5 Objectives ... 24
2 Materials and Methods ... 25
2.1 Materials ... 25
2.1.1 Technical Equipment ... 25
2.1.2 General Materials ... 26
2.1.3 Chemicals and Reagents ... 27
2.1.4 Commercialized test systems (Kits) ... 29
2.1.5 Buffer and Solutions ... 29
2.1.6 Reagents for cell culture experiments ... 30
2.1.8 List of utilized TaqMan assays ... 31
2.1.9 Indication of utilized miRNA TaqMan assays ... 32
2.1.10 Sequences of oligonucleotides used for qRT-PCR quantification of gene expression using SYBR method ... 33
2.1.11 List of utilized Locked Nucleic Acid (LNA) GapmeR inhibitors ... 35
2.1.12 List of utilized small interfering RNAs (siRNAs) ... 35
2.1.13 Enzymes ... 35
2.1.14 Software ... 35
2.2 Cell biology methods ... 36
2.2.1 Mycoplasma test ... 36
2.2.2 Cryoconservation ... 36
2.2.3 Reconstitution of cryopreserved stocks ... 36
2.2.4 Primary immortalized brown pre-adipocyte (PIBA) cell line ... 37
2.2.4.1 Cultivation and passage of the PIBA cell line ... 37
2.2.4.2 Induction of adipogenesis ... 37
2.2.4.3 LNA mediated gene knockdown of PIBA cells ... 38
2.2.5 Primary cell culture ... 38
2.2.5.1 Isolation of adipose-depots specific stromal vascular fraction (SVF) cells ... 38
2.2.5.2 Induction of SVF adipogenesis ... 39
2.2.5.3 LNA mediated gene knockdown of primary adipocytes ... 40
2.2.5.4 siRNA mediated gene knockdown of primary adipocytes ... 41
2.2.5.5 Subcellular fractionation protocol ... 41
2.2.6 Determination of oxygen consumption rates (OCR) ... 41
2.3 Total RNA isolation ... 42
2.3.1 Trizol based method ... 42
2.3.2 miRVana kit ... 43
2.4 Real-time quantitative RT-PCR (qRT-PCR) ... 43
2.4.1 Reverse Transcription from total RNA to cDNA ... 43
2.4.2 Quantitative RT-PCR (qRT-PCR) analysis ... 44
2.4.3 Reverse Transcription of microRNAs and qRT-PCR ... 44
2.5 RNA sequencing ... 46
2.5.1 Mouse RNA isolation ... 46
2.5.2 Deep RNA-Sequencing procedure ... 46
2.5.3 Data processing of deep RNA-Sequencing ... 46
2.6 Protein biochemistry ... 47
2.6.1 Protein isolation ... 47
2.6.3 Sodium dodecyl sulfate polyacrylamide gel electrophoresis (SDS-PAGE) ... 47
2.6.4 Stripping and reprobing western blot membranes ... 48
2.7 Immunohistochemistry ... 49
2.7.1 Oil Red O staining ... 49
2.7.2 Hematoxylin and eosin staining ... 49
2.7.3 Automated adipocyte quantification ... 49
2.7.4 Electron microscopy and mitochondrial morphometry ... 50
2.8 Capture hybridization analysis of RNA targets (ChART) – Mass spectrometry (MS) 51 2.8.1 ChART ... 51
2.8.2 Sample preparation for mass spectrometry (MS) ... 54
2.8.3 MS ... 54
2.8.4 Bioinformatic analysis of MS data ... 55
2.8.5 Ingenuity pathway analysis and AMIGO2 GO Term Analysis ... 55
2.9 Mouse procedures ... 56
2.9.1 Animal care and research diets ... 56
2.9.2 Experimental mouse models ... 56
2.9.3 Genotyping ... 57
2.9.3.1 Genomic DNA extraction from mouse tails ... 57
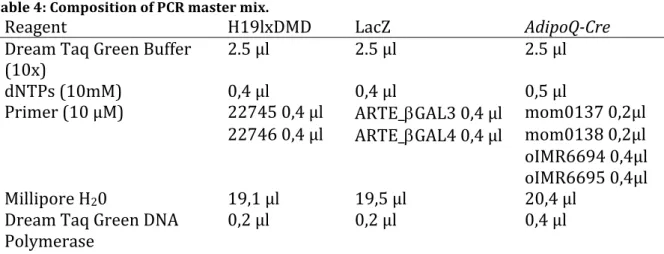
2.9.3.2 Polymerase chain reaction (PCR) ... 57
2.9.3.3 Agarose gel electrophoresis ... 59
2.9.4 Phenotyping ... 60
2.9.4.1 Assessment of body weight ... 60
2.9.4.2 Glucose tolerance test (GTT) ... 60
2.9.4.3 Insulin tolerance test (ITT) ... 60
2.9.4.4 Indirect calorimetry (PhenoMaster) ... 61
2.9.5 Serum analyses ... 61
2.10 Graphical representation of data and statistical analysis ... 62
3 Results ... 63
3.1 Brown adipose tissue (BAT)-regulatory lncRNAs correlate with BAT function ... 63
3.2 LncRNA candidates 2500002B13Rik and H19 control brown adipogenesis ... 68
3.3 Second LNA GapmeR (LNA H19_2) confirms H19 effect on adipogenesis and excludes off-target effects ... 74
3.4 Gene expression of early progenitors remains high in H19-ablated differentiated primary brown adipocytes ... 76
3.5 The imprinted lncRNA H19 controls oxidative metabolism in BAT ... 77
3.7 Cold/diet-induced obesity (DIO)-evoked alterations in H19 are independent of
H19-Igf2 imprinting regulation ... 80
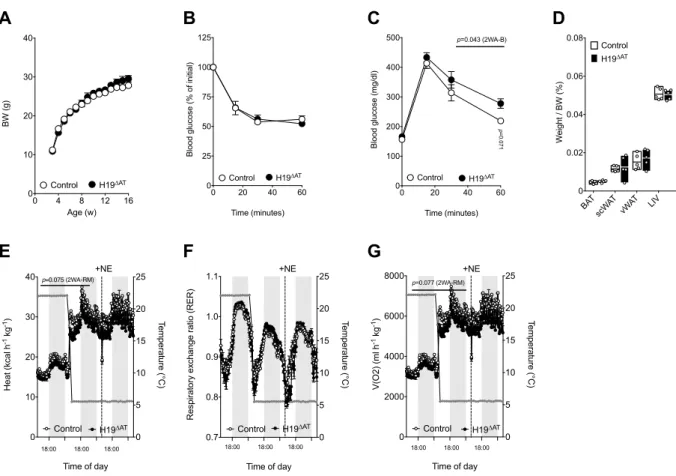
3.8 H19 overexpression prevents DIO and results in increased BAT energy expenditure in vivo. ……… ... 82
3.9 H19 loss in fat impairs energy expenditure (EE) and sensitizes towards DIO-induced weight gain ... 88
3.10 H19 regulates brown adipose mitochondrial biogenesis in vitro and in vivo ... 92
3.11 BAT represents a unique case of tissue-specific imprinting and PEG loss ... 98
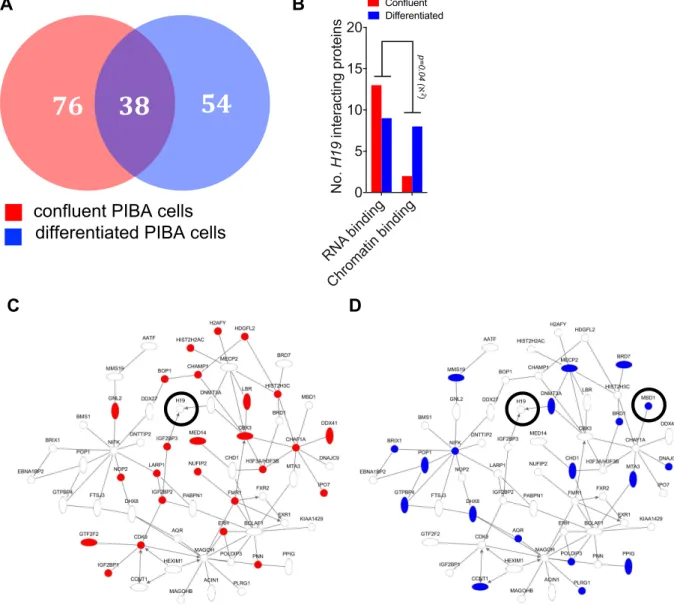
3.12 H19 recruits MBD1 chromatin modifier in mature BAT ... 100
3.13 Fat tissue human H19 (hH19) is reduced in obese humans and correlates positively with browning markers ... 102
4 Discussion ... 103
4.1 Maternally expressed lncRNA H19 regulates BAT differentiation and function independent of imprinting gene cluster in vitro ... 103
4.2 H19 regulates BAT function via regulating mitochondrial biogenesis ... 107
4.3 H19 interacts with MBD1 to repress genes of the imprinting gene network ... 110
4.4 Difficulties in obtaining human BAT biopsies justify the need for mouse studies . 113 4.5 First-line medication for T2DM Metformin influences H19 expression in liver ... 114
4.6 Conclusions and future perspectives ... 116
5 Summary ... 117 6 Zusammenfassung ... 118 7 References ... 120 Acknowledgements ... 140 Erklärung ... 142 Teilpublikation ... 143
Figure Index
Figure 1: Activation of the adipocyte thermogenic program by the b-adrenergic receptor
and natriuretic signalling pathway ... 10
Figure 2: Multifaceted control of gene expression by lncRNAs ... 14
Figure 3: H19-Igf2 imprinting gene cluster ... 21
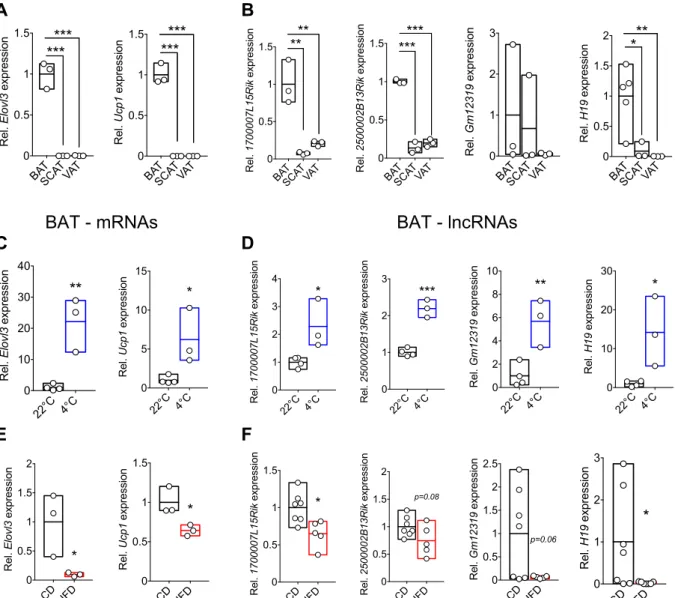
Figure 4: RNA-Seq reveals lncRNAs correlating with BAT function in vivo ... 64
Figure 5: specific candidate lncRNAs reveal similar expression pattern as BAT-associated mRNAs ... 66
Figure 6: Loss of 2500002B13Rik and H19 results in a decrease of lipid accrual ... 69
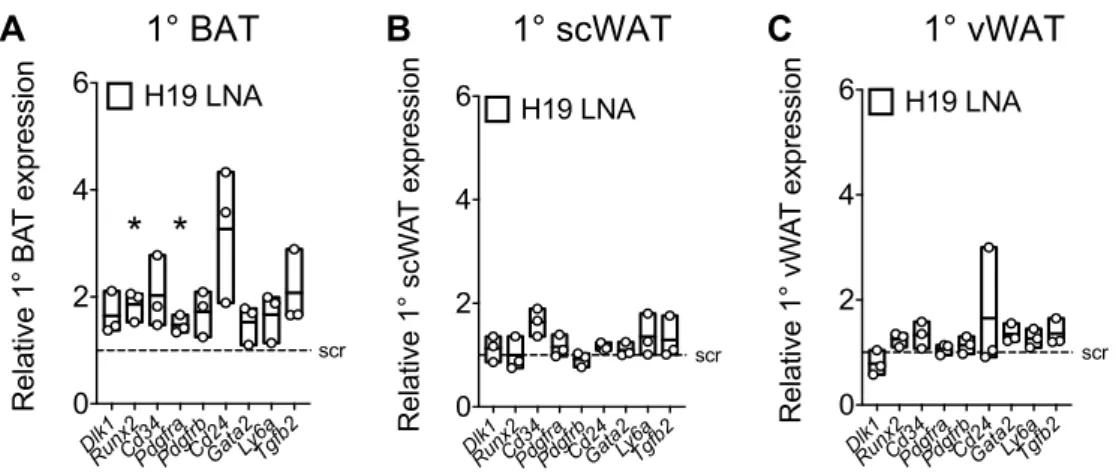
Figure 7: 2500002B13Rik and H19 RNAi results in decreased expression of browning markers in 1° BAT ... 71
Figure 8: LncRNA H19 controls brown but not white adipocyte differentiation ... 73
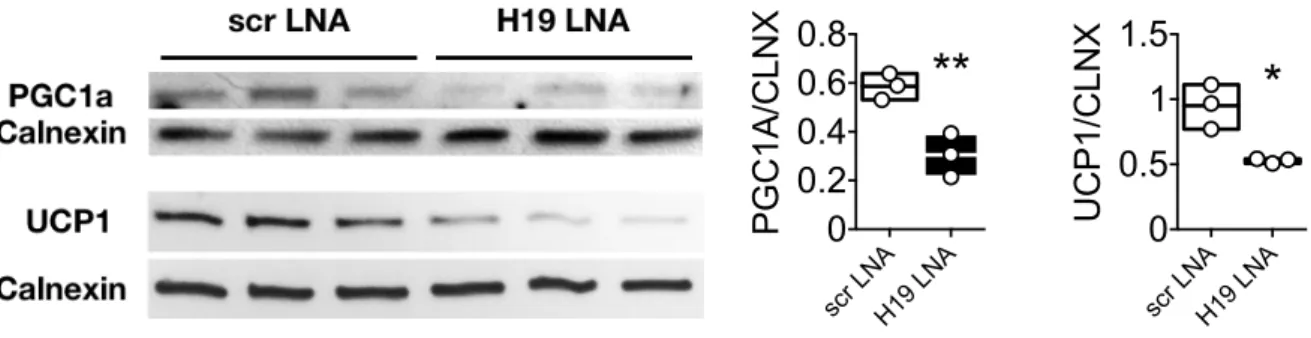
Figure 9: Loss of H19 results in decreased PGC1a and UCP1 protein expression in 1° BAT ... 74
Figure 10: LNA H19_2 confirms H19 effect on adipogenesis and excludes off-target effects ... 75
Figure 11: Failed repression of early progenitor genes in committed 1° BAT upon H19 ablation ... 76
Figure 12: Loss of H19 in 1° BAT impairs oxidative metabolism and uncoupling ... 78
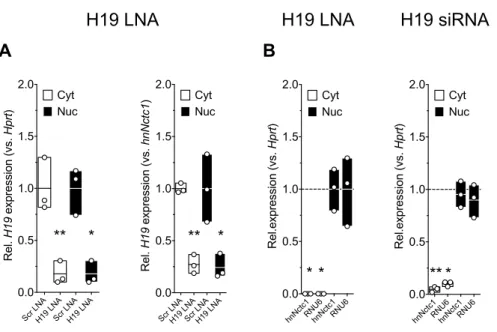
Figure 13: H19 is located in nuclear and cytoplasmic compartments in 1° BAT ... 80
Figure 14: H19/Igf2 cluster and miR-675 are not affected by alterations of H19 upon cold or DIO ... 81
Figure 15: H19 overexpression protects from obesity by increasing energy expenditure and scWAT ‘beiging’ ... 83
Figure 16: H19 prevents whitening of BAT and reduces vWAT hypertrophy ... 85
Figure 17: H19 overexpression causes minor increases of energy expenditure in lean mice ... 86
Figure 18: Systemic overexpression of H19 does not influence food intake, water intake, and locomotion ... 87
Figure 19: Fat-specific deletion of H19 sensitizes towards DIO-associated weight gains and impairments in energy expenditure ... 89
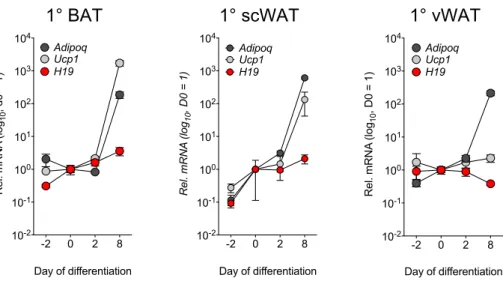
Figure 20: Fat-specific deletion of H19 causes minor decreases in energy expenditure in lean mice ... 90 Figure 21: Fat-specific deletion of H19 does not influence food intake, water intake, and locomotion ... 91 Figure 22: H19 overexpression promotes brown adipose mitochondrial biogenesis in vitro and in vivo ... 93 Figure 23: H19 ablation exacerbates HFD-induced detrimental effects on mitochondrial biogenesis ... 96 Figure 24: Repression of paternal monoallelic gene expression in BAT ... 99 Figure 25: Timecourse of AdipoQ, H19 and Ucp1 expression in 1° adipocytes during differentiation ... 100 Figure 26: ChART-MS reveals H19-associated proteins in confluent and differentiated PIBA cells ... 101
Table Index
Table 1: Composition of media used for primary cell culture ... 40
Table 2: Composition of RT master mix for total cDNA. ... 43
Table 3: List of biotinylated-oligonucleotide sequences. ... 53
Table 4: Composition of PCR master mix. ... 58
Table 5: List of primers for genotyping PCR. ... 60
Table 6: Correlation of human scWAT H19 with obesity cohort patient characteristics, serum parameters and gene markers of adipose tissue browning ... 102
Table 7: Correlation of human vWAT H19 with obesity cohort patient characteristics, serum parameters and gene markers of adipose tissue browning ... 102
Abbreviations
1° Primary
AC Adenylyl cyclase
AMP Adenosine-mono-phosphate
ANOVA Analysis of variance ASO Antisense oligonucleotide
AT Adipose Tissue
Atf2 Activating transcription factor 2 ATP Adenosine-tri-phosphate
BAT Brown adipose tissue
BMI Body mass index
brite Brown-in-white
BtnTg Biotin-TEG
BW Body weight
BWS Beckwith-Wiedemann Syndrome
cAMP Cyclic AMP
CD Control diet
cDNA Complementary DNA
C/EBPb CCAAT/enhancer-binding protein-b
cGMP Cyclic GMP
ChART Capture hybridization analysis of RNA targets Cidea Cell death-inducing DFFA-like effector A CNS Central nervous system
CPAT Coding Potential Assessment Tool CPC Coding Potential Calculator
Cre Cyclation recombination
Creb CAMP response element-binding protein
CT Threshold cycle
CTCF CCCTC-binding factor DEPC Diethyl pyrocarbonate DIO Diet-induced obesity
Dio3 Deiodinase, iodothyronine type III Dlk1 Delta-like non-canonical notch ligand 1
DM Diabetes mellitus
DMD Differentially-methylated domain DNA Deoxyribonucleic acid
dNTP Deoxynucleotide triphosphate
E Embryonic day
EBF2 Early B-cell factor 2
ECAR Extracellular acidification rate
EE Energy expenditure
EM Electron microscopy
eWAT Epidedymal white adipose tissue EZH2 Enhancer of zeste homolog 2
FCCP Carbonyl cyanide-4-(trifluoromethoxy)phenylhydrazone FFA Free fatty acids
Firre Functional intergenic repeating RNA element
Fl Floxed
FPKM Fragments per kilobase of transcript per million mapped reads
GC Guanylyl cyclase
GO Gene ontology
GTT Glucose tolerance test
H19 H19, imprinted maternally expressed transcript H&E Hematoxylin and eosin
HDAC Histone deacetylase
HFD High-fat diet
HNF4a Hepatocyte nuclear factor 4a
hnRNP Heterogeneous nuclear ribonucleoprotein HOTS H19 opposite tumor suppressor
Hprt1 Hypoxanthine phosphoribosyltransferase 1 ICR Imprinting control region
ID Imprinting disorder
Igf Insulin-like growth factor Igf2 Insulin-like growth factor 2
Igf1r Insulin-like growth factor 1 receptor IGN Imprinted gene network
IPA Ingenuity pathway analysis ITT Insulin tolerance test
JARID2 Jumonji, AT rich interactive domain 2 LNA Locked nucleic acids
lncRNA Long noncoding RNA
lincRNA Long intergenic noncoding RNA Mapk Mitogen-activated protein kinase MBD1 Methyl-CpG-binding domain protein 1 MeCP2 Methyl-CpG binding protein 2
MEG Maternally expressed gene Meg3 Maternally-expressed 3
miRNA MicroRNA
MPW Millipore H20
mRNA Messenger RNA
Myf5 Myogenic factor 5
NCD Normal chow diet
Ndufaf7 NADH:Ubiquinone Oxidoreductase Complex Assembly Factor 7
NE Norepinephrine
NEFA Non-esterified fatty acids
NP Natriuretic peptide
Npra Natriuretic peptide receptor A NST Non-shivering thermogenesis
nt Nucleotide
OCR Oxygen consumption rate
O/N Over night
Opa1 Optic Atrophy 1
ORF Open reading frame
PBS Phosphate buffered saline PCAF P300/CBD-associated factor PCR Polymerase chain reaction
Pdgfra Platelet Derived Growth Factor Receptor Alpha PEG Paternally expressed gene
Peg1 Paternally-expressed gene 1 Peg3 Paternally-expressed gene 3 PET Positron-emission tomography
Pgc1a Peroxisome proliferator-activated receptor gamma coactivator 1a PI3K Phosphatidyl inositol 3-kinase pathway
PIBA Primary immortalized brown adipocytes piRNA Piwi-interacting RNA
Pla2 Phospholipase A2
Ppara Peroxisome proliferator-activated receptor a Pparg Proliferator-activated receptor g
PRC2 Polycomb Repressive Complex 2 PRDM16 PR domain zinc finger protein 16 PREF1 Preadipocyte factor-1
P/S Penicillin/streptomycin
qRT-PCR Real-time quantitative RT-PCR
RNP Ribonucleoprotein
RNA Ribonucleic acid
RNAi RNA interference
RNA-Seq RNA-Sequencing
rRNA Ribosomal RNA
RT Reverse transcription
RTemp Room temperature
Runx2 Runt-related transcription factor 2 RXRs Retinoid X receptors
SAH S-adenosylhomocysteine
SAHH S-adenosylhomocysteine hydrolase SCAT or scWAT Subcutaneous adipose tissue
scr Scramble (control)
siRNA Small interfering RNA
SM Skeletal muscle
SNS Sympathetic nervous system snoRNA small nucleolar RNA
SRS Silver Russel Syndrome
SUZ12 Suppressor of zeste 12 homolog SVF Stromal vascular fraction
T1DM Type 1 diabetes mellitus T2DM Type 2 diabetes mellitus
TG Transgene
TGs Triglycerides
TRx Thyroid receptors
Ucp1 Uncoupling protein 1 VAT or vWAT Visceral adipose tissue WAT White adipose tissue
WB Western blot
WHO World Health Organization
w/o Without
WT or wt Wild-type
ZFP516 Zinc finger protein 516 Abbreviations of units bp Basepair µm Micrometre g Gram mg Milligram µg Microgram kDa Kilodalton l Liter ml Millilitre µl Microlitre M Molar mM Millimole µM Micromole nM Nanomole mol Mole
rpm Revolutions per minute
TG Transgene
V Volts
W Watt
°C Degree Celsius
% Percentage
h, min, s hours, minutes, seconds
1 Introduction
1.1The obesity pandemic
Over the last decades, obesity has become a major public health concern with 1.9 billion adults classified as overweight and 650 million as obese in 20161. The World Health
Organisation (WHO) defines overweight and obesity as abnormal or excessive fat accumulation that may impair an individual´s health1.
Although now recommended only as an approximate measure, the body mass index (BMI) is utilised to classify overweight and obesity. BMI is a simple index of weight-for-height defined as a person´s weight in kilograms divided by the square of his or her height in meters (kg/m2)1. A BMI greater or equal to 25 is referred to as
overweight, whereas a BMI greater or equal to 30 is defined as obesity. The number of obesity incidences are steadily increasing with studies showing that, if trends continue as expected, 2.16 billion of the world´s adult population will be classified as overweight and 1.12 billion as obese by 20302. This prognosis is supported by an alarming number
of children and adolescents that are strongly affected by obesity and overweight with an estimated 41 million under the age of 5 years and 340 million aged 5-19 years in 20161.
Obesity results from a steady and complex synergism between predisposing genes and environmental stimuli3. Interestingly, the predisposition to obesity might
already develop in offspring in early stages of life as rodent studies indicate that offspring had a higher risk for the development of obesity and impaired glucose homeostasis when the mother consumed a high-fat diet (HFD) during lactation4. This
result demonstrates the severe impact nutrition might have on an individual´s physiology and draws attention to the alarming reach of the metabolic syndrome. If untreated, obesity can result in severe diseases such as type 2 diabetes mellitus (T2DM)5, artherosclerosis6, cardiovascular disease5, different types of cancer7, liver
manifestations of metabolic disease8, or even mortality9.
The obesity pandemic has reached such a severe impact worldwide that we have transitioned to a world in which suffering due to over-nutrition outpaces that due to under-nutrition10,11 leading to a massive burden on health systems around the globe.
understanding of the adipocyte itself and the etiology of obesity is necessary to develop more successful and personalized prevention and treatment possibilities.
1.1.1 Obesity, type 2 diabetes mellitus, and other obesity-associated diseases
Diabetes mellitus (DM) is characterized by high blood sugar levels over a prolonged period and, therefore, is classified as metabolic disorder. In 2016, DM was listed as number 7 of the top 10 causes of deaths worldwide12. One year later, the International
Diabetes Federation (IDF) estimated the total number of adults (20-79 years of age) with DM to be 425 million worldwide13. DM is classified into two different forms: Type 1
diabetes mellitus (T1DM) and type 2 diabetes mellitus (T2DM).
T1DM is defined as an autoimmune disease in which insulin-producing b-cells of the pancreas are defective, resulting in a complete loss or highly impaired insulin production14. Symptoms include chronic hyperglycemia, polyuria, polydipsia, weight
loss, constant hunger, and fatigue14.
Patients diagnosed with T2DM use the insulin their (initially functional) pancreatic b-cells secrete ineffectively. The disorder is characterized by chronic hyperglycemia caused by the development of insulin resistance in peripheral organs, such as the white adipose tissue (WAT), the liver or the skeletal muscle15. Insulin
resistance develops due to a progressive loss of the insulin-induced inhibitory effect on glycogenolysis and gluconeogenesis. Furthermore, under these conditions, insulin fails to efficiently stimulate glucose and triglyceride uptake into fat and muscle as well as to suppress hepatic glucose production resulting in increased blood glucose levels.
In a healthy state, insulin binds to the insulin receptor and induces a signalling pathway including the phosphatidyl inositol 3-kinase (PI3K) pathway16. Subsequently,
AKT is phosphorylated and activated leading to the expression of many targets involved in metabo-regulatory pathways16. In the beginning, the hyperactivation of pancreatic
b-cells is able to compensate for the insulin resistance. However, chronic hyperglycemia eventually leads to progressive deterioration of pancreatic b-cell function culminating first in exhaustion and loss of these cells ultimately resulting in relative insulin deficiency in T2DM patients17.
The symptoms of T2DM are similar to that of T1DM but are less distinct. Misinterpretation of symptoms can result in a delayed diagnosis, sometimes even years after onset, a situation where complications are inevitable. Hyperglycemia resulting
from uncompensated T2DM increases the risk for microvascular damage and can result in complications like retinopathy, nephropathy and neuropathy18. As such, T2DM can
have massive effects on the function of several organs18. Moreover, T2DM can result in
macrovascular complications which, if left untreated, can result in strokes, heart attacks, and insufficiency in blood flow to legs, potentially leading to amputation18.
Despite the growing knowledge about molecular and cellular alterations associated with the disease, the steadily increase of T2DM diagnoses strengthen the need to understand the underlying aspects contributing to the development and progression of T2DM and other obesity-associated diseases.
1.2 Regulation of energy metabolism by adipose tissue thermogenesis in mice
Prior research has thoroughly investigated how the central nervous system (CNS), in particular the hypothalamic area of the brain, regulates body weight19. Different nuclei
of the hypothalamus have been identified and characterized regarding their function in the regulation of energy homeostasis19. Moreover, previous studies have shown that a
fine-tuned system involving hormonal and neuronal mechanisms is in place to respond to feeding behaviour with neuropeptides produced by the brain20. Nevertheless, to
ensure proper energy homeostasis in the body the bidirectional communication between peripheral tissues and the brain is important20.
One peripheral organ that is strongly involved in the regulation of energy and glucose homeostasis in the body is the adipose tissue (AT). Next to its more mechanistic function of cushioning and insulating the body, the AT stores energy in the form of lipids (lipogenesis) after feeding and ensures lipid mobilisation and distribution (lipolysis) within the body after fasting. During lipogenesis excess carbohydrates are converted to fatty acids, which are subsequently esterified and stored as triglycerides (TGs)21.
Lipolysis, on the other hand, involves the release of fatty acids into the circulation to provide fuel for b-oxidation. Moreover, the AT functions as a paracrine and an endocrine organ. As an endocrine organ, it is responsible for the release of different hormones, in particular adipokines22 that affect various conditions such as appetite, energy balance,
insulin sensitivity, lipid metabolism and lipid homeostasis by interacting with other tissues, the sympathetic nervous system and the brain23.
In mammals, three different classes of adipocytes have been identified: WAT, mainly located in the intra-abdominal and subcutaneous regions, brown adipose tissue (BAT), primarily found in the interscapular region in rodents, and beige/’brite’ (brown in white) AT, an adrenergically inducible form of fat that is dispersed throughout the AT24. All three ATs stem from a mesodermal origin and pre-adipocytes express the preadipocyte factor-1 (Pref1), which represses the differentiation of adipocytes25.
However, as soon as cells undergo growth arrest, Pref1 expression is down-regulated, activating a signalling cascade that results in adipogenic differentiation. Factors which contribute to this process are the transcription factors proliferator-activated receptor g (PPARg) and CCAAT/enhancer-binding proteins (C/EBP a, b and g)26.
While white adipocytes are involved in the storage and release of energy in form of fatty acids in response to systemic demands, brown and beige adipocytes convert dietary and stored nutrients such as fatty acids and glucose directly for the generation of heat in a process called non-shivering thermogenesis (NST). With this, euthermia is maintained by uncoupling electrochemical energy stored within proton gradients in mitochondria24. These processes propelled brown and beige ATs into the focus of
attention as a potential new way to counteract obesity and obesity-associated diseases by increasing whole-body energy expenditure (EE) and, therefore, positively influencing adiposity.
In 1983 it was calculated by Rothwell and Stock that 40-50g of additional maximally stimulated BAT would be sufficient to combust 20% of calories more ingested per day in humans28. Critically to this project, dysfunction in the regulation and
thermogenic activation of AT results in the development of obesity and its associated disorders such as insulin resistance, diabetes, depression, cardiovascular disease and cancer29. Thus, there is an urgent need to better understand the molecular mechanisms
in brown and beige adipocytes as the manipulation of adipocyte biology represents an attractive therapeutic strategy to combat metabolic disease.
1.2.1 White adipose tissue
Adipose tissue is a loose connective tissue which is composed of mature adipocytes as well as the stromal vascular fraction (SVF) composed of a heterogeneous cellular ensemble, consisting of preadipocytes, fibroblasts, vascular endothelial cells, various inflammatory cells (macrophages), and immune cells. It develops in distinct locations
throughout the body and larger accumulations are defined as adipose depots. WAT can be divided into several depots of which the most common depots represent visceral fat (located around internal organs) and subcutaneous fat (located beneath the skin). Additionally, WAT can be found in other parts of the body such as bone marrow, intermuscular or in breast tissue.
Visceral white adipose tissue (vWAT), also called abdominal fat, is composed of several adipose depots, including mesenteric, epididymal white adipose tissue (eWAT) and perirenal depots. It is mainly located inside the abdominal cavity surrounding organs such as the stomach, liver, intestines, or kidneys and drains directly through the portal circulation to the liver23. Here vWAT provides direct hepatic access to free fatty
acids (FFAs) and adipokines which are secreted by visceral adipocytes23. vWAT is
mostly composed of large adipocytes due to its reduced capacity for preadipocytes to differentiate23. Women and men possess different amounts of vWAT. Whereas in
females vWAT accounts for 5-8% of body mass, for males its 10-20%30. However, in
both genders, the amount of visceral fat increases with age30. One study showed that
patients with a higher amount of visceral abdominal obesity had difficulties in disposing and oxidizing glucose and, therefore, greater lipid oxidation compared to people with peripheral obesity23.
In humans scWAT is mainly located in the femerogluteal regions, the back, and anterior abdominal wall and accounts for 80% of all body fat30,31. Normally, lipid release
and uptake in white adipocytes are well balanced. However, due to the constant change in food availability, white adipocytes are more dynamic and possess the possibility to change in size32. Typically, white adipocytes contain a unilocular lipid droplet which
requires 90% of the adipocyte mass and give the cells their spherical shape24. In case of
excess energy intake and limited EE cells either increase in number (hyperplasia) or in size (hypertrophy) to provide a storage side for fatty acids32. The deposition of lipids
within these adipose depots happens in a hierarchical manner. First, fat accumulation in subcutaneous depots represents the normal physiological buffer as it can store FFAs and glycerol as TGs33. Second, as soon as lipid storage capacity is saturated, excess energy
will be stored in vWAT32. When the capacity to store excess TGs in WAT is exceeded or
the possibility to generate new adipocytes is impaired, due to genetic predisposition or stress, fat starts to accumulate in areas outside the adipose tissues23.
Comparing both types of ATs with each other in terms of their role during adiposity, scWAT has been shown to inversely correlate with disease risk whereas
vWAT is often associated with metabolic disease34. In a study by Tran and Kahn (2010),
transplantation experiments showed that placing vWAT into a subcutaneous position had only little positive effect whereas the transplantation of scWAT into visceral compartments resulted in reduced adiposity and improvements in glucose homeostasis35. One contributing factor to the beneficial effects on metabolism is the
property of scWAT cells to undergo browning, a process that is activated in response to different stimuli that lead to the expression of the thermogenic gene program, normally associated with BAT (see 1.2.2). As a consequence, the arising beige cells contribute to EE by reducing the amount of lipids stored within the WAT36.
As described in this section, WAT depots are distinct from each other as they possess specific differences that comprise among others cellular, molecular, and physiological characteristics23.
1.2.2 Brown and beige adipose tissue
1.2.2.1 Development of brown and beige adipocytes
The first adipose depot that forms in mice during embryogenesis is BAT37. BAT provides
newborns with the crucial capacity for NST, thereby enabling them to acclimatize to cold temperatures. Clusters of brown adipocytes can be located in the interscapular region of developing mice as early as embryonic day 14.5 (E14.5)38. By executing fate-mapping
studies in mice, it has been demonstrated that most brown adipocytes in dorsal BAT depots emanate from a mesodermal progenitor population in the somites38–40. In
humans, BAT is primarily localized in the neck, the supraclavicular, and mediastinal regions41.
Brown fat has a different developmental pattern and transcriptional program compared to white fat. Brown adipocytes are marked by myogenic factor 5 (Myf5)39
which encodes a transcription factor that marks myogenic precursor cells and is involved in important processes in skeletal myogenesis. The close relation of BAT and skeletal muscle is confirmed by other shared characteristics. For example, as shown by various gene expression studies, brown adipocyte precursor cells express several skeletal-muscle-specific genes42. Moreover, it has been demonstrated that the
mitochondrial proteome of brown adipocytes is more akin to that of muscle cells than to white adipocytes43. A cell-fate decision between muscle cells and brown fat cells is
regulated by factors such as PR domain zinc finger protein 16 (PRDM16), euchromatic histone-lysine N-methyltransferase 1 (EHMT1), and miR-13339,44–46.
As soon as precursor cells are committed to developing into BAT cells, adipogenic-specific transcription factors and signaling pathways are necessary for the cells´ development into mature brown adipocytes. Early B-cell factor 2 (EBF2) is a marker for committed brown preadipocytes38. EBF2 potentially regulates the lineage
specification and is involved in the development of BAT. A different factor that assists in the differentiation of brown adipocytes is PR domain zinc finger protein 16 (PRDM16) which interacts with the adipogenic transcription factors CCAAT/enhancer-binding protein-b (C/EBPb), peroxisome proliferator activated receptor-g (PPARg), zinc finger protein 516 (ZFP516), and euchromatic histone-lysine N-methyltransferase 1 (EHMT1)24.
The recently identified beige fat47,48 is defined as clusters of uncoupling protein 1
(Ucp1)-expressing adipocytes that are located outside of common brown fat depots. These beige adipocytes have an abundance of mitochondria and develop in depots of WAT upon cold exposure or when exposed to other particular stimuli. Just like brown adipocytes, beige adipocytes are able to convert energy into heat49. The embryonic
origin of beige adipocytes is less clear. It has been demonstrated that beige cells in the subcutaneous depot do not stem from Myf5 positive cells39,50. Therefore, it can be
concluded that beige and brown adipocytes stem from different cell lineages. The question emerged whether beige adipocytes originate from white adipocytes through trans-differentiation or through de novo differentiation and maturation of precursors. Some publications report indications that large unilocular white adipocytes transform into beige adipocytes upon stimulation51. Conversely, a study by Wang et al. (2013), in
which authors pulse labeled mature adipocytes in WAT using LacZ, showed convincingly that most beige adipocytes derive from a precursor population rather than from pre-existing adipocytes52.
1.2.2.2 Characteristics of brown and beige adipocytes
In terms of morphological and biochemical characteristics, brown and beige adipocytes show compelling similarities53. As both contain many small lipid droplets, they are
termed multilocular in contrast to unilocular white adipocytes. Moreover, both adipocytes are densely packed with mitochondria and express marker thermogenic
genes such as Ucp1, cell death-inducing DFFA-like effector A (Cidea), peroxisome proliferator-activated receptor gamma coactivator 1a (Pgc1a), and peroxisome proliferator-activated receptor a (Ppara). Furthermore, in response to specific stimuli, both adipocytes display thermogenesis49.
Despite these striking similarities, brown and beige adipocytes also exhibit unique phenotypic and functional features: Whereas brown adipocytes contain an abundance of mitochondria and express high levels of Ucp1 and other thermogenic components under basal conditions, beige adipocytes express those only upon b-adrenergic stimulation48. This difference between brown and beige fat cells can be
observed in vivo and ex vivo48,54. More specifically, the stable thermogenic character of
brown fat cells is at least partly cell autonomous as adipogenic precursors, isolated from BAT, induce the expression of Ucp1 during the process of differentiation in cell culture54.
In contrast, specific beige precursors or adipogenic precursors from WAT lack the capacity to activate the thermogenic program in culture unless they are stimulated with inducers like thiazolidinediones47,55 or b-adrenergic agonists48. Beige adipocytes are,
therefore, more flexible and can both function as either energy storing or energy dissipating cell types depending on environmental or physiological circumstances.
Moreover, mouse and human beige adipocytes have the capacity to activate the thermogenic mechanism which, consequently, affects systemic energy homeostasis independently of UCP1 function, by running a futile creatine cycle that produces heat as a reaction to stimuli such as cold or b-adrenergic activation. By blocking this cycle, a reduction of the thermogenic capacity of inguinal WAT (and other WAT depots) can be observed which leads to a decline in the animal´s oxygen consumption56. The
phenomenon of this UCP1-independent pathway for thermogenesis in beige adipocytes may be utilized to explain, at least partially, why UCP1-deficient animals are able to survive in the cold through gradual acclimatization24.
1.2.2.3 Induction of thermogenesis in brown and beige fat
Upon cold exposure, NST in mammal BAT is activated aimed at maintaining constant body temperatures through the production of heat independently from shivering57. In
order to fuel NST heat production, BAT combusts nutrients and oxygen delivered through blood circulation. UCP1, and its activity in the mitochondrial membrane of BAT cells, plays and important role in this process. As an electron transporter, UCP1
uncouples the electron transport from ATP synthesis thereby inducing heat production and subsequently EE22.
Cold, as an important regulator of different aspects of BAT, is sensed by diverse mechanisms such as thermoreceptors in the skin. These thermoreceptors elicit sympathetic outflow to BAT through a complex neural circuitry (Figure 1)49. In detail,
the cascade is activated by sympathetic neurons releasing catecholamines such as norepinephrine (NE) that bind to b-adrenoreceptors which are located on the surface of brown adipocytes and activating adenylyl cyclase (AC), consequently increasing cyclic AMP (cAMP; light green circles) concentrations and PKA activity. Among different b-adrenoreceptors, the b3-adrenoreceptors can be identified as the most efficient subtype of BAT thermogenesis22. Next to catecholamines, natriuretic peptides (NPs) bind to
natriuretic peptide receptor A (Npra) and activate guanylyl cyclase (GC) to increase the concentrations of cyclic GMP (cGMP) and activate PKG. Upon activation of PKA and PKG, similar mechanisms lead to transcriptional responses in brown adipocytes through the activity of phosphorylated cAMP response element-binding protein (Creb) and p38 mitogen-activated protein kinases (Mapk). The transcription of downstream thermogenic genes such as Ucp1 results from phosphorylated Mapk causing the phosphorylation and activation of activating transcription factor 2 (ATF2) and PGC1a.
As a transcriptional cofactor, PGC1a regulates specialized functions of brown adipocytes and is considered as a dominant regulator of mitochondrial biogenesis, oxidative metabolism, and thermogenesis in brown fat58. It also interacts with PPARg,
PPARa, retinoid X receptors (RXRs), and thyroid receptors (TRx) and has been shown to be crucial for thermogenesis rather than adipogenesis59. It has as well been shown that
catecholamines lead to an increase of miR-196a causing an increase in C/ebpb expression49. This process supports the drive of the thermogenic gene program.
The activation of PKA and PKG not only triggers the thermogenic gene program, it induces lipolysis as well. Upon lipolysis induction, lipid droplets release FFAs that are subsequently oxidized for heat production by the mitochondria. The release of long-chain fatty acids from the mitochondrial membrane by phospholipase A2 (PLA2) results in the proton leak through UCP1. Other stimuli that are able to induce thermogenesis in BAT comprise b-adrenergic pharmaceuticals such as isoproterenol, hormones, as well as calorie consumption60.
Figure 1: Activation of the adipocyte thermogenic program by the b-adrenergic receptor and natriuretic signalling pathway
Upon cold exposure, sensory nerves of peripheral tissues signal to the hypothalamus, which is responsible for the control of the sympathetic nervous system (SNS). This signalling process triggers the release of the catecholamine norepinephrine (NE) from nerve terminals in the adipose tissue that binds to b-adrenergic receptors (ARs). Natriuretic peptides (NPs) are produced in the heart and increase with cardiac wall stress, cold exposure, and exercise61. The binding of NE to ARs and NPs to the natriuretic peptide receptor
A (Npra), both located on adipocytes, leads to the activation of signalling transduction cascades that result in the expression of thermogenic genes such as uncoupling protein 1 (Ucp1). AC, adenyl cyclase; cAMP, cyclic adenosine monophosphate; cGMP, cyclic guanosine monophosphate; FFA, free fatty acids; GC, guanylyl cyclase; Gs, a G protein subunit; LCFA, long-chain fatty acids; P, phosphate; Gs, a G protein subunit; PKA, protein kinase A; PKG, protein kinase G. From Harms et al. (2013)49. Artwork by D. Maizels.
As the cell´s need for energy supply increases, the respiratory activity, often accompanied by an increase in mitochondrial mass, is enhanced to meet this demand62.
During the process of adaptive thermogenesis, mitochondrial respiration increases, among other things, due to a partial uncoupling of the electron transport from ATP synthesis. In this way, energy is dissipated in the form of heat, consequently making it possible for the animal to adapt to the cold. In addition, this process can counteract obesity by decreasing the possibility of fat storage.
An increase in mitochondrial proliferation presents a challenge to the cells as mitochondrial biogenesis depends on the generation of products that are encoded by both the nuclear and mitochondrial genome62. These products are assembled into the
mitochondrial protein synthesis apparatus62. The coordinated expression of a diverse
set of genes controls the challenge of orderly assembly of these mitochondrial complexes and the maintenance of mitochondrial DNA copy number62.
An important factor in the assembly process is PGC1a. PGC1a leads to the expression of molecules responsible for the synthesis of components of the oxidative phosphorylation apparatus such as mtTFA — a mitochondrial transcription factor controlling the replication and transcription of the mitochondrial genome63 — as well as
UCP1-UCP3. UCP1-UCP3 regulate the uncoupling from the mitochondrial electron transport from ATP synthesis64. Moreover, PGC1a also activates the expression of
nuclear respiratory factors, NRF-1 and NRF-2. Various genes are targeted by these two transcription factors many of which encode subunits of cytochrome oxidase, the ATP synthase complex, and enzymes of heme biosynthesis65.
1.2.2.4 Brown adipose tissue as therapeutic target for human obesity
In adult mice, major BAT depots can be identified in the dorsal anterior region comprising the interscapular, cervical, and axillary BAT66. Interscapular BAT depots,
with a molecular profile comparable to that of classical rodent BAT, can be found in infant humans as well67. For a long time, it was assumed that BAT would only exist in
meaningful amounts in infants and regress and become metabolically negligible in adults. However, lately, positron-emission tomography (PET) imaging studies of glucose uptake have shown that substantial deposits of thermogenic fat reside in adult humans (in addition to interscapular BAT, also perirenal BAT and an adipose depot in the deep neck region can be detected)41,68–71. Therefore, estimations have been made that 50% of
the population possibly possesses BAT in a thermogenically active form although it declines both with age and obesity27,72.
Just like WAT, BAT as an endocrine organ produces different hormones such as batokines and lipokines. These hormones are involved in the regulation of the cross-talk existing between the brain and peripheral organs73. The analysis of marker gene
expression in thermogenic tissues confirmed the expression of UCP1. However, several studies have suggested that some human depots have a molecular profile which is comparable to rodent BAT whereas other depots display a profile of adipocytes which are more similar to beige fat41,48,74. Enerback et al. (1997) demonstrated that the
contrast, another study has demonstrated that long-term adaptation to cold does not require UCP176.
Another trigger for BAT thermogenesis is high-calorie or high-fat diets77 which
depends on UCP1 function and can obstruct obesity78. Mice without BAT are highly
susceptible to the development of obesity79 while those with elevated brown and/or
beige fat function are protected against several damaging metabolic effects of a high-fat diet, such as obesity and insulin resistance80,81. This beneficial effect was also observed
in humans, in which increased levels of brown and beige fat activity correlated with a lean body type. These observations suggest that brown and beige fat could have an important protective role in the metabolism of humans68–70,82. Another factor that
correlated with an improved metabolism in lean83 and diabetic84 subjects was reduction
in ambient temperature. Moreover, treatment with b3-adrenergic agonists resulted in enhanced human BAT and beige fat activity and EE83,85. These studies have spurred
enthusiasm for understanding how the catabolic properties of BAT can be harnessed for therapeutic purposes.
1.3 The non-coding genome
The term noncoding RNA (ncRNA) refers to RNA that does not code for protein. This does not mean, however, that these ncRNAs do not contain information or have a specific function. For a long time, it was assumed that the part of the genome, not translated in protein, was ‘junk’. Only recently, with the help of transcriptome sequencing, it was discovered that only 1-2% of the mammalian genome codes for protein. More than 80% of the genome is transcribed into RNA, which results in the production of many ncRNAs86,87. These ncRNAs include microRNAs (miRNAs; small
ncRNA molecules that are involved in silencing and post-transcriptional gene regulation processes88), piwi-interacting RNAs (piRNAs; small ncRNAs which are part of silencing
processes in the germline or of the RNA-induced silencing complex (RISC)89), small
nucleolar RNAs (snoRNAs; small RNA molecules that are known to regulate the modification and processing of other RNAs90) and other classes of yet-to-be discovered
small regulatory RNAs as well as longer transcripts. Although the function of many of those ncRNAs is not yet discovered, they seem to act as a layer of internal signals that regulate different levels of gene expression in physiology and during development91.
1.3.1 Long noncoding RNAs and genomic localization
Long noncoding RNAs (lncRNAs) are categorized as RNA transcripts that lack open reading frames and protein-coding potential92,93. In former days, lncRNAs were
arbitrarily defined as transcripts longer than 200 nucleotides compared to other ncRNA species such as miRNA, piRNA, and small interfering RNA (siRNA). Similar to mRNA transcripts, most lncRNAs are transcribed by RNA polymerase II and undergo further steps of processing like splicing and polyadenylation. Initially, large-scale discovery of lncRNAs was performed with tiling microarray94,95 and full-length RNA-sequencing96.
Nowadays, epigenome analysis97 and techniques like whole transcriptome
RNA-sequencing (RNA-Seq) have led to the identification of even greater numbers of lncRNAs98,99. Although lncRNA numbers remain debated, RNA-Seq meta-analyses in
human tissues identified >60,000 lncRNAs which surpassed the approximately 22,000 coding genes found in the same study100.
Despite this progress, challenges still remain to accurately annotate and characterize lncRNA transcripts. In a recent study it has been shown, for example, that a transcript originally defined as a muscle lncRNA encodes a small protein in the cell101.
With bioinformatics tools such as PhyloCSF, the coding potential of RNA transcripts can be predicted, which uses comparative genomic analysis of the coding probability of nucleotides across multiple species102. Next to PhyloCSF, other tools to assess coding
potential can be applied such as Coding Potential Calculator (CPC)103, PORTRAIT104 and
Coding Potential Assessment Tool (CPAT) which is advertised as being faster and more accurate than the aforementioned techniques105.
In the genome lncRNAs can be categorized into sense, antisense, intronic, divergent, and intergenic groups based on their location relative to nearby protein-coding genes. The expression of lncRNAs is tissue-specific and strongly regulated during tissue development and in response to physiological signals106–109.
1.3.2 Multifaceted control of gene expression by lncRNAs
In recent years, gain-and-loss-of function research has discovered several lncRNAs that are involved in diverse biological processes in almost all eukaryotes including animals, plants, and yeast110–114. LncRNAs can be localized in different areas of the cells such as
various biological processes such as transcription115,116, cell differentiation117,118, tissue
development119,120, and tumorigenesis/metastasis106,121,122.
Furthermore, studies have shown different mechanisms through which lncRNAs are able to regulate gene expression (Figure 2). In the nucleus, lncRNAs can either function as transcriptional coactivators by direct interaction with transcription factors123,124 or prevent the assembly of transcriptional complexes and thereby lead to
the inhibition of gene expression125,126. Moreover, lncRNAs can exert their
posttranscriptional effects on gene expression by assisting as molecular sponges for microRNAs as it has been shown for the lncRNAs H19 as well as lincRNA-RoR127,128.
One mechanism by which lncRNAs exert silencing of other genes is the recruitment of repressive chromatin-remodeling complexes, such as the Polycomb Repressive Complex 2 (PRC2) and the SWItch/Sucrose Non-Fermentable (SWI/SNF) complexes115,129. In this way, lncRNAs facilitate the recruitment of PRC2 to chromatin,
possibly by building complexes with several components of the PRC2 complex such as Enhancer of zeste homolog 2 (EZH2), Jumonji, AT rich interactive domain 2 (JARID2), and Suppressor of zeste 12 homolog (SUZ12)130,131. Additionally, lncRNAs can also
regulate post-transcriptional events during gene expression such as mRNA translation132, splicing133, and mRNA degradation134.
Figure 2: Multifaceted control of gene expression by lncRNAs
LncRNAs, a subclass of ncRNAs, stand out at being tissue- and species-specific and at exhibiting unique conservation patterns. They have been found to interact with DNA, other RNA molecules, and proteins to fulfil regulatory functions. These interactions can result in transcriptional regulation in which lncRNAs function as decoys for transcription factors (1) or miRNA sponges (2) and with that preventing them to bind to their mRNA target or by lncRNAs building ribonucleoprotein complexes (3). Moreover, lncRNAs can be involved in chromatin remodelling by recruiting chromatin modifiers (4) or by regulating
post-1.3.3 Metabolic regulation by lncRNAs
The regulation of nutrient and energy metabolism in mammals is controlled by reciprocal signaling between different tissues that primarily serve regulatory functions such as the CNS, the pancreatic islets, and metabolic tissues like adipose tissues, liver, and skeletal muscle136. Currently, we are faced with an increased rise of obesity in the
world which is accompanied by a rise in obesity-associated diseases such as insulin resistance and T2DM5. A better understanding of the master regulator insulin which
controls peripheral as well as central-nervous system-related aspects of metabolism is inevitable to understand whole-body metabolism137.
A key step in the development of metabolic disease is resistance toward the metabolic effects of insulin. Interestingly, it has been shown that insulin and insulin-like growth factor 1 (IGF1) signaling also lead to changes in lncRNA expression138. This
finding supports the hypothesis that lncRNAs may be involved in metabolic effects of insulin and progression of insulin resistance. Thus, a strong interest lies within the identification and understanding of new lncRNAs governing mechanisms in energy and glucose homeostasis at cell-intrinsic, organ, and whole-body levels.
1.3.4 Regulation of brown and beige adipocyte differentiation by lncRNAs
In the last years studies have focused on understanding and functionally dissecting the transcriptional and epigenetic regulation of BAT by protein-coding genes139. However,
sequencing initiatives like ENCODE140 project have recently demonstrated that RNA
transcription is a phenomenon observed throughout the majority of genomes in higher organisms and that small noncoding RNAs (sncRNAs) such as microRNAs but also lncRNAs have important functions. The extent to which lncRNAs are involved in the regulation of brown/beige fat development, homeostasis and function is, however, still poorly understood. Yet, recent work on lncRNAs has led to the discovery of several candidates that may be involved in adipocyte biology.
Using whole transcriptome RNA-Seq, Sun et al. (2013) discovered a cluster of lncRNAs that exhibited differential expression during adipogenesis. This cluster contained several lncRNAs that appeared to be required for adipocyte differentiation108.
One candidate, linc-RAP-1 (Firre), has been shown to interact with heterogeneous nuclear ribonucleoprotein (hnRNP) U141. Another brown fat lncRNA, Blnc1, identified by
differentiation and function124. Blnc1 is mainly localized in the nuclear compartment
suggesting a role in transcriptional regulation. Mechanistically, Blnc1 interacts with EBF2. EBF2 is a transcription factor that regulates adipocyte differentiation and brown fat development142,143 and it forms a ribonucleoprotein transcriptional complex to
induce the expression of genes involved in fuel oxidation and uncoupled respiration. The expression of Blnc1 itself is regulated by EBF2 by forming a feedforward regulatory loop that probably serves as a regulator for the thermogenic differentiation of adipocytes142.
In a paper by Alvarez-Dominguez et al. (2015), a cluster of brown fat-enriched lncRNAs was identified by RNA-Seq analysis of transcriptomes from various adipose tissues120. One candidate, Lnc-BATE1, has been shown to be induced during brown
adipocyte differentiation and more highly expressed in BAT as compared to WAT. Lnc-BATE1 appeared to be equally distributed between the cytosol and nucleus and physically interacts with the nuclear matrix factor hnRNP U; a factor required for brown adipocyte differentiation, as already shown for Firre.
Although several profiling studies have been performed to explore the regulation of lncRNA expression during thermogenic adipocyte development, the involvement of lncRNAs in adipocyte biology remains poorly understood. Therefore, future work is needed for understanding the role of these lncRNAs in adipocyte metabolism.
1.4 Genomic imprinting
Genomic imprinting is an epigenetic mechanism resulting in parent-of-origin specific monoallelic expression which affects less than 1% of all genes in eutherians144. It was
first discovered in mammals in 1984 when pronuclear transplantation experiments revealed that both the maternal and paternal genomes are needed for the proper development of mouse embryos145,146. In addition, mouse genetic experiments showed
that in specific regions of the genome, genes fulfil different functions when inherited maternally than when inherited paternally147. The phenomenon of genomic imprinting
must have arisen with the development of the placenta around 125 million years ago148.
However, a plausible explanation of this epigenetic process has not yet been brought forward. Because imprinted genes are monoallelically expressed, one might hypothesize that there are selective advantages for the evolution and maintenance of the organism. Two widely cited theories exist that give reason for the existence of the phenomenon of
genomic imprinting: the ‘kinship theory’ and the ‘coadaptation theory’ (for review, see Peters et al. (2014)148).
The kinship theory, also called the parental conflict hypothesis, states that there is a conflict of ‘interest’ between maternal and paternal genes in a fetus or infant at those developmental stages where it is reliant on the nutritional resources of the mother148,149. The idea of the kinship theory can be explained through the fact that
mothers are able to bear and nurture progeny from several fathers. The consequence is that offspring from one female are equally related to their mother whereas the father is only related to a subgroup of the offspring. Due to the difference in relatedness, different interests of maternal and paternal genomes in the offspring emerge. To provide ideal fitness for the father it is beneficial for paternal genes in the fetus or infant to make maximal use of maternal resources without regard to the detrimental effects to other siblings or the mother. With this, siblings larger in size will be raised that have a better chance of survival and thereby secure the reproduction of the father´s genes. On the other hand, to provide optimal fitness for the mother, maternal genes in the fetus or infant should be reduced in demands for maternal resources, and thus provide the mother with better chances to raise more progeny. This hypothesis is in accordance with the observation that numerous paternally expressed genes (PEGs) enhance growth, whereas maternally expressed genes (MEGs) supress growth, which might also give a reason for adult phenotypes such as maternal care and social behaviour148,150.
The coadaptation theory, in contrast, proposes that for optimization of fetal development and maternal provisioning and nurturing imprinted genes act co-adaptively151. The theory only refers to a subset of predominantely PEGs that are
expressed in the placenta and the hypothalamus. During development of mammalian species, complex interactions happen between the fetus, the placenta, and the mother´s hypothalamus148. These interactions not only influence fetal growth and brain
development but also the provision of maternal resources at prenatal and postnatal stages of development and postnatal maternal care. This is likely regulated by the parent-infant coadaptation through a selection of co-expression of genes both in the placenta and the hypothalamus of the mother148. One example for which this theory
applies is the gene, paternally expressed 3 (Peg3)151.
Deregulation of imprinting, via (epi)mutations in individual imprinting genes or imprinted gene clusters, results in diverse imprinting disorders (IDs). IDs can affect growth, development and metabolism of an individual and often have a severe lifelong
impact on the person´s quality of life. Some examples of IDs are Prader-Willi´s, Beckwith-Wiedemann´s (BWS) and Angelman´s syndromes152,153. Interestingly, in
Silver-Russell´s syndrome (SRS) it has been shown that the ID is due to defects in the
H19-Igf2 locus154, a locus which is of great relevance to this thesis.
In spite of progress in understanding the molecular basis of imprinting, the etiology of IDs155–157 and approaches to cure IDs158, the question remains as to why
some genes but not others are monoallelically expressed149,159. To date, it is not clear
whether specific similarities between PEGs or MEGs as two differing gene sets exist at all, mainly because PEGs/MEGs represent a collection of genes with heterogeneous functions.
Interestingly, one consequence of ID in patients and also mouse models are metabolic sequelae, for instance altered adiposity, lipodystrophy and alterations in insulin sensitivity and EE148. All these processes are closely linked to BAT and WAT
(dys)function.
1.4.1 Genomic imprinting and thermogenesis
To assure survival of newborn mammals, especially those progeny that are born nude, the maintenance of body temperature in the cold is vital. Newborn mice cannot regulate their own body temperature until one week after birth160. This makes them dependent
not only on the mother to provide body heat but also on the litter staying together in the nest to conserve heat. In neonates the regulation of temperature is provided through the process of NST in BAT, which has evolved in mammals to overcome hypothermia22.
During this process chemical energy is dissipated in the form of heat through mitochondrial brown fat UCP122. Several genes have already been identified that affect
BAT and possibly NST.
The Gnas cluster harbours two genes – Gnas (encodes the G protein a-subunit Gsa) and Gnasxl (gives rise to a variant Gsa subunit known as XLas). Normally, Gnas is
known to be a biallelically expressed gene. However, it shows maternal expression in a few tissues148. Gnasxl on the other hand is a PEG depending on the tissue in which it is
expressed161,162. Thus, both genes act antagonistically and have opposite effects on BAT
metabolism with Gsa promoting and XLas repressing the production of heat161,163,164.
Two other PEGs have been shown to inhibit the differentiation of brown adipocytes: Necdin (Ndn) and delta-like 1 homologue (Dlk1)165, although the role of Dlk1
in BAT differentiation before weaning is not clear166. However, Charalambous et al.
(2012) could show that Dlk1 as well as the PEG Dio3 (encodes deiodinase, iodothyronine type III) are important for a second phase of BAT recruitment two weeks after birth. This stage was not recognized until recently and is necessary for thermoregulation when mice start to become independent of the mother by leaving the nest166. When Dlk1 was
overexpressed, BAT differentiation and b-adrenergic signalling was impaired, and overexpression of both Dlk1 and Dio3 even resulted in reduced Ucp1 expression. Thus, through impaired thermogenesis and instable body temperature, BAT is defective in its response to cold. These data support the prediction of the kinship theory of imprinting that PEGs act to reduce thermogenic output and that MEGs on the other hand invest in increasing thermogenic output148,167.
1.4.2 The lncRNA H19
In 1984, the imprinted RNA transcript H19 was identified in a murine fetal liver cDNA library for clones containing mRNA sequences that decrease in expression after birth168.
The clone which hybridized only to a fetal but not to an adult liver cDNA probe was designated H19 based on its position as the 19th clone in row H. H19 is expressed from
the maternal allele in mouse and human169,170 and transcribed by RNA polymerase II,
capped, polyadenylated and spliced. However, it lacks conserved open reading frames (ORFs) between human and mouse171 and is noncoding. The H19 gene encodes a 2.3 kb
noncoding mRNA which is strongly expressed during embryogenesis and consists of five exons and four introns which are shorter than most lncRNA genes, each less than 100 bp172. The H19 locus harbours several transcripts, among them H19 which functions as a
full lncRNA. Moreover, H19 encodes two variants of microRNAs, miR-675173 within its
first exon, but also two antisense transcripts, 91H and HOTS174.
H19 is part of an imprinted gene cluster, which is conserved on mouse chromosome 7 and human chromosome 11p15 (Figure 3). H19 is located adjacent to the protein-coding gene, insulin-like growth factor 2 (IGF2) which is an important fetal growth factor. H19 and Igf2 are oppositely imprinted and co-expressed in endoderm- and mesoderm-derived tissues during embryonic development, which suggests that they are regulated by a common mechanism. Both genes share regulatory sequences which control their expression, including two enhancers which are located 3’ downstream of H19175. Furthermore, an imprinting control region (ICR) is located
between the two gene loci which exhibits differential methylation and controls the expression176.
Although H19 is noncoding, it is abundantly expressed during mammalian development in both embryonic and extraembryonic tissues. H19 is expressed in the embryo and downregulated shortly after birth in all tissues except from skeletal muscle177. H19 has various biological functions and a vast amount of reviews have been
published which discuss research on H19. Prior reviews focus on topics such as H19´s regulation178,179 or its broad role in cancer180 specifically the role of H19 to act either as
an oncogene181 or tumour suppressor182–184. In addition, its participation in the
regulation of cell proliferation185 and differentiation173 has been investigated.
In the developing fetus, H19 regulates several important genes that are part of the imprinting gene network (IGN). One of these genes is Igf2 which is responsible for proper embryonic development186. Moreover, it has been shown to influence mouse
growth independently of the mechanism co-regulating imprinted expression of Igf2 and
H19187. H19 may influence the regulation of growth through at least two distinct
mechanisms involving miRNAs. Sequences within exon 1 of H19 are the source of microRNA miR-675, which is solely expressed in placenta and serves to suppress genes that promote placental growth, including Igf type-1 receptor gene (Igf1r)188.
In addition, H19 RNA acts as a sponge for let-7 family microRNAs188. By binding
to let-7 microRNAs, H19 has been shown to influence the expression of let-7 target genes which end up promoting the differentiation of myoblasts127. Although H19 is one of the
most-well studied lncRNAs, based on its status as being the first lncRNA discovered and characterized and its participation in many known biological functions, to date, nothing is known about its involvement in BAT homeostasis.