5
Public Health
Patty Kostkova
Twitter, crowdsourcing, and other medical technology inventions producing real-time geolocated streams of personalized data have changed the way we think about health (Kostkova 2015). However, Twitter’s strength is its two-way communication nature – both as a health information source but also as a cen-tral hub for the creation and dissemination of media health coverage. Health authorities, insurance companies, marketing agencies, and individuals can leverage the availability of large datasets from Twitter to improve early warn-ing services and preparedness, aid disease prevalence mappwarn-ing, and provide personal targeted health advice, as well as influence public sentiment about major health interventions. However, despite the growing potential, there are still many challenges to address to develop robust and reliable systems inte-grating Twitter streams to real-world provision of healthcare.
1. Introduction
Health and well-being are top priorities for citizens, societies, and governments from individual to national and international levels. In particular, public health threats have become a focus due to globalization, the emergence of new dis-eases, and the reappearance of older infectious diseases. The SARS outbreak in 2003 illustrated how quickly a new virus could spread globally.
The growth of the Internet and social networks has enabled unprecedented support for individual health monitoring and personalized care, as well as large-scale public health measures (Smith & Christakis, 2008; Valente, 2010; Paul & Dredze, 2011). In particular, the role of Twitter in the health domain now encompasses a two-way channel for managing health and seeking health
advice at the personal level on one hand, and for aiding early warning and out-break response systems with the aim of mobilizing knowledge and scientific expertise to protect populations on the other hand.
The spectrum of Twitter health research outreach is impressive. Paul and Drezde (2011) investigated how Twitter became an important medium for understanding concerns about public health, while Christakis and Fawler (2007, 2008) looked into the dynamics of health behavior on a large social network investigating smoking and obesity. De Quincey et al. (2014) and Takahashi, Abe, and Igata (2011) investigated the potential of Twitter to map hay fever, and Sadilek and Kautz (2013) demonstrated the impact of external factors such as pollution and the use of public transport on health.
However, the major focus of Twitter use in the real-world healthcare system has been centered on three topics.
Firstly, social networks have attracted a great deal of interest as a possible source of data for epidemic intelligence (EI), demonstrating it can enhance early warning outbreak detection systems through real-time large-scale popu-lation monitoring in order to predict the spread of the diseases.
The second challenge is using Twitter as a health news dissemination chan-nel, in particular for health risk communication. Governments no longer have complete control over what is published by the media and how it is accessed. Twitter allows global populations to create and share content without editorial comment or moderation, which is of key importance during emergencies and public health dangers. However, this raises concerns over the quality of infor-mation shared via Twitter.
This leads us to the third opportunity – measuring sentiment on major health concerns such as vaccination. Users now have the difficult task of assessing the quality of the information they see without any specific medical training. They are often subject to false information, scare-mongering, and false adver-tising. A recent example is the widespread support that can be found online that ignores scientific evidence and claims that there is a link between measles, mumps, and rubella (MMR) vaccine and autism. The impact of this can be seen in the UK by the increased cases of mumps and whooping cough and the return of previously eradicated infectious diseases, such as measles. However, understanding the communities’ influence and sentiment can direct local pub-lic health communication and control measures where most needed.
This chapter is organized as follows. The next section discusses the role of Twitter as an early warning system through a case study from the 2009 swine flu pandemic. We next discuss the role of Twitter in the dissemination of infor-mation of public health importance with a case study highlighting the role of Twitter for disseminating the World Health Organization (WHO) declaration
of swine flu as a global pandemics on June 11, 2009. Further, we cover sen-timent analysis and vaccination as a case study. The chapter concludes with discussion and future work.
2. Twitter – Early Warning and Preparedness
Epidemic intelligence (EI) is the automated identification of health threats and disease outbreaks, their verification and risk assessment, and investigation to inform health authorities about the required measure to protect the citizens (Kaiser & Coulombier, 2006; Kaiser et al., 2006; Paquet et al., 2006). For over a decade, electronic EI systems using automated news/media scanning tools have complemented traditional surveillance. However, with the increase in the use of social networks (SN) and user-generated web tools called “Web 2.0” (such as Wikipedia, YouTube, Reddit, Twitter, and Facebook), outbreaks are often discovered earlier through EI Web 2.0 tools than through traditional reporting channels. The potential of digital epidemiology analyzing digital data streams for public health purposes brings great potential and new challenges (Salathé et al., 2012) while creating new possibilities for the use of big data (Hay et al., 2013).
The constantly increasing amount of user-generated content on Twitter pro-vides EI systems with a vital source of real-time geolocated context-aware online activity – the SN revolutionized the speed and timeliness of EI. For pub-lic health needs, sampling large populations are the core business that makes Twitter an excellent sampling tool.
In terms of epidemic intelligence, Twitter can be used to both track (de Quincey & Kostkova, 2009; Lampos & Cristianini, 2010; Lampos, de Bie, & Cristianini, 2010) and predict (Szomszor, Kostkova, & de Quincey, 2011) the spread of infectious diseases. We will discuss these studies in detail in the next section. Lampos and Cristianini (2012) used the technique of supervised learning for “nowcasting” events by exploring geolocated Twitter signals for influenza-like illness (ILI) rates. Further, a number of approaches adopted during the swine flu outbreak of 2009 were discussed by the British Medical Journal (BMJ), where public health agencies’ experts highlighted the poten-tial and practical challenges (Malik, 2011; St. Louis & Zorlu, 2012). Also in the United States, ILI were tracked and correlated with Centers for Disease Prevention and Control (CDC) surveillance data by Culotta (2010), and a den-gue fever was tracked using Twitter in Brazil by Gomide et al. (2011). Cullota’s approach used regression and illustrated strong correlation of the two datasets. The role of travel for seasonal transmission of A(H1N1) was also investigated
by Balcan et al. (2009) to provide evidence for potential travel restrictions for policy makers. Recently, Salathé et al. (2013) illustrated the role of digital epi-demiology and Twitter for understanding the new strain of influenza A (H7N9) and coronavirus (MERS-CoV).
2.1. Twitter Predicts a Pandemic – a Case Study
In this section, we present two studies demonstrating the potential of Twitter to provide an early warning signal during the swine flu pandemic in 2009 (Kostkova, Szomszor, & St. Louis, 2014).
Our research using a dataset collected via the Twitter API in the period of May 7 to December 22, 2009, investigated a subset called “self-reported tweets” (users tweeting that they had the disease, whose tweets includes the phrases “have flu,” “have the flu,” “have swine flu,” and “have the swine flu,” in present and past tenses). The investigation demonstrated that these tweets pro-vided a signal indicative of the signal created by the officially reported cases, and by cross-correlating the Twitter dataset with official surveillance, we dem-onstrated that Twitter detected the upcoming spike in the epidemics up to two weeks in the UK and up to three weeks in the United States.
By relying on self-reporting tweets, we make no estimates of the actual number of cases of the disease. However, for early warning systems, the sig-nal change rather than the case numbers is important. We cross-correlated the Twitter self-reporting dataset with the official surveillance data from the UK Health Protection Agency (HPA)1 collected by the Royal College of General Practitioners (RCGP).2 The HPA provides weekly reports on the RCGP ILI consultation rates for England and Wales, Scotland, and Northern Ireland. For comparison, we normalized the tweets’ signal by calculating the percentage of tweets that are self-reporting flu for each day in our investigation period. By applying this normalization process, we eliminated the impact of global trends in Twitter activity (e.g., spam, increased retweeting, and increased posting of links). In Figure 5.1, the two graphs illustrate the HPA RCGP ILI consultation rate for England and Wales (square points, right axis) and the percentage of Twitter activity reporting flu (triangle points, left axis). There is a strong cor-relation between the two data sources, including a sharp peak in activity on Twitter (week 28, July 6, 2009), which corresponds to the rapid increase in the number of consultations.
1 HPA has been since restructured and renamed to Public Health England (PHE), but at the time
of study it was the HPA.
For the United States, we took self-reporting tweets geolocated within the United States and correlated them with the U.S. surveillance data obtained from the CDC website (http://www.cdc.gov/flu/weekly/), the ILINet (U.S. Outpatient Influenza-like Illness Surveillance Network), as illustrated in Figure 5.2. 20 0 200 400 600 0 50 100
Clinical Rate per 100 000
150 200 250 800 T o tal T w eets 1000 1200 1400 1600 21 22 23 24 25 26 27 28 29 30 31 32 33 34 35 36 Week 37 38 39 40 41 42 43 44 45 46 47 48 49 50 51 52 UK UK ILI
Figure 5.1. A plot showing the RCGP ILI rate for England (square points, right axis) versus self-reported cases on Twitter (triangle points, left axis).
W eighted%ILI 0 500 0.0 1.0 2.0 3.0 4.0 5.0 6.0 7.0 8.0 9.0 1000 1500 2000 2500 3000 T otal T w eets 20 21 22 23 24 25 26 27 28 29 30 31 32 33 34 35 36 Week 37 38 39 40 41 42 43 44 45 46 47 48 49 50 51 52 US US % ILI
Figure 5.2. A plot showing the ILI rate for the United States (square points, right axis) versus the number of self-reported cases on Twitter (triangle points, left axes).
We quantify the correlation between the two data signals (in our case, Twitter versus official surveillance data) to illustrate the early-warning poten-tial from the “time-lag” perspective by using the normalized cross-correlation formula. We calculated the normalized cross-correlation ratio between various signals from Twitter and the official RCGP UK surveillance data from surveil-lance and the United States from the CDC ILINet data. Since the data are gath-ered on a weekly basis, we perform the comparison using a weekly aggregation of Twitter data. Equation 5.1 gives the normalized cross-correlation function r
we use, where x(t) is the total number of tweets during week t, and y(t – i) is the number of reported cases according to the HPA or CDC during week (t – i). We calculate r across all flu tweets, those that are self-reporting, those that contain links, and those that are retweets for values of i between –4 and 4.
r x t x y t i y x t x y t i y t t t = −
(
)
(
− −)
−(
)
(
− −)
∑
∑
∑
( ) * ( ) ( ) 2* ( ) 2(5.1)
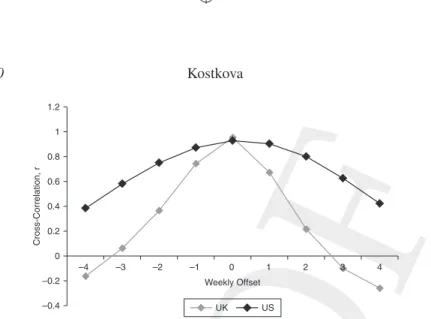
In Figure 5.3, we display the values of r for weekly offsets between i = –4 and
i = 4. The cross-correlation ratio (or sliding dot product) is a measure of how similar two signals are against a moving time lag. This means that values of r
for i = 0 represent how much two signals are correlated, when i = –1, it repre-sents how much the first signal’s last week’s value predicts the second signal’s current value. Thus, in Figure 5.3 we show that the self-reporting tweets have a strong correlation with the HPA data and CDC data. For early warning systems
–0.4 –0.2 0 0.2 0.4 0.6 0.8 1 1.2 –4 –3 –2 –1 0 1 2 3 4 Weekly Offset Cross-Correlation, r UK US
Figure 5.3. The cross-correlation plot between Twitter and the ILI reporting in the UK and the United States.
using social media, we need to focus on the result for negative i, indicating that the Twitter signal predicts the CDC and HPA data by at least one week. There is still a strong correlation at i = –1 (when r = 0.74) in the UK, indicating that the HPA surveillance data could be predicted by Twitter up to week in advance. In the United States, the cross-correlation is even stronger, with a prediction potential up to two weeks, as we obtained r = 0.87 for i = –1 and still highly correlated r = 0.75 for i = –2. Therefore, this correlation results demonstrates the potential of Twitter for early warning and outbreak detection.
Further, in the real world, it is important to note that it takes about a week for the reported figures to reach the national level, be collated, and be acted upon. Therefore, the real-time monitoring of the social network could pro-vide warning up to two weeks earlier in the UK and three weeks in the United States, significantly enhancing the preparedness and response operation.
In the United States, similar results were found by Signorini, Segre, and Polgreen (2011), who evaluated user sentiment during the swine flu outbreak and compared this sentiment with the CDC’s reported disease levels. The data collection in their project started in October 2009, thus missing on the first spike in the 2009 swine flu epidemics. While the authors use SVM for clas-sification of tweets, the results in terms of early warning potential also indicate outbreak detection that is about two weeks earlier than that of public health (PH) agencies, thus confirming our own results.
However, for seasonal diseases, unlike the 2009 swine flu outbreak, where such a high interest and activity on social media from the public is unlikely to be seen, more robust methods are required to develop a system operating on all disease and conditions, improving sensitivity (a percentage of actual out-breaks correctly identified) and mainly specificity (a percentage of days with no outbreak correctly identified) and thus avoiding unnecessary false positives (incorrect outbreak alarm when there is no outbreak happening) that might occur with current solutions.
3. Twitter – Risk Communication and Health News Dissemination
In addition to the potential for early warning, Twitter is increasingly important for risk communication during public health emergencies.
Traditionally, risk communication was conducted using mainstream media – national TV, press, and radio – using a top-down approach led by public health authorities and ministries of health. In this regard, the 2009 swine flu pan-demics were a major breakthrough – Duncan (2009) illustrated the spectrum of swine flu media coverage in the European Union, while a specific study
to analyze risk perception and information seeking behavior during the 2009 pandemic was conducted in Germany (Walter et al., 2012). Twitter was also investigated in its role as health news disseminator (Kwak et al., 2010). Much computing research, such as by Kwak et al. (2010), focused on understand-ing how information cascades through the Twitter social network. However, a large number of followers does not guarantee that information will propagate through the network (Cha, Haddadi, & Benevenuto, 2010) – other factors such as timeliness, accuracy, and entertainment play import roles. Savage (2011) looked into making sense of the information appearing in Twitter.
In the medical domain, the problems are challenging as they are addressing personal health – for example, inaccuracy of self-diagnosis of influenza due to the media hype was illustrated by Jutel et al. (2011) in the case of the 2009 swine flu outbreak. However, reporting public health information on social media during outbreaks (rather than sharing self-diagnosis data) remains a lit-tle researched topic – one of high importance due to the fast nature of informa-tion spread during emergencies, as our following case study will demonstrate.
3.1. Twitter Spreads the News of the Pandemic – a Case Study
In this section, we discuss a case study of the role of Twitter for promotion of online resources covering the WHO’s decision to increase the stage of the epidemic to 63 and declare a global “pandemic” on June 11, 2009. This was undoubtedly the most important event during the 2009 swine flu outbreak that, unsurprisingly, received widespread media attention and was extensively dis-cussed on social media. After the WHO declaration of a pandemic state, a huge volume of information was published by online media with much focus on the effectiveness of vaccination programs and the possible methods to curb the spread of infection (Szomszor, Kostkova, & St. Louis, 2011).
Before we analyze the Twitter coverage of the pandemic, we briefly look at media dissemination through Twitter during the period before and after the declaration. A significant portion of the Twitter traffic we sampled contained a URL. Since the sample we have collected is focused on a particular topic (i.e., “flu”), the links posted provide a good indication of what resources are consid-ered important by the community.
We conducted a classification of the most popular web resources found in our sample dataset to find out what types of resource are the most popular. A complete index of all hyperlinks appearing in our dataset posted to Twitter
3 http://www.who.int/csr/disease/swineflu/frequently_asked_questions/levels_pandemic_alert/
was constructed, including the total number of times the URL appears as well as the total number of distinct authors. For example, the three most popular URLs were the following:
1. http://www.theonion.com/articles/obamas-declaration-of-swine- fluemergency-prompts,6952/, tweeted by 547 authors
2. http://www.benckenstein.com/digital-media/swine-flu-susan-boyleand -the-network-multiplier-effect/, tweeted by 468 authors
3. http://mashable.com/2009/11/10/google-flu-shot-map/, tweeted by 319 authors
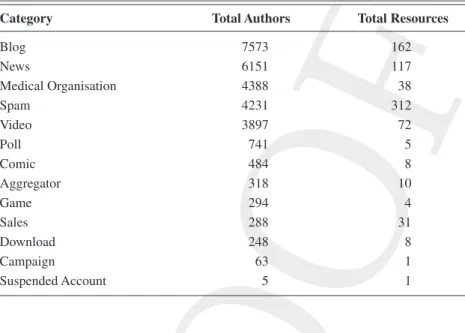
Note that the most popular was “coverage” by the satirical news site the Onion. The classification task was conducted by an experienced journalism grad-stu-dent on the most popular 769 resources posted between June 2, 2009, and August 29, 2009, placing each item in one of the following categories: Blog, News, Medical Organisation, Spam, Video, Poll, Comic, Aggregator, Game, Sales, Download, Campaign, or Suspended Account.
Table 5.1 contains the total number of distinct authors and total number of resources for each classification category. The most widely represented in terms of number of distinct resources linked is spam (40 percent). In the major-ity of cases, this was simple to verify because the user’s Twitter account had
Table 5.1. Categories of flu-related resources posted to Twitter from June 2, 2009, to August 29, 2009
Category Total Authors Total Resources
Blog 7573 162 News 6151 117 Medical Organisation 4388 38 Spam 4231 312 Video 3897 72 Poll 741 5 Comic 484 8 Aggregator 318 10 Game 294 4 Sales 288 31 Download 248 8 Campaign 63 1 Suspended Account 5 1
been suspended or the redirection link registered with URL shortening services had been disabled.
We also identified the number of distinct authors who tweeted a reference to a resource (hence providing a direct measure of the resource’s popularity). Blogs are the most widely linked (26 percent), closely followed by official news articles (21 percent) and pages from official medical organizations (15 percent).
Coming back to investigating the dissemination of the WHO decision to declare a global pandemic on June 11, 2009, a significant amount of reaction was captured by Twitter. This event and the corresponding data we have col-lected provide a unique opportunity to investigate how accurate and timely the responses from major news and public health organizations was, as well as how the news propagated through the network over time.
All links found in our sample dataset on the June 11 and 12, 2009, were examined. URLs were programmatically harvested to determine whether they are still active (i.e., they have not been disabled because they were spam) and whether they are redirected via a URL shortening service. After following all redirection links, it became apparent that many popular online news websites have more than one URL for a particular article. For example, extra arguments are often added to the URL, such as the search term used by the user to reach the page or localization information. Each resource was inspected manually to determine whether it was a direct reference to the WHO announcement. Articles from the most popular news organizations (both UK and U.S.) were shortlisted, along with those from two official health agencies: the WHO and the CDC.
Figure 5.4 shows the popularity of links posted to Twitter (in terms of the number of distinct authors) on an hour-by-hour basis twenty-four hours after the announcement (the time zone is GMT). Ultimately, the most popular resource is the BBC article (arriving to Twitter at 2–3 pm GMT), but this is not the first to make an appearance in Twitter. CNN, Reuters, and USA Today were the first to arrive in Twitter (10–11 am GMT) – four hours before the BBC article was picked up. Both the WHO and CDC also have articles that appear in Twitter (the CDC’s arriving much sooner than the WHO’s), but their uptake is very small compared to the BBC and CNN articles. A link to the website of the European Centre for Disease Prevention and Control (ECDC) covering the news appeared only once.
To summarize, within the space of a few hours, most major news organiza-tions had published on the topic, and those articles were propagated through Twitter. It would seem that timeliness is not a good predictor of overall success of dissemination of the news: between June 11 and 12, 2009, the BBC article
became the most popular even though it appeared on Twitter four hours later than other news agencies.
However, to fully incorporate social median channel in risk communication strategies by major public health agencies, more research is required to better understand public understanding, reaction, and behavior in response to emer-gency alerts. Also, the population not using social media and the Internet needs to continue being served by traditional mass media communications.
4. Twitter – Health Sentiment and Public Language
Twitter has been used to assess the populations’ sentiment since the early days of Twitter research. For example, Golder et al. (2011) used Twitter to assess diurnal and seasonal mood across different cultures. Covering Twitter-based research into sentiment in general terms is not the aim of this chapter. Here we will focus on health sentiment; positive and negative feelings about diseases; and, in our case study, an important public health measure – vaccination.
The homophily hypothesis stipulates that social interactions and networks are a result of likeminded views and values, while according to social influence hypothesis, the causality is the other way around. A number of studies inves-tigated the confounding of influence-driven and homophily-driven contagion
00:00 0 50 100 150 200 T o tal T w itter A uthors 250 300 350 400 450 500 03:00 06:00 09:00 12:00 15:00 18:00 21:00
Time of Day June 11 and 12 2009
00:00 03:00 06:00 09:00 12:00 15:00 18:00 21:00
BBC CNN REUT BNO USAT WP
MS GUAR FT CDC WHO
Figure 5.4. Hour-by-hour breakdown of the most popular resources posted to Twitter from the major news organizations and public health agencies when the WHO announced H1N1 was pandemic.
in social networks; examples include Aral et al. (2009), Shalizi and Thomas (2011), among others. However, these factors have a wider implication for public health interventions, prevention measures, and disease control. Salathé et al. (2013) demonstrated that a large number of opinionated neighbors inhibit the expression of sentiments, while exposure to negative sentiment “spreads” and is predictive of future negative sentiment expression. On the other hand, exposure to positive sentiments is generally not; it can even predict increased negative sentiment expression.
An increasingly important role of Twitter also lies in providing an insight into public information needs; public understanding of health terminology; use of lay language, colloquial terms, and jargon; and the general information the public needs about health.
In a recent study of antibiotic understanding on Twitter, social media was shown to be a useful way to disseminate medical information, but that it is also prone to abuse (Scanfeld, Scanfeld, & Larson, 2010). In particular, Twitter can be used to assess public knowledge (e.g., the widely held but incorrect assump-tion that antibiotics will treat a cold, or that course of antibiotics, prescribed by a doctor, can be stopped once the symptoms have disappeared) and therefore reveal gaps in public understanding. Further, data correlation of three datasets (news, searches by public, and searches by professionals) were investigated on the NeLI/NRIC4 datasets (Kostkova et al., 2013). Although this study did not use Twitter, it illustrated a strong correlation of public information needs with media coverage of health topics. Gesualdo et al. (2014) investigated the pub-lic usage of jargon in relation to ILI and correlated the use of related terms on Twitter, joining the ECDC ILI case definition with that of the United States’ traditional surveillance systems.
Our case study illustrates the role of health sentiment on social networks regarding one of the most important public health measures, vaccination.
4.1. Twitter Gets You Vaccinated: A Case Study
Vaccination is an ideal example of successful public health intervention pro-tecting entire populations from previously deadly communicable diseases (CDC, 1999). However, due to recent vaccination scares and antivaccination campaigns, previously high vaccination levels have been going down, and almost eradicated diseases (tuberculosis, measles, etc.) are on the rise (Ash, 2010). Outbreaks of vaccine preventable diseases (VPD) are more likely to
happen if overall vaccination rates decline (Jansen et al., 2003) or if a strong vaccination refusal is common in local communities (Salathé et al., 2008).
Salathé and Khandelwal (2011) conducted a large investigation of vaccina-tion sentiments in online social networks. Using publicly available data from 101,853 users of online media collected over a period of six months (from August 2009 until January 2010 in the United States) during the swine flu pandemics, a spatiotemporal sentiment toward a new vaccine was measured. This was validated against the CDC-estimated vaccination rates by region to demonstrate a strong correlation.
Out of the 477,768 collected tweets, 318,379 were classified relevant to the A(H1N1) vaccine. Tweets were classified into four categories: out of those 318,379 tweets, 255,828 were classified as “negative” and 35,884 as “posi-tive,” while the rest were considered “neutral” and “irrelevant.” For example:
r “Off to get swine flu vaccinated before work” is a “positive” tweet.
r “What Can You Do to Resist the U.S. H1N1 ‘Vaccination’ Program? Help Get Word Out. The H1N1 ‘Vaccine’ Is DIRTY. DontGetIt,” is a negative tweet.
r “The Health Department will be offering the seasonal flu vaccine for chil-dren 6 months–19 yrs. of age starting on Monday, Nov. 16,” is deemed a “neutral” tweet.
r A tweet was labeled as “irrelevant” if it was retrieved in error and was not related to vaccination and swine flu.
Three machine learning classification algorithms were used (Naïve Bayes, Maximum Entropy, and a Dynamic Language Model classifier), and labels to train the classifiers were provided by students participating in the study, dem-onstrating 64 percent average accuracy. A social network was created from the data by taking into account all users (constituting “nodes”) who posted at least one positive, negative, or neutral tweet. An “edge” in the social network (SN) between users A or B means that A was B’s follower at any point of time or vice versa. Note that this algorithm treats the network as static rather than as dynamic. The overall influenza vaccine sentiment score is defined as the rela-tive difference of posirela-tive and negarela-tive tweets ((n+– n–)/(n++ n–+ n0)).
Figure 5.5a shows the absolute numbers of positive, negative, and neu-tral tweets per day in the United States. The overall influenza vaccine senti-ment score started at a negative value in late summer 2009, but showed large short-term fluctuations. The fourteen-day moving average turned positive in mid-October 2009 (as the vaccine became available) and remained positive for the rest of the year (see Figure 5.5b). The influenza A(H1N1) vaccination sentiment score was found positive, correlated with estimated vaccination cov-erage as provided by CDC. The authors found a very strong correlation on
the level of U.S. Department of Health and Human Services (HHS) regions (weighted r = 0.78, p = 0.017) using the estimated vaccination coverage for all persons older than six months (see Figure 5.5c), as well as a strong correlation at the state level (weighted r = 0.52, p = 0.0046).These results are important for planning public health efforts focusing on target areas for communication interventions.
5. Discussion
5.1. User Demographics
Firstly, Twitter is creating bias due to lack of representativeness of the pop-ulation demographics. Pew Research Center investigating Twitter usage in America revealed that Internet users aged eighteen to twenty-nine are signifi-cantly more likely to use Twitter than older adults and that minority (African American and Latino) Internet users are more than twice as likely to tweet as white Internet users.5 Furthermore, women (10 percent) are using the ser-vice more actively than men (7 percent). Personal information dominates
0.00 15 20 25 Sep 09 –0.2 –0.1 0.0 0.1 0 500 1000 1500 2000 Number of T w eets Sentiment Score 2500 3000 (a) (c) (b)
Oct 09 Nov 09 Dec 09 Jan 10 Sep 09 Oct 09 Nov 09 Dec 09 Jan 10
V a ccination Co ve ra g e ( in % ) 30 35 0.05 Sentiment Score 0.10 1 10 8 9 2 4 6 37 5
Figure 5.5 (a) Total number of negative (bottom region), positive (middle region), and neutral (top region) tweets relating to the influenza A(H1N1) vaccination during the fall wave of the 2009 pandemic. (b) Daily (fluctuat-ing line) and fourteen-day mov(fluctuat-ing average (thick line) sentiment scores dur-ing the same time. (c) Correlation between estimated vaccination rates for individuals older than six months and sentiment score per HHS region (dark dots) and states (light dots). Numbers represent the ten regions as defined by the U.S. Department of Human Health and Services. Lines shows best fit of linear regression (short line for regions, long line for states).
Salathé and Khandelwal (2011).
the communication (72 percent), closely followed by work communication (62 percent). The Pew Research Center also found that 31 percent of users used their mobile phones to search information about their health,6 which has almost doubled since Pew’s previous study in 2010 when it was 17 percent of users (Fox, 2009). Relying on the dramatic increase of Twitter usage globally, demo-graphic bias is unlikely to be a major issue for Twitter research in the future; however, in comparison with the randomized control trials (RCT) widely used for epidemiological studies, the digital divide bias needs to be considered when Twitter dataset results are to be generalized.
5.2. Location Awareness
Further, location awareness remains an issue; reliance on profile variables is introducing an inevitable bias, while the availability of GPS coordinates of tweets, providing the desirable accuracy and location awareness, is still in a far future from a global user’s perspective. Other methods for determining user location beyond GPS are discussed in Chapter 1.
5.3. Integration of Multiple Data Sources
Barboza et al. (2013) compared operational early warning systems on a detec-tion of A/H5N1 influenza events. They highlighted the need for “more efficient synergies and cross-fertilization of knowledge and information” (Barboza et al., 2013, p. 8). A roadmap for digital disease surveillance that incorporated new data sources was also outlined (Kostkova, 2013) and identified six types of data sources:
r News/online media (including automated scanning systems such as MediSys (Linge et al., 2009)
r Digital traces (such as the online keyword searches researched by Ginsberg et al. [2008] and Wiseman et al. [2010])
r Pro-Med (a professional mailing list for communicable diseases7)
r Labs/clinical reports
r Participatory systems (such as the multilingual EpiWorks project Influenzanet8 and the UK portal Flusurvey9)
r Twitter/social media 6 h t t p : / / m h e a l t h w a t c h . c o m / i n f o g r a p h i c - h o w - a r e - m e d i c a l - p r o f e s s i o n a l s - u s ing-social-media-20981/. 7 http://www.promedmail.org/. 8 http://www.influenzanet.eu/. 9 http://flusurvey.org.uk/.
Integration efforts combining all social media, participatory systems, and traditional surveillance to enhance the early warning capacity and rapid response by public health agencies are under way under the medi+board
framework dashboard (Kostkova et al., 2014a, 2014b), but these efforts will require further research, health stakeholder engagement, and political will.
Twitter inevitably has the potential to spread evidence-based information quickly. However, how to use this potential effectively in public health emer-gencies to best protect the public from relying on distorted and panic-raising coverage remains a challenge.
5.4. Twitter – Personalized Health Information and Privacy
Undoubtedly, Twitter has huge potential to deliver personalized targeted information to users where and when they need it. Even better, using geo-tagging, it can direct those in need to local healthcare services and profes-sional health advice in their vicinity. This opportunity brings major ethical challenges for privacy and personal data usage that have not been widely researched yet.
This closely relates to user privacy – while Twitter users agree to sharing their information in the public domain, which enables an unprecedented amount of research data to be available for research, not all users seem fully aware of this fact. Further, it goes without saying that Twitter is not the most appropri-ate media for sharing sensitive personal health information nor for providing personalized advice. Striking the right balance between user privacy and health advice opportunities is an ongoing challenge. While there are public reserva-tions about governments’ attempts to share electronic patients records (EPR) for research benefits and/or commercial needs (for example, the controversial Care.Data initiative in the UK in 2014), the popularity of Medtech wearable and tracking devices resulted in users being increasingly willing to give up their pri-vate personal health data (often with GPS location coordinates) to the industry without any control of the usage, sharing, or even sale. These ethical challenges require further open debate with all major stakeholders, including users, citi-zens, healthcare providers, governments, researchers, IT, and Medtech industry to ensure that the right balance is agreed upon and enforced.
References
Aral, Muchnik L. and Sundararajan, A. (2009). Distinguishing influence-based con-tagion from homophily-driven diffusion in dynamic networks. Proceedings of National Academy of Science USA, 106, 21544–9.
Ash, C. (2010). Summun bonum. Science Translations Medicine, 2, 61ed8.
Balcan, D., Hu, H., Goncalves, B., Bajardi, P., Poletto, C., Ramasco, J. J., Paolotti, D., Perra, N., Tizzoni, M., Van Den Broeck, W., Colizza, V., and Vespignani, A. (2009). Seasonal transmission potential and activity peaks of the influenza A(H1N1): a Monte Carlo likelihood analysis based on human mobility. BMC Medicine, 7, 45 doi: 10.1186/1741-7015-7-45.
Barboza, P., Vaillant, L., Mawudeku, A., Nelson, N. P., Hartley, D. M., Madoff, L. C., Linge, J. P., Collier, N., Brownstein, J. S., Yangarber, R., and Astagneu, P. (2013). Evaluation of epidemic intelligence systems integrated in the earl alert in and reporting project of the detection of A/H5N1 influenza events. PLOS One, 8(3), e57272.
Centers for Disease Control and Prevention (CDC). (1999). Ten great public health achievements – United States. 1900–1999. MMWR Morbidity Mortality Weekly Report, 48, 241–3.
Cha, M., Haddadi, H., Benevenuto, F. and Gummadi, K. P. (2010). Measuring user influ-ence in Twitter: the million follower fallacy. In Proceedings of the International AAAI Conference on Weblogs and Social Media (ICWSM), Association for the Advancement of Artificial Intelligence (www.aaai.org). http://snap.stanford.edu/ class/cs224w-readings/cha10influence.pdf
Christakis, N. A., and Fowler, J. H. (2007). The spread of obesity in a large social net-work over 32 years. New England Journal of Medicine, 357, 370–9.
Christakis, N. A, and Fowler, J. H. (2008). The collective dynamics of smoking in a large scale social network. New England Journal of Medicine, 358, 2249–58. Culotta, A. (2010.) Towards detecting influenza epidemics by analyzing Twitter
mes-sages. In ACM, Proceedings of the SOMA ’ 10 (pp. 115–22). ACM.
de Quincey, Ed, and Kostkova, Patty. (2010.) Early warning and outbreak detec-tion using social networking websites: the potential of Twitter. In ehealth 2009, Springer Lecture Notes of the Institute for Computer Sciences, Social-Informatics and Telecommunications Engineering (LNICST) 27, ed. P. Kostkova (pp. 21–4). Springer Verlag.
de Quincey, E., Kyriacou, T., Williams, N., and Pantin, T. (2014). Potential of social media to determine hay fever seasons and drug efficacy. Planet@Risk 2(4, Special Issue on One Health): 293–7.
Duncan, B. (2009). How the media reported the first day of the pandemic H1N1 2009: results of EU-wide media analysis. Eurosurveillance, 14(30): 1–3. http:// www.eurosurveillance.org/images/dynamic/EE/V14N30/art19286.pdf.
Fox, S. (2009). The social life of health information. Available at http://www .pewinternet.org/Reports/2009/8-The-Social-Life-of-Health-Information/1 4-About-Us-Methodology.aspx?view=all.
Ginsberg, J., Mohebbi, M. H., Patel, R. S., Brammer, L., Smolinski, M. S., and Brilliant, L. (2008). Detecting influenza epidemics using search engine query data. Nature, 457, 10.1038/nature07634.
Golder, Scott A., et al. (2011). Diurnal and seasonal mood vary with work, sleep, and daylength across different cultures. Science, 333, 1878; DOI: 10.1126/ science.1202775.
Gomide, J., Veloso, A., Meira, W., Jr., Almeida, V., Benevenuto, F., Ferraz, F., and Teixeira, M. (2011.) Dengue surveillance based on a computational model of spatio-temporal locality of Twitter. In ACM, Web Science 2011 (pp. 1–8). ACM.
Gesualdo, F. Stilo, G., Agricola, E., Gonfiantini, M. V., Pandolfi, E., Velardi, P., and Tozzi, A. E. (2014). Influenza-like illness surveillance on Twitter through auto-mated learning of naive language. PLOS One, 8(12), e82489.
Hay, S. I., George, D. B., Moyer, C. L., and Brownstein, J. S. (2013). Big data opportunities for global infectious disease surveillance. PLOS Medicine, 10(4), e1001413.
Jansen, V. A. A., et al. (2003). Measles outbreaks in a population with declining vaccine update. Science, 301, 804.
Jutel, A., Baker, M. G., Stanley, J., Huang, Q. S., and Bandaranayake, D. (2011). Self-diagnosis of influenza during a pandemic: a cross-sectional survey. BMJ Open, 1:e000234. dio:10.1136/bjmopen-2011-000234.
Kaiser, R., and Coulombier, D. (2006). Different approaches to gathering epidemic intelligence in Europe. Eurosurveillance, 11(17), pii=2948.
Kaiser, R. Coulombier, D., Maldari, M., Morgan, D., and Paquet, C. (2006). What is epidemic intelligence, and how it is being improved in Europe? Eurosureillance, 11(2), 060202.
Kostkova, P. A roadmap to integrated digital public health surveillance: the vision and the challenges. In Proceedings of the 22nd International Conference on World Wide Web Companion(WWW ‘13 Companion) (pp. 687–94). International World Wide Web Conferences Steering Committee.
Kostkova, P., Garbin, S., Moser, J., and Pan, W. (2014a) Integration and visualiza-tion public health dashboard: the medi+board pilot project. In Proceedings of the Companion Publication of the 23rd International Conference on World Wide Web Companion(WWW Companion ‘14). doi=10.1145/2567948.2579276. International World Wide Web Conferences Steering Committee.
Kostkova, P. (2014b) Medi+ board: the Public Health Dashboard. Medicine 2.0 Conference 2014, October 2014, JMIR Publications Inc. Canada.
Kostkova, P., Szomszor, M., and St Luis, C. (2014). #swineflu: the use of Twitter as an early warning and risk communication tool in the 2009 swine flu pandemic. ACM Transactions on Management Information Systems, 5(2), Article 8.
Kostkova, P. (forthcoming). Grand Challenges in Digital Health. Frontiers in Public Health: Digital Health. Frontiers.
Kwak, H., Lee, C., Park, H., and Moon, S. (2010.) “What is Twitter, a social network or a news media?” In Proceedings of the 19th International Conference on World Wide Web (WWW2010) (pp. 591–600). ACM.
Lampos, V., and Cristianini, N. (2010.) “Tracking the flu pandemic by monitoring the social web.” In Proceedings of the 2nd IAPR Workshop on Cognitive Information Processing (CIP2010) (pp. 411–16). IEEE Press.
Lampos, V., and Cristianini, N. (2012). Nowcasting events from the social web with statistical learning. ACM TISM, 3(4), Article 72.
Lampos, V., de Bie, T., and Cristianini, N. (2010). “Flu detector – tracking epidemics on Twitter.” In Proceedings of the European Conference on Machine Learning and Principles and Practice of Knowledge Discovery in Databases (ECML PKDD 2010) (pp. 599–602). Springer.
Linge, J. P, Steinberger, R., Weber, T. P., Yangarber, R., van der Goot, E., Al Khudhairy, D. H., and Stilianakis, N. I. (2009). Internet surveillance systems for early alerting of health threats. EuroSurveillance, 14(13), pii=1916.
Malik. S. (2011.) Which idea is likely to make the biggest impact on healthcare by 2020? BMJ, 342: d1998 doi: 10.1136/bmj.d1998.
Paquet C., Coulombier, D., Kaiser, R., and Ciotti, M. (2006). Epidemic intelligence: a new framework for strengthening disease surveillance in Europe. Eurosurveillance
11(12), p=665.
Paul, M. J., and Dredze, M. (2011). You and what you tweet: analyzing Twitter or pub-lic health. In The Proceedings of the 5th AAAI Conference on Weblogs and Social Media. (pp. 265–72). AAAI.
Sadilek, A., and Kautz, H. (2013). Modeling the impact of lifestyle on health at scale. In Sixth ACM International Conference on Web Search and Data Mining (WSDM)
(pp. 637–46). ACM.
Salathé, M., et al. (2008). The effect of opinion clustering on disease outbreaks. Journal of Royal Society Interface, 5, 1505–8.
Salathé, M., Bengtsson, L., Bodnar, T. J., Brewer, D. D., Brownstein, J. S., Buckee, C., Campbell, E. M. Cattuto, C., Khandelwal, S., Mabry, P. L., and Vespignani, A. (2012). Digital epidemiology. PLoS Computational Biology, 8(7), e1002616. dio:10.1371/journal.pcbi.1002616.
Salathé, M., Duy, Q. V., Shashank, K., and Hunter, D. R. (2013). The dynamics of health behaviour sentiments on a large online social network. EPJ Data Science, 2, 4. Salathé, M., Freifeld, C. C., Mekaru, S. R., Tomasulo, A. F., and Brownstein, J. S.
(2013). Influenza A (H7N9) and the importance of digital epidemiology. New England Journal of Medicine (July 3), nwjm.org.
Salathé, M., and Khandelwal, S. (2011). Assessing vaccination sentiments with online social media: implications for infectious disease dynamics and control. PLOS Computational Biology, 7(10), e1002199.
Savage, N.. (2011). Twitter as medium and message. Communications of the ACM, 54(3), 8–20.
Scanfeld, D., Scanfeld, V., and Larson, E. L. (2010). Dissemination of health informa-tion through social networks: Twitter and antibiotics. AJIC: American Journal of Infection Control, 3(8), 182–8.
Shalizi, C. R., and Thomas, A. C. (2011). Homophily and contagion are generically confounded in observational social network studies. Sociology Methods Research, 40, 211–39.
Signorini, A., Segre, A. M., and Polgreen, P. M. (2011). The use of Twitter to track levels of disease activity and public health concern in the U.S. during the influenza A H1N1 pandemic. POS One, 6(5), e19467, doi: 10.1371/journal.pone.0019467. Smith, K. P., and Christakis, N. A. (2008). Social networks and health. Annual Review
of Sociology, 34, 405–29.
St. Louis, C., and Zorlu, G. (2012). Can Twitter predict disease outbreaks? BMJ, 344, e2353. Available online at http://www.bmj.com/content/344/bmj.e2353.
Szomszor, M., Kostkova, P., and de Quincey, E. (2011). #swineflu: Twitter predicts swine flu outbreak in 2009. In ehealth 2010, Springer Lecture Notes of the Institute for Computer Sciences, Social-Informatics and Telecommunications Engineering (LNICST) 69, eds. M. Szomszor and P. Kostkova (pp. 18–26). Springer.
Szomszor, M., Kostkova, P., and St. Louis, C. (2011). Twitter informatics: tracking and understanding public reaction during the 2009 swine flu pandemics. In IEEE/
WIC/ACM International Conferences on Web Intelligence and Intelligent Agent Technology, WI-IAT, vol. 1 (pp. 320–3). IEEE.
Takahashi, T., Abe, S., and Igata, N. (2011). Can Twitter be an alternative of real-world sensors? Lecture Notes in Computer Science, 6763, 240–9.
Valente, T. W. (2010). Social Networks and Health. Oxford University Press.
Walter, D., Bohmer, M. M., Reiter, S., Krause, G., and Wichmann, O. (2012). Risk perception and information-seeking behaviour during the 2009–10 influenza A (H1N1) PDM09 pandemic in Germany. Eurosurveillance, 7(13), 1–8.
Kostkova, P. Fowler, D., Wiseman, S., and Weinberg, J. R. (2013). Major infection events over 5 years: how is media coverage influencing online information needs of health care professionals and the public? Journal of Medical Internet Research (JMIR), 15(7), e107 doi:10.2196/jmir.2146.
Wiseman, S., Kostkova, P., de Quincey, E., and Jawaheer, G. (2010). Providing guid-ance during the swine flu outbreak in 2009: an evaluation study of the National Resource for Infection Control (NRIC). Poster and abstract in TheProceedings of the 14th International Conference on Infectious Diseases (ICID) (p. e105). Elsevier.