POLITECNICO DI TORINO
Repository ISTITUZIONALE
Distributed services across the network from edge to core / Sapio, Amedeo. - (2018 May 14). Original
Distributed services across the network from edge to core
Publisher: Published DOI:10.6092/polito/porto/2706995 Terms of use: openAccess Publisher copyright
(Article begins on next page)
This article is made available under terms and conditions as specified in the corresponding bibliographic description in the repository
Availability:
This version is available at: 11583/2706995 since: 2018-05-15T15:20:54Z Politecnico di Torino
Distributed services across the
network from edge to core
By
Amedeo Sapio
******
Supervisor(s):
Prof. Mario Baldi
Doctoral Examination Committee:
Prof. Mario Nemirovsky, Referee, Barcelona Supercomputing Center Dr. Domenico Siracusa, Referee, Create-Net
Prof. Enzo Mingozzi, Università di Pisa
Prof. Lorenzo De Carli, Colorado State University Prof. Fulvio Risso, Politecnico di Torino
Politecnico di Torino 2018
Declaration
I hereby declare that, the contents and organization of this dissertation constitute my own original work and does not compromise in any way the rights of third parties, including those relating to the security of personal data.
Amedeo Sapio 2018
* This dissertation is presented in partial fulfillment of the requirements forPh.D. degreein the Graduate School of Politecnico di Torino (ScuDo).
Abstract
The current internet architecture is evolving from a simple carrier of bits to a platform able to provide multiple complex services running across the entire Network Service Provider (NSP) infrastructure. This calls for increased flexibility in resource manage-ment and allocation to provide dedicated, on-demand network services, leveraging a distributed infrastructure consisting of heterogeneous devices. More specifically, NSPs rely on a plethora of low-cost Customer Premise Equipment (CPE), as well as more powerful appliances at the edge of the network and in dedicated data-centers. Currently a great research effort is spent to provide this flexibility through Fog computing, Network Functions Virtualization (NFV), and data plane programmabil-ity. Fog computing or Edge computing extends the compute and storage capabilities to the edge of the network, closer to the rapidly growing number of connected devices and applications that consume cloud services and generate massive amounts of data. A complementary technology is NFV, a network architecture concept targeting the execution of software Network Functions (NFs) in isolated Virtual Machines (VMs), potentially sharing a pool of general-purpose hosts, rather than running on dedicated hardware (i.e., appliances). Such a solution enables virtual network appliances (i.e., VMs executing network functions) to be provisioned, allocated a different amount of resources, and possibly moved across data centers in little time, which is key in ensuring that the network can keep up with the flexibility in the provisioning and deployment of virtual hosts in today’s virtualized data centers. Moreover, recent advances in networking hardware have introduced new programmable network de-vices that can efficiently execute complex operations at line rate. As a result, NFs can be (partially or entirely) folded into the network, speeding up the execution of distributed services.
The work described in this Ph.D. thesis aims at showing how various network services can be deployed throughout the NSP infrastructure, accommodating to the
deployment of (virtualized) NFs. In this scenario, we introduce a novel methodology for the modelization of different NFs aimed at estimating their performance on different execution platforms. Moreover, we propose to extend the traditional NFV deployment outside of the data center to leverage the entire NSP infrastructure. This can be achieved by integrating native NFs, commonly available in low-cost CPEs, with an existing NFV framework. This facilitates the provision of services that require NFs close to the end user (e.g., IPsec terminator). On the other hand, resource-hungry virtualized NFs are run in the NSP data center, where they can take advantage of the superior computing and storage capabilities.
As an application, we also present a novel technique to deploy a distributed service, specifically a web filter, to leverage both the low latency of a CPE and the computational power of a data center. We then show that also the core network, today dedicated solely to packet routing, can be exploited to provide useful services. In particular, we propose a novel method to provide distributed network services in core network devices by means of task distribution and a seamless coordination among the peers involved. The aim is to transform existing network nodes (e.g., routers, switches, access points) into a highly distributed data acquisition and processing platform, which will significantly reduce the storage requirements at the Network Operations Center and the packet duplication overhead.
Finally, we propose to use new programmable network devices in data center networks to provide much needed services to distributed applications. By offloading part of the computation directly to the networking hardware, we show that it is possible to reduce both the network traffic and the overall job completion time.
Contents
List of Figures x
List of Tables xiii
Nomenclature xiv
1 Introduction 1
2 Network Function Modeling and Performance Estimation 6
2.1 Introduction . . . 6
2.2 Methodology . . . 8
2.2.1 Elementary Operations . . . 10
2.2.2 Mapping to Hardware . . . 12
2.3 Modeling Use Cases . . . 18
2.3.1 L2 Switch . . . 18
2.3.2 Broadband Network Gateway . . . 22
2.4 Experimental validation . . . 25
2.4.1 L2 Switch . . . 25
2.4.2 Broadband Network Gateway . . . 30
2.4.3 Concluding Remarks . . . 32
2.6 Conclusions and future work . . . 35
3 Enabling NFV Services on Resource-Constrained CPEs 37 3.1 Introduction . . . 37 3.2 Related Work . . . 39 3.3 Background . . . 40 3.3.1 Network abstraction . . . 42 3.3.2 Compute abstraction . . . 42 3.3.3 Northbound interface . . . 44
3.4 Native Network Functions . . . 44
3.4.1 NNF model and VNF template . . . 45
3.4.2 The native compute driver . . . 45
3.4.3 I/O model . . . 46 3.4.4 Isolation model . . . 47 3.4.5 Multitenancy . . . 47 3.4.6 Security considerations . . . 48 3.5 Validation . . . 49 3.6 Conclusions . . . 52
4 Enforcement of Dynamic HTTP Policies on Residential Gateways 54 4.1 Introduction . . . 54
4.2 Architecture and implementation . . . 56
4.2.1 Operating principles . . . 56
4.2.2 Architecture overview and design principles . . . 57
4.2.3 Netfilter . . . 60
4.2.4 Key data structures . . . 62
Contents
4.2.6 Offline module . . . 67
4.2.7 Communication with the policy server . . . 69
4.3 Discussion . . . 70 4.3.1 General limitations . . . 70 4.3.2 HTTPS . . . 71 4.3.3 Delay characterization . . . 72 4.4 Experimental validation . . . 74 4.4.1 Testbed setup . . . 74 4.4.2 Interaction with TCP . . . 76 4.4.3 Browsing experience . . . 78
4.4.4 Residential gateway aggregated throughput . . . 83
4.4.5 Memory footprint . . . 85
4.5 Related work . . . 86
4.6 Conclusions . . . 88
5 Packet processing in the core: a Massively Distributed Network Data Caching Platform 90 5.1 Introduction . . . 90
5.2 MEDINADesign . . . 93
5.2.1 Deployment model . . . 94
5.2.2 Hash-based coordinated packet selection . . . 95
5.2.3 Traffic assignment granularity . . . 98
5.2.4 Path discovery . . . 98
5.2.5 Data storage . . . 101
5.2.6 Resource allocation . . . 101
5.2.7 Online fine-tuning . . . 102
5.4 Related Work . . . 105
5.5 Conclusions and future work . . . 108
6 In-network computation with programmable data plane 109 6.1 Introduction . . . 109
6.2 Background . . . 112
6.2.1 P4 Programming Language . . . 113
6.3 Judicious Network Computing . . . 114
6.4 Data Aggregation in Data Center Applications . . . 116
6.5 Solution sketch . . . 118 6.6 Preliminary Evaluation . . . 122 6.7 Related Work . . . 124 6.8 Conclusions . . . 126 7 Conclusions 128 References 130
List of Figures
1.1 Telecom operator infrastructure. . . 2
2.1 NF modeling and performance estimation approach. . . 9
2.2 Hardware architecture description. . . 12
2.3 Sample Intel x86 assembly code for checksum computation. . . 14
2.4 Hash table lookup pseudo-code. . . 16
2.5 Entry update pseudo-code for cache table insertion. . . 17
2.6 Models of different L2 switches. . . 20
2.7 Packet formats. . . 23
2.8 BNG model. . . 24
2.9 L2 Switch testbed setup. . . 26
2.10 Basic forwarding performance. . . 27
2.11 Learning switch performance. . . 28
2.12 MPLS switch performance. . . 30
2.13 Broadband Network Gateway performance. . . 31
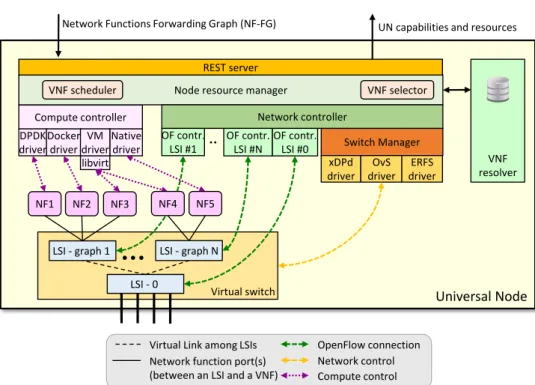
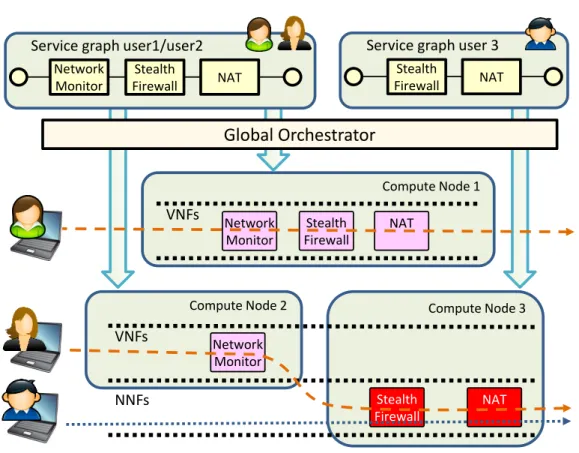
3.1 Architecture of the Universal Node. . . 40
3.2 Service instantiation of a graph. . . 41
3.3 Excerpt of the template of a firewall NNF. . . 46
4.1 U-Filter workflow. . . 57
4.2 U-Filter architecture. . . 58
4.3 netfilterhooks chain and U-Filter. . . 61
4.4 HTTP session table, shared between online and offline modules. . . 62
4.5 URL queue, shared between the online module and the offline mod-ule user space process. . . 63
4.6 Verdict queue, shared between the offline module kernel thread and user space process. . . 63
4.7 Summarized workflow of the online module. . . 65
4.8 Offline module user space process. . . 67
4.9 Summarized workflow of the offline module kernel thread. . . 68
4.10 Delay characterization. . . 73
4.11 Testbed setup. . . 75
4.12 Progress of a TCP session. . . 77
4.13 Waiting time for a single HTTP resource - Cumulative distribution function. . . 80
4.14 Resource waiting time considering the 90thpercentile of the process-ing time and RTT with the policy server in a data center. . . 81
4.15 Complete page loading time cumulative distribution. . . 82
4.16 Complete page loading time considering the 90thpercentile policy server processing time with the policy server in a data center. . . 83
4.17 Application-level throughput when downloading files of different sizes. . . 84
4.18 Download time when requesting files of different sizes. . . 84
4.19 U-Filter load. . . 86
5.1 MEDINAoverlay. . . 94
List of Figures
5.4 Per node used storage. . . 104 5.5 Per node captured and forwarded traffic. . . 105
6.1 Potential traffic reduction ratio for two machine learning applications and various graph analytics algorithms. . . 117 6.2 Aggregation Trees: example of physical and logical view for traffic
aggregation in a data center network. . . 119 6.3 Reduction on the amount of data, running time and number of
2.1 List of sample EOs . . . 10
3.1 Network abstraction in the UN . . . 43
3.2 Compute abstraction in the UN . . . 43
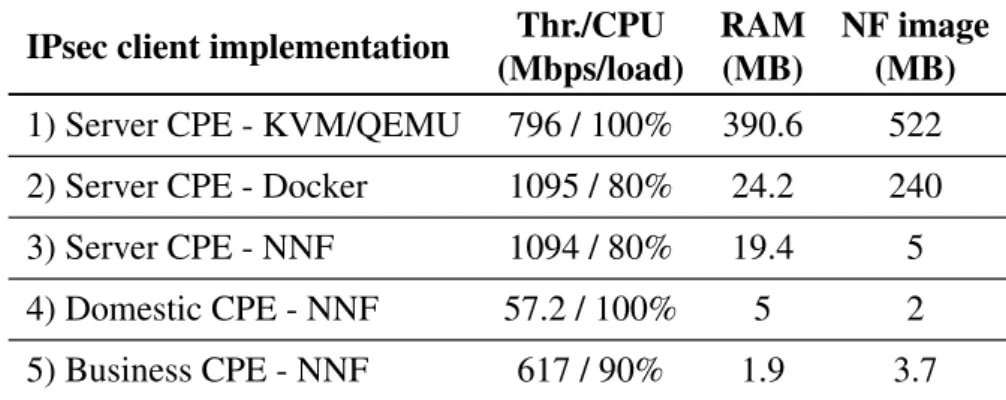
3.3 Characteristics of the devices used in the validation . . . 50
3.4 Comparing different implementations of the IPSec client, on differ-ent machines . . . 51
4.1 Inferred RTT values with the policy server in different locations (RT TP). . . 79
Nomenclature
Acronyms / Abbreviations
ACK Acknowledgment Number
ALU Arithmetic Logic Unit
ASIC Application-Specific Integrated Circuit
BNG Broadband Network Gateway
BSP Bulk Synchronous Parallel
CAS Column Access Strobe
CGNAT Carrier-Grade Network Address Translation
CPE Customer Premise Equipment
DAIET Data Aggregation In nETwork
DAT S Intel Dataplane Automated Testing System
DC Data Center
DDIO Intel Data Direct I/O Technology
DDR Double Data Rate
DPDK Intel Data Plane Development Kit
DPI Deep Packet Inspection
DSL Digital Subscriber Line
EO Elementary Operation
ET SI European Telecommunications Standards Institute
FCS Frame Check Sequence
GPGPU General-Purpose computing on Graphics Processing Units
GRE Generic Routing Encapsulation
IE−pair Ingress-Egress pair
IID Ingress ID
IoT Internet of Things
ISP Internet Service Provider
IX P Internet eXchange Point
LAN Local Area Network
LSI Logical Switching Instance
MEDINA Massively Distributed Network Data Caching Platform
ML Machine Learning
MPI Message Passing Interface
MPLS MultiProtocol Label Switching
MSS Maximum Segment Size
NAT Network Address Translation
NF Network Functions
NFV Network Functions Virtualization
Nomenclature
NHLFE Next Hop Label Forwarding Entry
NIC Network Interface Card
NNF Native Network Functions
NSP Network Service Providers
OvS Open vSwitch
POP Point Of Presence
PROX Intel Packet pROcessing eXecution Engine
RMT Reconfigurable Match Tables
RT T Round Trip Time
SACK TCP Selective Acknowledgment
SDN Software Defined Networking
SEQ Sequence Number
SGD Stochastic Gradient Descent
SRAM Static Random Access Memory
SSSP Single Source Shortest Path
TC Linux Traffic Control
TCAM Ternary Content-Addressable Memory
ToR Top-of-Rack
T T L Time To Live
U I User Interface
U N Universal Node
U RL Universal Resource Locator
V LAN Virtual Local Area Network
V M Virtual Machine
V NF Virtualized Network Function
WAN Wide Area Network
Chapter 1
Introduction
Modern telecom companies are no longer simple providers of telephone/internet connectivity. In fact, they are increasingly relying on selling value-added services to boost their revenues. Connectivity plans are often bundled with music and video streaming [1–3], safe-browsing, anti-malware and parental control [4] services that, when coupled with zero-rating [5, 6], can be especially appealing to customers.
On the other hand, the recent trend of network “softwarization” is paving the way to commoditization of telecommunications infrastructure. In fact, today many of the fixed-function middleboxes can be replaced by software network functions, poten-tially sharing a pool of general-purpose hosts, providing more flexibility, simpler management and configuration, and lower time to market for new functionalities. This transition is spearheaded by the NFV technology that proposes the execution of software network functions in isolated VMs rather than on dedicated hardware. By using SDN, network traffic can be steered through a chain of Virtualized Net-work Functions (VNFs) in order to provide aggregated services. NetNet-work Service Providers (NSPs) can leverage this flexibility to easily deploy new, on-demand, services for both their internal use (e.g., monitoring) and their customers (e.g., web cache).
Currently, NSPs rely on a heterogeneous infrastructure composed of high speed networking appliances (e.g., routers), a large amount of low-cost, resource-limited Customer Premise Equipment (CPE), as well as more powerful appliances at the edge of the network and in dedicated data-centers, as showed in Figure 1.1. In
DATA CENTER CORE NETWORK CPE ACCESS NETWORK RADIO ACCESS NETWORK
Fig. 1.1 Telecom operator infrastructure.
this dissertation, we show how all these different domains can be used to provide additional services suited to their specific constraints and limitations.
First, chapter 2 introduces a methodology for the modelization of network func-tions (NFs) focused on the identification of recurring execution patterns as basic building blocks and aimed at providing a platform independent representation. By mapping each modeling building block on specific hardware, the performance of the network function can be estimated in terms of maximum throughput that the network function can achieve on the specific execution platform. The approach is such that once the basic modeling building blocks have been mapped, the estimate can be computed automatically for any modeled network function. Experimental results on several sample network functions show that although our approach cannot be very accurate without taking in consideration traffic characteristics, it is very valuable for those application where even loose estimates are key. One such example is orchestration in NFV platforms, as well as in general virtualization platforms where virtual machine placement is based also on the performance of network services offered to them. Being able to automatically estimate the performance of a VNF on different execution hardware, enables optimal placement of VNFs themselves as well as the virtual hosts they serve, while efficiently utilizing available resources.
While chapter 2 describes a unified modeling approach for generic NFs, in chapter 3 we focus on software NFs running in a virtualized environment. These are often implemented using VMs because they provide an isolated environment compatible with classical cloud computing technologies. This isolation is required to leverage consolidation in a data center and comes at a substantial cost in terms
of required resources. We propose to extend the NFV infrastructure to support the deployment of services closer to the end user, using resource-constrained devices such as residential CPEs. This solution is especially beneficial for low-latency services. However, these devices cannot provide the large amount of resources required for deploying standard VMs. Nevertheless, such hardware often runs a Linux-based operating system that supports several software modules (e.g., iptables) that can be used to implement network functions (e.g., a firewall), which can be exploited to provide some of the services offered by simple VNFs, with reduced overhead. We also propose and validate an architecture that integrates those native software components in a NFV platform, making their use transparent from the user’s point of view. This integration allows to jointly orchestrate simple NFs executed in the CPE with low hardware resources and complex VNFs running in the data center, hence combining the benefits of the cloud with the locality of the services running on local CPEs.
An instance of service that can be decomposed in a lightweight component running on residential gateways and a resource intensive task running in the data center is presented in detail in chapter 4. Given that nowadays users access content mostly through mobile apps and web services, both based on HTTP, several filtering applications, such as parental control, malware detection, and corporate policy enforcement, require inspecting Universal Resource Locators (URLs) contained in HTTP requests. Currently, such filtering is most commonly performed in end devices or in middleboxes. Filtering applications running on end devices are less resource intensive because they operate only on traffic from a single user and possibly leverage a hook at the HTTP level to access protocol data, but it is left to the user whether to execute them. On the other hand, middleboxes present the challenge of ensuring that they lay on the path of all the traffic from any relevant device. Residential gateways seem to be the ideal place where to implement traffic filtering because they forward all traffic generated by the hosts on home(-office) networks. However, these devices usually have very limited computation and memory resources, while URL-based filtering is quite demanding. In fact existing approaches rely on a large database of rules coupled with either deep packet inspection or transparent proxying for URL extraction. In chapter 4 we present U-Filter, a URL filtering solution based on a distributed architecture where a lightweight, efficient URL extraction and policy enforcement component runs on residential gateways, delegating to a remote policy server the resource intensive task of verifying policy compliance.
Thanks to the lightweight communication between the two components and the very limited resource requirements of the local module, U-Filter (i) can be deployed on resource-limited devices such as residential gateways, and (ii) has almost no impact on the performance of the device, as well as on the users’ browsing experience, as demonstrated by the presented experiments.
Traffic analysis and monitoring is of paramount importance also in the access and core network devices. While the main limitation of residential gateways is their limited hardware capability, in these devices the main challenge is given by the massive amount of data that they must forward at high speed. The analysis of this large traffic is key to many domains including network management, security, network forensics. Traditionally, it is performed by a NF, running on a dedicated device, accessing traffic at a specific point within the network through a link tap or a port of a node mirroring packets. This approach is problematic because the dedicated device must be equipped with a large amount of computation and storage resources to cope with the task. Alternatively, in order to achieve scalability, analysis can be performed by multiple NF instances running in a cluster of hosts. However this is normally located at a remote location with respect to the observation point, hence requiring to move across the network a large volume of captured traffic. To address this problem we present an algorithm to distribute the task of capturing, processing and storing packets traversing a network across multiple packet forwarding nodes (e.g., IP routers).
Essentially, our solution, presented in chapter 5, allows individual nodes on the path of a flow to operate on subsets of packets of that flow in a completely distributed and decentralized manner. The solution is based on having each node traversed by a traffic flow act on a subset of the packets of the flow. The proposed algorithm allows nodes to independently agree on which one is capturing which packets in a way that ensures that each packet is captured by at leastnnodes, wherenis a parameter of the algorithm, which can be set to 1 to minimize overhead or to a higher value to achieve redundancy. Nodes temporarily store the fraction of packets allocated to them and create a distributed index that enables efficient retrieval of packets (e.g., for forensics applications). With minimal changes to the implementation, the basic principles of the presented solution can be applied to the distributed execution of generic tasks on data flowing through a network of nodes with processing and storage capabilities. This has applications in various fields ranging from Fog Computing, to microservice
Finally, we present an initial proposal to leverage the high speed data center network fabric to provide services to speed up distributed applications. The advent of flexible networking hardware and expressive data plane programming languages have produced networks that are deeply programmable. By delegating part of the computation to the networking hardware, distributed data center applications can not only reduce the computation done by the CPU, but also reduce the traffic at each network device, effectively decreasing job completion times. However, it is not clear yet what kinds of computation should be delegated to the network. In chapter 6 we discuss the opportunities and challenges for co-designing data center distributed systems with their network layer. We argue that in-network computation tasks must be judiciously crafted to match the limitations of the network machine architecture of programmable devices. With the help of our experiments on machine learning and graph analytics workloads, we identify that aggregation functions raise opportunities to exploit the limited computation power of networking hardware to lessen network congestion and improve the overall application performance. Moreover, as a proof-of-concept, we propose DAIET, a system that performs in-network data aggregation. In fact, many scalable data center applications follow a partition-aggregate pattern where data and computations are distributed among many servers and their partial results are exchanged over the network and aggregated to produce the final output. For these workloads, the network communication costs are often one of the dominant scalability bottlenecks. Experimental results with an initial prototype show a large data reduction ratio (86.9%-89.3%) and a similar decrease in the workers’ computation time without requiring severe application-level modifications.
Modern networks are becoming smarter through a combination of new hardware and a higher level of programmability. This thesis aims at showing how the entire network infrastructure, from the home network to the data center network, can provide additional services tailored to the specific capabilities and requirements of different domains.
Network Function Modeling and
Performance Estimation
2.1
Introduction
For a few years now software network appliances have been increasingly deployed. Initially, their appeal stemmed from their lower cost, shorter time-to-market, ease of upgrade when compared to purposely designed hardware devices. These features are particularly advantageous in the case of appliances, a.k.a. middleboxes, operating on relatively recent, higher layer protocols that are usually more complex and are possibly still evolving. More recently, with the overwhelming success and diffusion of cloud computing and virtualization, software appliances became natural means to ensure that network functionalities have the same flexibility and mobility as the virtual machines (VMs) they offer services to. In this context, implementing in software even less complex, more stable network functionalities is valuable. This trend led to embracingSoftware Defined Networking(SDN) andNetwork Functions Virtualization(NFV). The former as a hybrid hardware/software approach to ensure high performance for lower layer packet forwarding, while retaining a high degree of flexibility and programmability. The latter as a virtualization solution targeting the execution of software network functions in isolated VMs sharing a pool of hosts, rather than on dedicated hardware (i.e., appliances). Such a solution enables virtual network appliances (i.e., VMs executing network functions) to be provisioned,
2.1 Introduction
allocated a different amount of resources, and possibly moved across data centers in little time, which is key in ensuring that the network can keep up with the flexibility in the provisioning and deployment of virtual hosts in today’s virtualized data centers. Additional flexibility is offered when coupling NFV with SDN as network traffic can be steered through a chain ofVirtualized Network Functions(VNFs) in order to provide aggregated services. With inputs from the industry, the NFV approach has been standardized by the European Telecommunications Standards Institute (ETSI) in 2013 [10].
The flexibility provided by NFV requires the ability to effectively assign compute nodes to VNFs and allocate the most appropriate amount of resources, such as CPU quota, RAM, virtual interfaces. In the ETSI standard the component in charge of taking such decisions is calledorchestratorand it can also dynamically modify the amount of resources assigned to a running VNF when needed. The orchestrator can also request the migration of a VNF when the current compute node executing it is no longer capable of fulfilling the VNF performance requirements. These tasks require the orchestrator to be able to estimate the performance of VNFs according to the amount of resources they can use. Such estimation must take into account the nature of the traffic manipulation performed by the VNF at hand, some specifics of its implementation, and the expected amount of traffic it operates on. A good estimation is key in ensuring higher resource usage efficiency and avoid adjustments at runtime.
This chapter proposes a unified modeling approach applicable to any VNF, independently of the platform it is running on. By mapping a VNF model on a specific hardware it is possible to predict the maximum amount of traffic that the VNF can sustain with the required performance. The proposed modeling approach relies on the identification of the most significant operations performed by the VNF on the most common packets. These operations are described in a hardware independent notation to ensure that the model is valid for any execution platform. The mapping of the model on a target hardware architecture (required in order to determine the actual performance) can be automated, hence allowing to easily apply the approach to each available hardware platform and choose the most suitable for the execution.
Even if the proposed modeling approach has been defined with NFV in mind, it can be applied to non-virtualized network functions (NFs), whether implemented in
software or hardware, provided that the implementation and characteristics of the underlying hardware are known. The availability of a unified modeling approach for VNF and NF is instrumental in the integration of middleboxes in an NFV infrastruc-ture [11], which is important in a transition phase and for specific applications where a dedicated or specialized hardware platform is necessary for a specific NF to satisfy performance requirements.
The modeling approach is introduced in Section 2.2 and is illustrated in Sec-tion 2.3 by applying it to various network funcSec-tions. In order to validate the proposed models, Section 2.4 compares the estimated performance with actual measurements of software network functions running on a general purpose hardware platform. After discussing related work in Section 2.5, Section 2.6 concludes the chapter.
2.2
Methodology
The proposed modeling approach is based on the definition of a set of processing steps, here calledElementary Operations(EOs), that are common throughout various NF implementations. This stems from the observation that, generally, most NFs perform a rather small set of operations when processing the average packet, namely, well-defined alteration of packet header fields, coupled with data structure lookups. An EO is informally defined as the longest sequence of elementary steps (e.g., CPU instructions or ASIC transactions) that is common among the processing tasks or multiple NFs. As a consequence, an EO has variable granularity ranging from a simple I/O or memory load operation, to a whole IP checksum computation. On the other hand, EOs are defined so that each can be potentially used in multiple NF models.
An NF is modeled as a sequence of EOs that represent the actions performed for the vast majority of packets. Since we are interested in performance estimation, we ignore operations that affects only a small number of packets (i.e., less the 1%), since these tasks have a negligible impact on performance, even when they are more complex and resource intensive than the most common ones. Accordingly exceptions, such as failures, configuration changes, etc., are not considered.
It is important to highlight that NF models produced with this approach are hardware independent, which ensures that they can be applied when NFs are deployed
2.2 Methodology
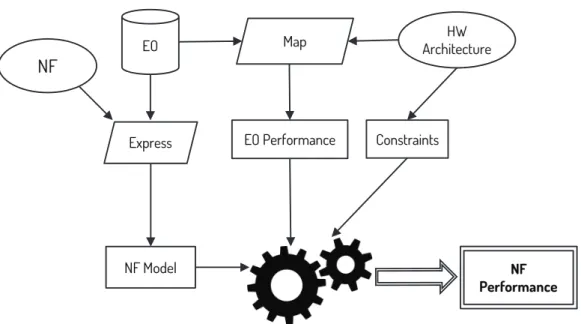
Fig. 2.1 NF modeling and performance estimation approach.
on different execution platforms. In order to estimate the performance of an NF on a specific hardware platform, each EO must bemappedon the hardware components involved in its execution and their features. This mapping allows to take into consideration the limits of the involved hardware components and gather a set of parameters that affect the performance (e.g., clock frequency). Moreover, the load incurred by each component when executing each EO must be estimated, whether through actual experiments or based on nominal hardware specifications. The data collected during such mapping are specific to EOs and the hardware platform, but not to a particular NF. Hence, they can be applied to estimate the performance of any NF modeled in terms of EOs. Specifically, the performance of each individual EO involved in the NF model is computed and composed considering the cumulative load that all EOs impose on the hardware components of the execution platform, while heeding all of the applicable constraints. Figure 2.1 summarizes the steps and intermediate outputs of the proposed approach.
Table 2.1 presents a list of sample EOs that we identified when modeling a number of NFs. Such list is by no means meant to be exhaustive; rather, it should be incrementally extended whenever it turns out that a new NF being considered cannot be described in terms of previously identified EOs. When defining an EO, it is important to identify the parameters related to traffic characteristics that significantly affect the execution and resource consumption.
Table 2.1 List of sample EOs
EO Parameters Description
1 I/O_mem hdr, data Packet copy between I/O
mem_I/O and (cache) memory 2 parse b Parse or encapsulate a data field
deparse
3 increase b Increase/decrease a field
decrease
4 sum b Sum 2 operands
5 checksum b Compute IP checksum
inc_checksum
6 array_access es, max Direct access to a byte array in memory 7 ht_lookup N, HE, max, p Simple hash table lookup
8 lpm_lookup b, es Longest prefix match lookup 9 ct_insertion N, HE, max, p Cache table insertion
2.2.1
Elementary Operations
A succinct description of the EOs listed in table 2.1 is provided below.
1. Packet copy between I/O and memory:
A packet is copied from/to an I/O buffer to/from memory or CPU cache.
hdr is the number of bytes that are preferably stored in the fastest cache memory, whiledatabytes can be kept in lower level cache or main memory. The parameters have been chosen taking into consideration that some NPUs provide a manual cache that can be explicitly loaded with the data that need fast access. General purpose CPUs may have assembler instructions (e.g.,
PREFETCHh) to explicitly influence the cache logic. 2. Parse or encapsulate a data field:
A data field ofb bytes stored in memory is parsed. A parsing operation is necessary before performing any computation on a field (it corresponds to loading a processor register). The dual operation, i.e.,deparse, implies storing
2.2 Methodology
3. Increase/decrease a field:
Increase/decrease the numerical value contained in a field ofbbytes. The field to increase/decrease must have already been parsed.
4. Sum two operands:
Two operands ofbbytes are added. 5. Compute IP checksum:
The standard IP checksum computation is performed on b bytes. When only some bytes change in the relevant data, the checksum can be computed incrementally from the previous correct value [12]. In this case, the previous value of the checksum must be parsed beforehand and b is the number of changed bytes for which the checksum must be incrementally computed. 6. Direct access to a byte array in memory:
This EO performs a direct access to an element of an array in memory using an index. Each array entry has sizees, while the array has at mostmaxentries. 7. Simple hash table lookup:
A simple lookup in a direct hash table is performed. The hash key consists of
Ncomponents and each entry has size equal toHE. The table has at mostmax
entries and the collision probability isp. 8. Longest Prefix Match lookup:
This EO selects an entry from a table based on the Longest Prefix Match (LPM). This lookup algorithm selects the most specific of the matching entries in a table (i.e., the one where the largest number of leading bits of the key match those in the table entry). The parameterb represents the number of bytes, on average, of the matching prefix, whileesis the entry size.
9. Cache table insertion: Save in a hash table an entry with the current timestamp or update the timestamp if the entry is already present. This EO have the same parameters of the simple hash table lookup operation; the performance of both EOs depends from the hash table characteristics.
For the sake of simplicity (and without affecting the validity of the approach, as shown by the results in Section 2.4), in modeling NFs by means of EOs, we assume
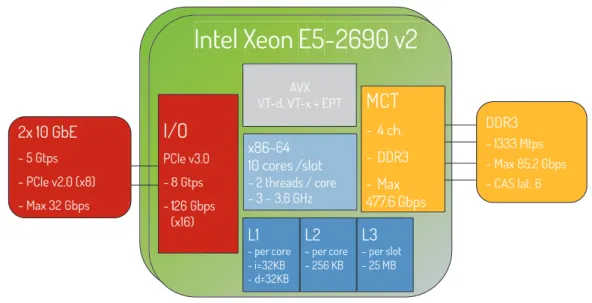
Fig. 2.2 Hardware architecture description.
that the number of processor registers is larger than the number of packet fields that must be processed simultaneously. Therefore there is no competition for processor registers.
2.2.2
Mapping to Hardware
We now proceed to map the described EOs to a specific hardware platform: a server with 2 Intel Xeon E5-2690 v2 CPUs (Ivy Bridge architecture with ten physical cores at 3 GHz), 64 GB DDR3 RAM memory and one Intel 82599ES network card with 2x10Gbps Ethernet ports. Figure 2.2 provides a schematic representation of the platform main components and relative constraints using the template proposed in [13].
Using the CPU reference manual [14], it is possible to determine the operations required for the execution of each EO in Table 2.1 and estimate the achievable performance.
1. I/O_mem(hdr, data)-mem_I/O(hdr, data)
The considered CPU provides a DMA-like mechanism to move data from the I/O buffers to the shared L3 cache and viceversa. Intel DPDK drivers [15] with Data Direct I/O Technology (DDIO) leverage this capability to move packets to/from the
2.2 Methodology
L3 cache without the CPU intervention, improving the packet processing speed. The portion of each packet that must be processed (hdr) is then moved from L3 cache into the L1/L2 cache by the CPU. This operation requires 31 clock cycles to access the L3 cache, around 5 cycles to write a L1/L2 cache line and 9 cycles to write back a L3 cache line [16]. On the whole, the execution of this EO requires:
31+ [5|9]∗ ⌈hdr
64B⌉clock cycles
provided thathdris less than the total amount of L1 and L2 caches, as it is reasonable for modern systems and common packet sizes. The multiplier is 5 forI/O_memand 9 formem_I/O.
2. parse(b) - deparse(b)
Loading a 64 bit register requires 5 clock cycles if data is in L1 cache or 12 clock cycles if data is in L2 cache, otherwise an additional L3 cache or DRAM memory access is required to retrieve a 64 byte line and store it in L1 or L2 respectively (the reverse operation has the same cost):
5∗ ⌈ b 8B⌉clock cycles{+⌈ b 64B⌉L3 or DRAM accesses} or 12∗ ⌈ b 8B⌉clock cycles{+⌈ b 64B⌉L3 or DRAM accesses} 3. increase(b) - decrease(b)
Whether a processor includes an increase (decrease) instruction or one for adding (subtract) a constant value to a 64 bit register, this EO requires 1 clock cycle to complete. However, thanks to pipelining, up to 3 independent such instructions can be executed during 1 clock cycle:
⌈0.33∗ b
Register ECX: number of bytes b Register EDX: pointer to the buffer Register EBX: checksum
CHECKSUM_LOOP:
XOR EAX, EAX ;EAX=0
MOV AX, WORD PTR [EDX] ;AX <- next word ADD EBX, EAX ;add to checksum
SUB ECX, 2 ;update number of bytes ADD EDX, 2 ;update buffer
CMP ECX, 1 ;check if ended JG CKSUM_LOOP
MOV EAX, EBX ;EAX=EBX=checksum ;EAX=checksum>>16 EAX is the carry SHR EAX, 16
AND EBX, 0xffff ;EBX=checksum&0xffff ;EAX=(checksum>>16)+(checksum&0xffff) ADD EAX, EBX
MOV EBX, EAX ;EBX=checksum SHR EBX, 16 ;EBX=checksum>>16
ADD EAX, EBX ;checksum+=(checksum>>16) MOV checksum, EAX ;checksum=EAX
Fig. 2.3 Sample Intel x86 assembly code for checksum computation.
4. sum(b)
On the considered architecture, the execution of this EO is equivalent to the EO
increase(b). Please note that this is not necessarily the case on every architecture.
5. checksum(b) - inc_checksum(b)
Figure 2.3 shows a sample assembly code to compute a checksum on an Intel x86-64 processor. Assuming that the data on which the checksum is computed is not in L1/L2 cache, according to the Intel documentation [14], the execution of this code
2.2 Methodology requires 7∗ ⌈b 2⌉+8 clock cycles +⌈ b 64B⌉L3 or DRAM accesses 6. array_access(es, max)
Direct array access needs to execute an “ADD” instruction (1 clock cycle) for comput-ing the index and a “LOAD” instruction resulting into a direct memory access and as many clock cycles as the number of CPU registers required to load the selected array element:
1+⌈es
8B⌉clock cycles +⌈ es
64B⌉DRAM accesses
7. ht_lookup(N, HE, max, p)
We assume that a simple hash table lookup is implemented according to the pseudo-code described in [13] and shown in Figure 2.4 for ease of reference.
Considering that the hash entry needs to be loaded from memory to L1 cache, a simple hash table lookup would require approximately:
⌈(4∗N+106+5∗ ⌈HE
8B⌉+5∗ ⌈ HE
32B⌉)∗(1+p)⌉
clock cycles and
⌈(⌈HE
64B⌉ ∗(1+p))⌉L3 or DRAM accesses
Otherwise, if the entry is already in the L1/L2 cache, the memory accesses and cache store operations are not required. Notice that in order for the whole table to be in cache, its size should be limited by:
Register $1-N: key components Register $HL: hash length
Register $HP: hash array pointer Register $HE: hash entry size Register $Z: result
Pseudo code:
# hash key calculation eor $tmp, $tmp
for i in 1 ... N eor $tmp, $i
# key is available in $tmp # calculate hash index from key udiv $tmp2, $tmp, $HL
mls $tmp2, $tmp2, $HL, $tmp # index is available in $tmp2 # index -> hash entry pointer mul $tmp, $tmp2, $HE
add $tmp, $HP
# entry pointer available in $tmp <prefetch entry to L1 memory> # pointer to L1 entry -> $tmp2 # hash key check (entry vs. key) for i in 1 ... N
ldr $Z, [$tmp2], #4 # check keys
cmp $i, $Z bne collision
# no jump means matching keys # pointer to data available in $Z
2.2 Methodology
Register $HE: updated hash entry
Register $HT: pointer to previous L1 entry Register $HS: hash entry size
Pseudo code: for i in 1 ... $HS/8 mov [$HT], $HE add $HT, #8 #update timestamp rdtsc mov [$HT], EDX add $HT, #2 mov [$HT], EAX
<store updated entry>
Fig. 2.5 Entry update pseudo-code for cache table insertion.
8. lpm_lookup(b,es)
There are several different algorithms for finding the longest matching rule. Here we consider theDIR-24-8algorithm [17], which in most cases (when the entry matches up to 24 bits) is able to find the first matching rule with only one memory access. This speed, however, comes at the cost of space, because of the redundant storage of rules. However, the very fast lookup this algorithm provides heavily outweighs this space constraint. With theDIR-24-8algorithm the longest prefix match requires the equivalent of anarray_access(es,16M)operation ifb≤3, otherwise an additional memory access is required, corresponding to anarray_access(es,255).
9. ct_insertion(N, HE, max, p)
The EO corresponds to a lookup in a hash table followed by either the insertion of a new entry or the update of the timestamp in an existing one. The two operations have approximately the same cost; the pseudo-code in Figure 2.5 shows the operations required to update the timestamp of the entry.
As a result the cache table insertion algorithm would require approximately:
⌈(4∗N+129+7∗ ⌈HE
8B⌉+5∗ ⌈ HE
32B⌉)∗(1+p)⌉
clock cycles and
2∗ ⌈(⌈HE
64B⌉ ∗(1+p))⌉L3 or DRAM accesses
2.3
Modeling Use Cases
This section demonstrates the application of the modeling approach described in section 2.2. EOs are used to describe the operation of simple network functions, such as L2 Switches, and a more complex case, aBroadband Network Gateway(BNG). The model is used to estimate the performance of each use case on the hardware platform presented in Section 2.2.2. The accuracy of the estimation is evaluated in Section 2.4 based on real measurements obtained through a range of experiments.
2.3.1
L2 Switch
First we model an Ethernet switch with a static forwarding table. In this case the output port is selected through a simple lookup in the table using the destination MAC address. Afterwards we consider a more general case where the forwarding table is populated using the backward learning algorithm. Finally, we model an MPLS switch, which selects the output interface according to the MPLS label in the packet.
Basic Forwarding
For each packet the switch selects the output interface where it must be forwarded; such interface is retrieved from a hash table using as a key the destination MAC address extracted from the packet.
More in detail, when a network interface receives a packet, it stores it in an I/O buffer. In order to access the Ethernet header, the CPU/NPU must first copy the packet in cache or main memory (possibly with the help of a Direct Memory Access
2.3 Modeling Use Cases
module). Since the switch operates only on the Ethernet header together with the identifier of the ingress and egress ports through which it is received and forwarded, the corresponding 30 bytes (18+6+6 bytes)1are copied in the fastest cache, while the rest of the packet (up to 1500 bytes) can be kept in L3 cache or main memory. To ensure generality, we consider that an incoming packet cannot be copied directly from an I/O buffer to another, but instead it must be first copied in (cache) memory.
The switch must then read the destination MAC address (6 bytes) prior to using it to access the hash table to get the appropriate output interface. The hash table has one key (the destination MAC) and consists of 12 byte entries composed of the key and the output interface MAC address. A common number of entries in a typical switch implementation is≈2M=2×220, which gives an idea, when mapping the model to a specific hardware, of whether the hash table can be fully stored in cache under generic traffic conditions. The new output port must be stored in the data structure in L3 cache or main memory (which, as previously explained, has the same cost as parsing 6 bytes), before moving the packet to the buffer of the selected output I/O device.
The resulting model expressing the above steps in terms of EOs is summarized in Figure 2.6a, where ps is the ethernet payload size. Such model assumes that the collision probability of the hash is negligible (i.e., the hash table is sufficiently sparse).
Applying to the Ethernet switch model the mapping of EOs presented in Sec-tion 2.2.2, we can estimate that forwarding a packet, regardless of the packet size (thanks to DDIO), requires:
213 clock cycles +1 DRAM access
As a consequence, a single core of an Intel Xeon E5-2690v2 operating at3.6 Ghz
can process≈17.31 Mpps, while the DDR3 memory can support111.08 Mpps. The memory throughput is estimated considering that each packet requires a 12 byte memory access to read the hash table entry, which has a latency of:
(CAS latency×2) +3 data rate
1We consider that interfaces are identified by their Ethernet address. Different implementations can use a different identifier, which leads to a minor variation in the model.
I/O_mem(30,ps) parse(6)
ht_lookup(1,12,2M,0) deparse(6)
mem_I/O(30,ps)
(a) Basic forwarding switch model.
I/O_mem(30,ps) parse(8) ht_lookup(1,14,2M,0) parse(12) ct_insertion(2,14,2M,0) deparse(6) mem_I/O(30,ps)
(b) Learning switch model.
I/O_mem(34,ps-4) parse(3) ht_lookup(1,12,1M,0) parse(1) decrease(1) deparse(10) mem_I/O(34,ps-4) (c) MPLS switch model.
Fig. 2.6 Models of different L2 switches.
If we consider minimum size (64 bytes) packets (i.e., an unrealistic, worst case scenario), a single core can process≈11.36 Gbps.
Learning Switch
We here consider an Ethernet switch with VLAN support, in which case the key used for lookups in the forwarding table consists of the destination MAC address and the VLAN ID (2 bytes). Hence, 8 bytes must be parsed from the header (destination address and VLAN ID) of each packet in order to obtain the lookup key and entries in the forwarding table are 14 bytes long (destination address and VLAN ID as key and output interface as value). Since the switch is applying backward learning, for each packet the source MAC address and source port are used to update the forwarding table. The switch must also parse the source MAC address and read from
2.3 Modeling Use Cases
memory the source port (added to packets stored in memory) and either add an entry in the forwarding table or just update the timestamp of an existing one. The resulting model is shown in Figure 2.6b.
When mapped to our hardware architecture, forwarding a packet requires an estimated:
352 clock cycles +2 DRAM accesses
hence the maximum throughput reachable by a single core is reduced to≈10.47 Mpps, while the DDR3 memory can support 55.54 Mpps. This translates to a maximum throughput of≈6.87 Gbpsfor 64 byte packets.
MPLS Switch
An MPLS switch is a simple, yet currently widely deployed, Network Function. For each packet the switch swaps a single MPLS label and forwards the packet on an Ethernet network towards the next hop. The new label and the next hop are retrieved from a hash table whose key is the label extracted from the packet. Since the MPLS switch modifies the label in the MPLS header, in addition to associating to it the output port, the MPLS header (4 bytes) is also preferably copied in the L1/L2 cache, while the rest of the packet can be kept in L3 cache or main memory. The switch must then extract the MPLS label (20 bit≈3 bytes) prior to using it to access the hash table to get the new label and the next hop. The hash table has one key (the label) and consists of 12 byte entries:
• Input label (key) - 3 bytes • Output label - 3 bytes
• Next hop Ethernet address - 6 bytes.
The maximum number of entries in the hash table is, in the worst case, 1M=220 and we consider that the collision probability is negligible.
In the most general case, each entry, referred in the MPLS standard documents as Next Hop Label Forwarding Entry (NHLFE), could hold more than one label in case of multiple label operations. For the sake of simplicity we model only a single
label operation: the swapping of a label, which is the most frequent operation in common MPLS switch deployment scenarios.
The switch must also decrease the Time-To-Live (TTL) contained in the MPLS header, which requires parsing the corresponding field, followed by a decrease operation for the 1 byte field. The new (outgoing) MPLS header and output port must be stored in main memory (encapsulation of 10 bytes) and moved to the buffer of the output I/O device. The resulting model is summarized in Figure 2.6c.
As we map this model to the considered hardware platform, we can conclude that the estimated forwarding cost for a MPLS switch is:
224 clock cycles +1 DRAM access
corresponding to a maximum per core throughput of ≈ 16.45 Mpps, while the memory could provide the same throughput as the basic forwarding switch. The maximum bitrate considering 64 bytes packets is≈10.8 Gbps.
2.3.2
Broadband Network Gateway
A Broadband Network Gateway (BNG) is the first IP point in the network for DSL and cable modem subscribers connecting them to the broadband IP network. The primary task of a BNG is to aggregate traffic from various subscriber sessions from an access network, and route it to the core network of the service provider. Moreover, a BNG carries out additional vital tasks for Network Service Providers (NSPs), such as managing subscribers’ sessions, performing accounting and enforcing operator policies. Hence, a BNG represents a more complex use case for the application of the proposed modelization approach.
In our modeling effort we refer to the software implementation of a BNG present in the Intel Data Plane Performance Demonstrators (DPPD) [18]. This is an open source, highly optimized software BNG specifically intended for performance analy-sis. In this implementation the traffic in the access network between the Customer Premise Equipment (CPE) and the BNG is encapsulated using Ethernet QinQ frames, while the traffic between the BNG and the Carrier-grade NAT (CGNAT) in the core MPLS network is encapsulated using GRE (Generic Routing Encapsulation). In this scenario packets received from the access network and packets received from
2.3 Modeling Use Cases
Dst addr Src addr S-VLAN C-VLANEtherType
Data FCS
6 bytes 6 bytes 4 bytes 4 bytes 2 bytes
18 –1480 bytes 4 bytes
Ethernet MPLS Data FCS
14 bytes 4 bytes 20 bytes 12 bytes 0–1444 bytes 4 bytes IPv4 20 bytes
A
cce
ss
Co
re
IPv4 22 bytesGRE Key: 32 bits VLAN ID: 12 bits VLAN ID: 12 bits
Ethernet + QinQ
20 bytes
GRE IPv4
Fig. 2.7 Packet formats.
the core network are processed differently by the BNG, thus 2 separate models are required for the 2 directions. The two different formats of packets forwarded in the access and in the core network is illustrated in Figure 2.7.
Packets from CPEs are matched with 2 different tables: (i) a hash table that given the QinQ tag provides the corresponding GRE key (up to 16M entries of 7 bytes) and (ii) an LPM routing table that given the destination IP address returns the output port, the IP address of the remote GRE tunnel endpoint, the next hop MAC address and the MPLS label (this table can contain up to 8K routes). Packets from the core network are instead matched with only one hash table that given the GRE key and the inner destination IP address provides the QinQ tag, the destination MAC address and the output port. The BNG supports up to 64K CPEs, thus this table can contain up to 64K entries of 23 bytes. The QinQ tag and the GRE key are used to track the subscriber (e.g., for accounting), while the tunnel endpoint (i.e., the CGNAT) is selected according to the destination of the packet.
The resulting models for both directions are summarized in Figure 2.8. When processing packets from the access network, MAC with QinQ and IP headers are loaded preferably in L1/L2 cache, so that the QinQ header can be parsed. The extracted QinQ tag is used for the lookup in table (i), while the destination IP address is parsed and deployed in the LPM lookup table (ii). These 2 lookups provide the output GRE key, destination IP and MAC addresses, MPLS tag and output port that are used in the encapsulation of the output packet. The TTL (Time To Live) of
Packet from access network I/O_mem(42,ps-20) parse(8) ht_lookup(1,7,16M,0) parse(4) lpm_lookup(2,23) parse(1) decrease(1) parse(2) inc_checksum(1) checksum(ps-14) sum(2) checksum(20) parse(16) ct_insertion(2,23,64K,0) deparse(70) mem_I/O(70,ps-20)
Packet from core network
I/O_mem(70,ps-56) parse(8) ht_lookup(2,23,64K,0) parse(1) decrease(1) parse(2) inc_checksum(1) deparse(42) mem_I/O(42,ps-56) Fig. 2.8 BNG model.
the internal IP packet is decremented and thus the checksum must be incrementally updated starting from the current value. The new packet format requires also the computation of the GRE checksum and the external IP packet Total Length field and header checksum. Moreover, backward learning is used to populate the table used to process packets from the core network. Hence, an additionalct_insertion
operation is required, after parsing source port, MAC and IP addresses. The final packet is formed with the encapsulation of 70 bytes, corresponding to the new ethernet, MPLS, external IP, GRE and inner IP headers and then sent to the output I/O buffer.
Packets from the core network require a parse operation for the GRE key and the inner destination IP before using them for an hash table lookup to get the QinQ tag, the destination MAC address and the output port. In this case also the TTL of the
2.4 Experimental validation
inner IP packet is decremented and the checksum incrementally updated. The new outgoing packet must then be stored in memory or cache (encapsulation of 42 bytes) and moved to the buffer of the output I/O device.
Mapping these models to the considered hardware platform, we can conclude that the estimated cost to process a 64 bytes packet from the access network is:
717 clock cycles +6 DRAM accesses
corresponding to a maximum per core throughput of≈5.14 Mpps(3.37 Gbps), while the DDR3 memory can support≈12.11 Mpps(7.95 Gbps). The estimated cost to process a 64 byte packet from the core network is:
274 clock cycles +1 DRAM access
corresponding to a maximum per core throughput≈13.45 Mpps(8.83 Gbps) and≈
24.68 Mpps(16.2 Gbps) achievable by the DDR3 memory.
2.4
Experimental validation
In order to evaluate the accuracy of the estimates produced by the proposed modeling approach, in this section we present measurements made in a lab setting with software implementations of the presented Network Functions.
2.4.1
L2 Switch
As a software L2 switch we deploy an instance of Open vSwitch [19] configured through the OpenFlow protocol to select an output port based on the destination MAC address. The switch is used with both a predefined forwarding table and backward learning. Moreover, the same switch implementation is also configured to perform MPLS label swapping. The software switch runs on the hardware platform presented in Figure 2.2.
To minimize the interference of the operating system drivers, the network inter-faces are managed through the Intel DPDK drivers [15]. These drivers are designed for fast packet processing, providing the possibility to receive and send packets
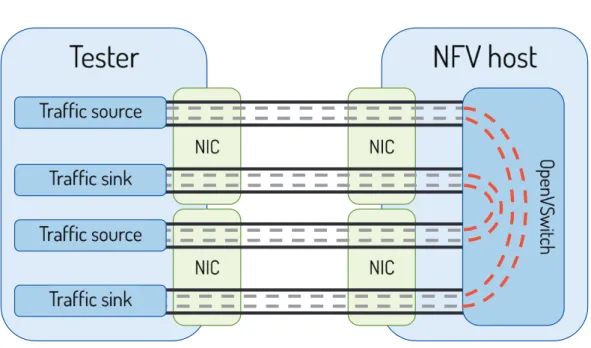
Fig. 2.9 L2 Switch testbed setup.
directly from/to a network interface card within the minimum possible number of CPU cycles. In fact, DPDK drivers allow the CPU to receive packets using polling, rather than interrupts, since interrupt service routines execute a number of additional operations for each packet. Moreover, with DPDK drivers it is possible to leverage DDIO to load packets directly in the L3 cache with no overhead for the CPU.
A separate PC with the same hardware configuration is used as a traffic generator leveraging PF_RING/DNA drivers [20] to generate traffic up to the link capacity even with packets of minimum size. As shown in Figure 2.9, we run 4 different processes, 2 PF_RING senders and 2 PF_RING counters, pinned on different dedicated cores, to generate traffic on both NICs at line rate and, at the same time, compute statistics on received packets. All the tests are run for 5 minutes and the results present the averaged aggregate statistics on both sinks.
Basic Forwarding
To test the forwarding performance of the software switch, we generate traffic consisting of Ethernet packets with ever different destination MAC addresses, in order to prevent inter-packet caching. For each destination address we had previously added a rule in the switch to set the destination port. The resulting throughput for
2.4 Experimental validation
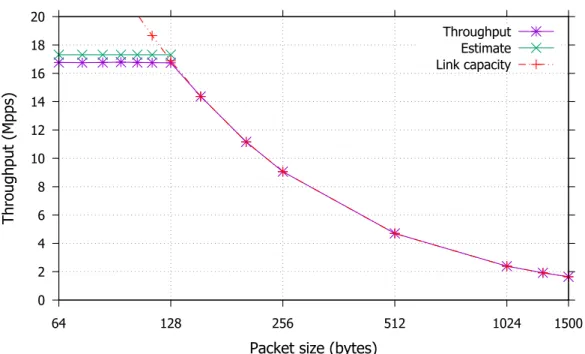
different packet sizes is presented in Figure 2.10, together with the values estimated with the modeling approach in Section 2.3.1.
0 2 4 6 8 10 12 14 16 18 20 64 128 256 512 1024 1500 Throughput (Mpps)
Packet size (bytes)
Throughput Estimate Link capacity
Fig. 2.10 Basic forwarding performance.
The experimental results show that in this scenario the switch can achieve through-put up to the link capacity except with packets smaller than 128 bytes. For values of the performance estimate that exceed the link capacity (i.e., packets greater than 128 bytes), our model cannot be applied by itself as it considers the hardware compu-tational capability and not the transmission rate of the physical links that becomes the limiting factor in such scenario. With smaller packets, our mode estimates a rate around17 Mpps, regardless of the actual packet size. The measurements demonstrate that that the throughput estimation is quite accurate, with only a 4% error.
Learning Switch
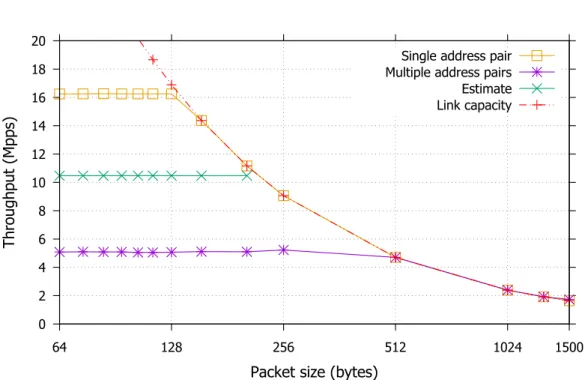
The next test is aimed at measuring to what extent the performance of the software switch is impacted in a context in which the learning algorithm plays a significant role in the processing being performed. We configure the switch by pushing an OpenFlow rule with a “NORMAL” action, so that it acts as a regular layer 2 learning switch [21]. Then, before starting the test, for each destination address that will be used in the test traffic, the corresponding traffic sink sends a packet with the same
0 2 4 6 8 10 12 14 16 18 20 64 128 256 512 1024 1500 Throughput (Mpps)
Packet size (bytes)
Single address pair Multiple address pairs Estimate Link capacity
Fig. 2.11 Learning switch performance.
address as source. This allows the switch to learn the output port associated with the addresses to ensure that measurements will be taken in a steady state (i.e., avoiding that some packets are flooded on all ports, while others are sent out on a specific port).
To isolate the impact of caching on the performance we consider 2 scenarios. In a first test each traffic source sends traffic addressed to only one destination and with a unique source address. In a second test each traffic source sends traffic using repeatedly 10 different source and destination addresses. We chose this number of different address pairs after a preliminary evaluation, which showed that this is the turning point at which the throughput experiences a sharp decrease due to cache misses. The difference between the basic forwarding throughput (see Figure 2.10) and the throughput in this second scenario represents the performance degradation due to the learning functionality itself. The resulting throughput measured in both tests by the traffic sinks, is presented in Figure 2.11 for different packet sizes, together with the values estimated with the proposed model.
The results show that, when all the packets have a single source and destination address pair, the switch can achieve a very high throughput (≈16 Mppswith packets that are 128 bytes or smaller) because the 2 corresponding entries (one for forwarding
2.4 Experimental validation
and one for learning) are matched within themicroflowcache [19] that Open vSwitch implements in kernel space. Since the microflow cache is stored in L1/L2 cache (thanks to its small size), the execution of the learning code updating the timestamp requires very few clock cycles (≈ 140), significantly lower than our estimate (≈
350) that assumes a main memory-based lookup of the forwarding table (because the Open vSwitch implementation specific microflow cache is not modeled).
On the contrary, with 10 different addresses the throughput radically drops to only
5 Mppsfor packets smaller than 512 bytes because the forwarding entry to be updated is not in the microflow cache, in which case the Open vSwitch implementation delegates the update operation to a user space process. This is significantly different from the estimated throughput of≈10.5 Mppsexpected when an entry timestamp is updated for each packet. While the design choice of Open vSwitch performing packet processing, beyond basic forwarding, in user space increases flexibility and configurability, it adds a large overhead. As the test show, this complexity is not considered in the model. On the other hand, our model also does not capture the microflow cache-based optimization and the unlikely case in which it allows to avoid a lookup within the complete hash table. In fact, the modelization approach we are proposing aims at evaluating the operation of an optimized NF operating in average conditions.
MPLS Switch
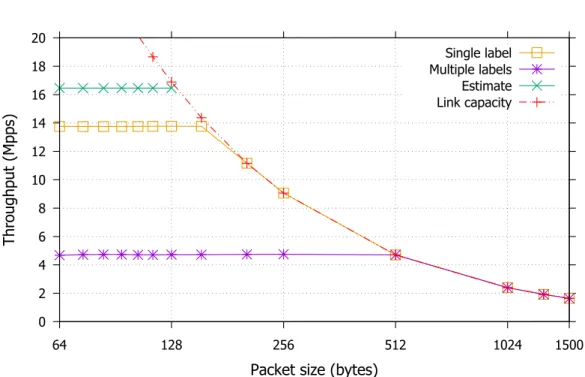
We evaluate the MPLS Switch model presented in Section 2.3.1 using MPLS over Ethernet frames. As in the previous case, we perform 2 different tests, one where each source sends traffic with only one MPLS label, and a second test where each source sends packets marked with 10 different MPLS labels. A rule matching each label present in the source traffic is added in the switch before the test begins.
The results of the tests and the estimate plotted in Figure 2.12 show that in both scenarios the measured throughput is below the estimated value. Since MPLS packet processing is computationally very similar to basic forwarding, the model estimates a
16.76 Mppsthroughput that is close to the17.47 Mppsestimate for basic forwarding. On the contrary, the measured throughput for the MPLS switch when operating with multiple labels (in a scenario comparable to the basic forwarding tests) is well below (about one third) the one obtained with basic forwarding, which hints to a poor optimization of MPLS processing in the software switch implementation. This
0 2 4 6 8 10 12 14 16 18 20 64 128 256 512 1024 1500 Throughput (Mpps)
Packet size (bytes)
Single label Multiple labels Estimate Link capacity
Fig. 2.12 MPLS switch performance.
might be related to the fact that forwarding based on MPLS labels was added to Open vSwitch relatively recently, hence the code is not as mature and optimized as the Ethernet address-based forwarding one. The large difference between the single and multiple labels tests shows that caching is playing an important role and in a real scenario, with traffic with multiple different labels, the software switch performance takes a significant hit (being almost one third of the case that takes advantage of caching).
2.4.2
Broadband Network Gateway
We run our tests on the BNG platform provided by Intel DPPD [18] on the hard-ware platform presented in Figure 2.2. This platform has been upgraded with one additional Intel 82599ES network card with 2x10Gbps Ethernet ports, given that the software requires 2 ports connected to the access network and 2 ports connected to the core network. The Intel Packet pROcessing eXecution Engine (PROX) is run on a second machine with the same hardware characteristics as a traffic generator. The test is run using the Intel Dataplane Automated Testing System (DATS), which controls one instance of PROX running on the tester machine to generate and to analyze the traffic and one instance of the BNG on the other host. DATS generates a realistic
2.4 Experimental validation 0 5 10 15 20 25 64 128 256 512 1024 1500 Throughput (Mpps)
Packet size (bytes)
Throughput Generic estimate Platform specific estimate Link capacity
Fig. 2.13 Broadband Network Gateway performance.
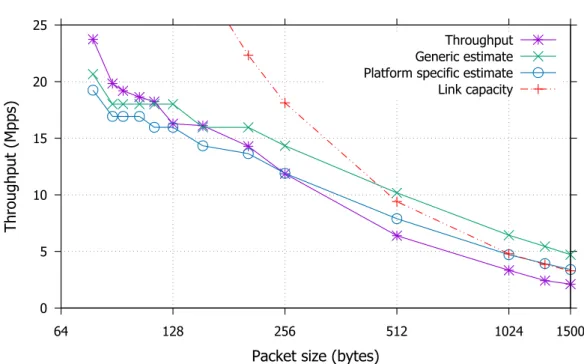
workload simulating traffic from 32K users per port and with 8K possible routes. The test is executed 10 times and the averaged results are presented in Figure 2.13, where they are compared with the estimate devised in Section 2.3.2. Since DATS reports the aggregated throughput, corresponding to the total number of packets per second processed by the BNG, the plotted estimate is the average of the throughput estimates in the 2 directions.
The BNG software spawns 4 load balancer threads (one per interface) distributing the traffic among 6 packet processing threads. Therefore in the estimate we consider that 6 cores are dedicated to packet processing. Thanks to the parallel execution the CPU could theoretically process up to 42.5 Mpps with 78 byte packets (the smallest packet generated by PROX). Hovewer, given the considerable number of main memory accesses required by the BNG to process a single packet, our model concludes that the overall throughput (for small packets) is limited by the memory latency and only23.74 Mppscan be processed when packets are 78 byte long. As shown by thegeneric estimateline plotted in Figure 2.13, the model is quite accurate in estimating the performance for small packets, with a 7% average error for packets up to 204 bytes. However, the model is less accurate for larger packet sizes. This is due to a side effect of the distributed execution of the NF.
The hardware platform used in the experiments has 2 processors and 2 NICs, each NIC connected to the socket of one of the processors. The DDIO mechanism considered in Section 2.2.2 when mapping theI/O_mem(hdr, data)EO onto the hardware platform, moves each packet received through a NIC to the L3 cache of the processor it is connected to. When a packet processing thread running on the other processor executes theI/O_mem(hdr, data)EO on a packet stored in the L3 cache of the other processor, its cost is different than the one presented in Section 2.2.2 because the processor must read the packet from the main memory and load it into its own L1/L2 cache before starting processing it. As a result, in this case the execution of the EO requires:
30+5∗ ⌈hdr+data
64B ⌉clock cycles+⌈
hdr+data
64B ⌉DRAM accesses
Note that the BNG needs to process the whole packet (i.e.,hdr+databytes), not just the header, in order to compute the GRE checksum.
Considering that that the 4 load balancer threads are uniformly distributing packets on the 6 packet processing threads and that the traffic load on the two interfaces is the same, there is a 50% chance for a packet not to be in the L3 cache of the processor running the corresponding processing thread, which is taken into account in plotting theplatform specific estimate line in Figure 2.13. When compared to thegeneric estimate, it provides a more accurate throughput estimate for larger packets that cause a non-negligible wait time for the processor retrieving them from main memory.
2.4.3
Concluding Remarks
The comparison of experimental results with the estimates produced by our model presented in this section shows that software NF performance, and consequently the modeling accuracy, are heavily affected by multiple quite specific factors, such as:
• The effectiveness of caching mechanisms realized in both the execution plat-form (e.g., processor cache) and the software implementation of algorithms and data structures (e.g., the microflow cache). Cache deployment largely