ePub
Institutional Repository
Maria Rita Testa and Fabian Stephany
The educational gradient of fertility intentions: a meta-analysis of European
studies.
Article (Published) (Refereed)
Original Citation:
Testa, Maria Rita and Stephany, Fabian (2017) The educational gradient of fertility intentions: a
meta-analysis of European studies. Vienna Yearbook of Population Research, 15. pp. 1-38. ISSN
1728-5305
This version is available at: http://epub.wu.ac.at/6313/
Available in ePubWU: May 2018
ePubWU, the institutional repository of the WU Vienna University of Economics and Business, is
provided by the University Library and the IT-Services. The aim is to enable open access to the scholarly output of the WU.
This document is the publisher-created published version. It is a verbatim copy of the publisher version.
The educational gradient of fertility intentions:
a meta-analysis of European studies
Maria Rita Testa and Fabian Stephany∗
Abstract
Unlike achieved fertility, fertility intentions are often positively correlated with education. However, the conditions under which such a positive relationship exists are not yet well known. Using 86 pieces of research covering 13 European countries that were published between 1990 and 2011, we assess in a quantitative manner the temporal and cross-country variation in the relationship between educational attainment and reproductive intentions. Because of the sequential nature of reproductive decisions and the gendered nature of each individual’s life course, we look separately at childless women and women with one child, and compare women with men. Our findings show that both first and second birth intentions and educational attainment are positively correlated, but that this relationship – which is stronger for men than for women – tends to disappear when the normative value of a two-child family is reached. Structural labour market characteristics explain a good portion of the cross-country variance: the educational slope of first and second birth intentions is steeper in countries with large shares of women in vulnerable employment situations or in part-time employment, and is flatter in countries with gender-equal labour force participation and large shares of women in highly qualified employment.
1 Introduction
Fertility intentions, or intended family size, represent an important channel
through which education affects achieved fertility, or actual family size. However,
the relationship between fertility intentions and educational attainment is not
∗Maria Rita Testa (corresponding author), Vienna Institute of Demography of the Austrian Academy of
Sciences and Vienna University of Economics and Business, Welthandelsplatz 2, Level 2, 1020 Vienna, Austria
Email: [email protected]
Fabian Stephany, Vienna University of Economics and Business, Austria
necessarily the same as the relationship between actual fertility and educational attainment. Empirical evidence indicates that more educated women do not necessarily intend to have fewer children than less educated women; they just end up having fewer children. The postponement of childbearing and the parity-specific distribution of fertility intentions (Sobotka 2009) may help to explain this apparent contradiction.
It appears that in recent decades, women are finding that having a high level of education has become more compatible with fertility. This trend is attributable to the increasing social acceptance of women’s employment, the implementation of policies facilitating work and family life, and the increasing involvement of men in childcare tasks. The extent to which this trend is real, and is reflected in the literature on fertility intentions, constitutes the core contribution of this paper. Advancing our knowledge of the reproductive decision-making processes of women with low, medium, and high levels of education is useful for formulating policies aimed at stemming further fertility decline.
A large body of research has examined differences in fertility intentions by
educational attainment across countries and over time. The findings of these studies on the sign of the education-intention link have been contradictory. Some scholars have shown that highly educated women are more likely than their less educated counterparts to plan to have a large family (e.g. Heiland et al. 2008; Mills et al. 2008), while others have come to the opposite conclusion (e.g. Musick et al. 2009). Recently, some authors have emphasised the role of contextual factors by suggesting that the relationship between education and fertility – and, presumably, fertility intentions – is positive in countries where the institutional arrangements support the compatibility of work and family life, as well as gender equality in the family and in the labour market (Hobson and Ol´ah 2006; Matysiak 2011; Neyer 2013). In a recent multi-level analysis, the cross-country and temporal variation in the link between education and birth intentions has been investigated at both the individual and the country level, as well as in a micro–macro integrated framework (Testa 2014). The empirical evidence provided in the micro-macro European context suggests that women of reproductive ages are more prone to plan to invest in both education and family size if they live in an institutional context that facilitates work-life balance; that is, in a country where work career and fertility are not seen as incompatible. Most importantly, this study suggests that both being highly educated and living in a country where a large share of women are college educated are positively associated with women’s childbearing intentions.
In order to validate these previous findings, which used a cross-sectional multi-country dataset based on limited national sample sizes, we undertake for the first
time a meta-analysis of all published research on the effect of educational attainment
on fertility intentions. A meta-analytical approach to the study of fertility intentions is entirely new in the literature. As a systematic review of quantitative results, a meta-analytic study cannot produce genuinely innovative results. However, such a study has a twofold advantage over a single research study: namely, it can provide more general outcomes than any single analysis; and it can generate estimates with
greater statistical power than the estimates produced by a single empirical study. Moreover, because it has a strong comparative point of view, a meta-analysis is particularly suitable for the purposes of our study.
The paper is organised as follows: first, we outline the theoretical framework of fertility intentions; second, we describe the methodological approach and the analytical steps taken in the computation of the meta-sample; next, we present the results in a purely descriptive manner (forest plots) and in a meta-regression format; finally, we discuss the main findings in light of the previous literature.
2 Theoretical perspectives
2.1 The role of education in fertility and reproductive
decision-making theories
Both economic and cultural theories have argued that the increase in female education has played an important role in fertility decline (Becker 1991; Lesthaeghe and Surkyn 1988). However, studies on the educational gradient of second and higher order births have generated mixed results: in Western, Northern, and Southern European countries, second and third births seem to be positively associated with level of education (Kreyenfeld 2002; Caltabiano Castiglioni and Rosina 2009; Kravdal and Rindfuss 2008); while in Eastern European countries, a negative association between fertility and education tends to prevail (see, for example, Muresan and Hoem (2010)). In most countries, educational enrolment and family formation are seen as incompatible (Blossfeld and Huinink 1991). Prolonged
enrolment in education has both a direct effect on the timing of fertility (i.e. a delay
in the start of childbearing) and an indirect impact on the quantum of fertility (i.e. a reduction in the time left for the progression to higher order births (N´ı Bhrolch´ain and Beaujouan 2012). Fertility intentions can tell us the extent to which this double
negative effect of education on fertility is intentional, or is instead the outcome
of fertility plans that are not realised. The prediction made in the literature on the second demographic transition that ideational change lowers people’s fertility intentions by emphasising individuals’ self-realisation needs and values (Van de Kaa 2002; Caltabiano et al. 2009; Lesthaeghe 2010; McQuillan et al. 2014) has not come true. Post-materialist attitudes do not seem to be negatively correlated with ideal family size, and a considerable number of studies have found that fertility intentions are indeed higher among highly educated than among less educated women (De Wachter and Neels 2011; Mills et al. 2008; Roukolainen and Notkola 2002); and that these intentions are often closely clustered around the level of two children (Testa 2014).
Theories and empirical findings related to fertility are often mechanistically applied to studies of fertility intentions (Ajzen and Klobas 2013; Philipov 2011). However, almost no scholars would argue that a theory on behaviour is fully
adequate for explaining the intentions that precede it (Philipov 2011). As the predictors of reproductive behaviour are not necessarily the same as the predictors of birth intentions, distinct theoretical frameworks for fertility intentions and achieved fertility are needed. Ideally, both theoretical approaches should seek to answer the question of whether achieved fertility is the result of prior intentions. Currently, no specific demographic theory of fertility intentions exists. Thus, theories of fertility or theories of decision-making are used as the theoretical framework in studies of reproductive intentions.
One of the most common theoretical frameworks of achieved fertility is the micro-economic theory (Becker 1960 and 1991) that posits that the relationship between education and childbearing is explained by two behavioural mechanisms.
On the one hand, theincome effect suggests that highly educated women are in a
better position than less educated women to cope with the direct costs associated
with childbearing; although this effect can be attenuated by higher investments
in the quality of children, rather than in having additional children (Becker and Lewis 1973). On the other hand, the favourable labour market opportunities and
higher earnings associated with higher education can negatively affect fertility, as
they increase the cost of engaging in non-market activities such as childrearing (opportunity costs). The effect of education on fertility depends on the balance
between the income effect and the opportunity costs, which can vary substantially
across societal and institutional contexts (Blossfeld and Huinink 1991; Adsera 2011). This theoretical approach focuses on the observed births, and does not distinguish between intentions and outcomes. Thus, attempts to apply this theory
to the study of intended fertility have led to the assumption that the income effect
might be supportive of fertility intentions as well, especially in institutional contexts that facilitate the reconciliation of work and family duties (Testa 2014). In Northern Europe, for example, highly educated women are more likely than less educated women to plan to have a second or a third child (Tesching 2012).
Three main psychological theories are applied to the study of fertility intentions: the theory of planned behaviour (TPB), the theory of traits-intentions-desires-behaviour (TDIB), and the theory of conjunctural action (TCA). Furthermore, the
life course theory offers a framework for studying fertility intentions dynamically
over an individual’s life course, and for making the link between individuals (micro-level dimension) and contexts (macro-(micro-level dimension) (Morgan and Taylor 2006). Here, agency refers to individuals constructing their biographies as self-monitored actors within the particular opportunities and constraints they face.
According to the theory of planned behaviour, intentions are the outcomes of three factors: attitudes towards the behaviour, subjective norms, and perceived behavioural control. Attitudes reflect the internal evaluation of positive or negative outcomes that might follow a certain behaviour (e.g. childbearing). Subjective norms refer to a person’s perceptions of how the goal is supported or influenced by the members of his or her close social circle. Perceived behavioural control refers to the person’s ability to pursue a certain goal given the available resources (e.g. housing or income). While this theory does not explicitly consider the
educational dimension, it can be reasonably assumed that there is a negative education-intention correlation through the first two factors of attitudes and norms because childbearing competes with education and employment aspirations; and that there is a positive correlation through perceived behavioural control because compared to the less educated, the highly educated tend to have better housing conditions, higher incomes, more stable partnerships, and more resources to access to assisted reproduction services if needed. The main speculative argument is thus that having a high level of perceived behavioural control might lead highly educated women (and men) to form the intention to have a(n additional) child more frequently than their less educated counterparts. Importantly, according to the TPB, perceived behavioural control influences the intentions, but not the behaviour (i.e. the realisation of intentions); whereas actual behavioural control influences both the formation of intentions and the transition path from intentions to behaviour. Research has shown that the decision to become a parent – i.e. the intention to have a first birth – is driven mainly by attitudes and subjective norms (for which we assume that education has a negative influence); while perceived behavioural control is more relevant for the intention to have a second or a higher order birth (for which we assume that education has a positive influence) (Billari et al. 2009). These findings appear to support the existence of a (more) positive education-intention link at high
parities. Most of the previous literature has shown that the major effect of education
on childbearing relates to the timing rather than the quantum of fertility. A highly educated woman is unlikely to enter parenthood early in her life course, as doing so would likely lower her career prospects and future income (Lappegård 2002). But once a highly educated woman has a first child, she is likely to have a second
because her higher earnings enable her to afford private or subsidized childcare,
and because she has little remaining time to complete her childbearing career (Kreyenfeld 2002). A less educated woman, by contrast, faces lower opportunity costs for childbearing, and is thus likely to have her first child early in her life
course. However, a less educated woman may find it difficult to have a second or a
third child because of her low income (Liefbroer and Corijn 1999).
The other two theories of reproductive decision-making emphasise the negative correlation between educational attainment and fertility intentions. The theory of conjunctural action (TCA) postulates that there is a negative educational gradient of fertility intentions; i.e. that highly educated women place a higher value on
career success and leisure than less educated women1(Bachrach and Morgan 2011).
Similarly, the TDIB argues that highly educated women and men are more likely than their less educated counterparts to be exposed to life paths and turning point
events that compete with childbearing (Miller 2011). The life course theory offers
1 Thetheory of conjunctural action (TCA)is based on social theory, psychology, and the life course
framework. It takes into account conscious and unconscious processes leading to behaviour and the effect of the social context on the process. Fertility intentions may result from normative schemas people have regarding the concept of family. Therefore, expressing an intention to have two children may not be a commitment to act accordingly, but rather a result of an unconscious schema.
a dynamic perspective of birth intentions as moving targets (Yeatman et al. 2013). This theory suggests that social cues, such as cues to acquire higher educational qualifications, can lead to revisions of fertility intentions over the life course (Hayford 2009), and that these revisions tend to lower fertility more among highly educated than less educated women and men (Iacovou and Tavares 2011; Gray et al. 2012). However, the link between education and fertility intentions may also turn from negative to positive over the life course when specific birth order intentions come into play. Intentions decline with the birth of each additional child (McQuillan 2014; Liefbroer 2009), but they may decrease less among highly educated women
and men who can afford to have a larger family than among less educated women
and men who cannot.
2.2 Research hypotheses
In this analysis, the relationship between educational attainment and fertility intentions is examined across the three main dimensions of gender, parity, and country. According to the theories outlined above, highly educated individuals are more likely than their less educated counterparts to postpone starting a family (Billari and Philipov 2004; Kohler et al. 2002; Rindfuss et al. 1996), and the
effects of this delay are more pronounced for women than for men because the
timing of the start of childbearing has more implications for women than for men. Moreover, women with low levels of education are more likely than women with high levels of education to start having children before marrying or securing stable employment (Johnson-Hanks et al. 2011). Finally, because the biological window for childbearing is smaller for women than for men, women tend to be more aware of the normative age deadlines for starting a family. However, men also face childbearing constraints related to the male biological clock (Lambert at 2006) and the threat of “leaving it too late” (Thomson and Lee 2011). Far less is known about
the effects of the ticking of the biological clock on the birth intentions of men than
of women. Generally, young men say they intend to delay childbearing until well into their late twenties and early thirties. Research has shown that a majority of male university students in Australia plan to have children after age 35 (Thomson and Lee 2011), which is the average age at which men’s biological fertility begins to decline (Lambert et al. 2006). On the other hand, educational attainment and fertility, whether achieved or intended, are positively correlated among men (see Martin-Garcia 2008 for achieved fertility; and Heiland et al. 2005 for intended fertility). Consistent with the idea that men need to have the ability to provide for their children, less educated men tend to want a smaller family, and are less likely than their better educated counterparts to report having positive first birth intentions (Lappegård et al. 2011). Since the postponement of (the start of) childbearing translates into delayed but not foregone fertility, there is a positive relationship
between education and birth intentions. Hence, we hypothesise thatthe educational
for both women and men, but more so for women (who are more likely to postpone) than for men.
Furthermore, we expect to find that highly educated women and men are more likely than their less educated counterparts to say they intend to have a second child because the former generally have more resources for outsourcing childcare than
the latter (income effect). The educational gradient of reproductive intentions tends
to be positive because of the income effect, which is expected to be steeper among
men than among women because men tend to have higher incomes. As the main provider for the family, a man typically has to be in a stable socioeconomic position before planning to have a second or third child (Lappegård et al. 2011; Lappegård 2012). Unlike highly educated men, highly educated women have to counterbalance
the income effect of having children. Because men are less involved than women
in childbearing and childrearing, men face lower opportunity costs when starting a family (Berrington 2004). Nevertheless, research has shown that the education-intention relationship can still be positive among highly educated women because combining paid work and family responsibilities may be less stressful for college
educated women than for less educated women. We therefore expect to find thatthe
educational gradient of second birth intentions is positive for both men and women, and more so for men than for women.
Finally, educational differences in birth intentions are expected to be smaller if
labour force participation rates are similar for men and women, and if the share of highly educated women participating in the labour market is large; as these conditions signal to young women of all education groups that it is possible to have both a career and a family with children (Testa 2014). Hence, our third hypothesis
reads as follows: The positive correlation between educational attainment and
second birth intentions is weaker in countries where the labour market structure favours full-time and regular employment for women.However, we are not able to
determine whether the expected smaller differences are due to the higher intentions
of the less educated group or to the lower intentions of the highly educated group. While we recognize that it would be interesting to move beyond the study of second and third birth intentions to investigate higher order births, we restrict our attention to parities zero, one, and two because of the limitations of the data, which do not contain enough cases to allow us to analyse the decision-making processes at parities higher than two.
3 Data and Methods
3.1 Research design
Meta-analysis is useful for synthesising and interpreting research results from
different studies that cover one specific topic of interest. This method has been
Amato and Keith 1991; Waldforf and Pillsung 2005; Matysiak and Vignoli 2008; Matysiak and Vignoli 2008; Borenstein 2010). Unlike classical reviews of existing literature, this approach provides a clear and systematic way of comparing inter-study results. The first stage of a meta-analysis consists of conducting a literature review and selecting suitable research papers according to criteria of comparability.
In a second stage, using a standardised procedure, the coefficients (or alternative
parameters or statistic measures) of each study are recalculated to determine the effect sizes, which measure the association between the dependent and the independent variable in a comparable way.
In this meta-analysis, we selected only published research based on regression
analysis; thus, beta coefficients and the related standard errors are the main
objects of our meta-analytic sample. The education-intentions link is therefore considered net of possible sociodemographic confounders, including age, parity, and marital status; which are the explanatory variables considered in all of the studies included in the meta-sample. The basic unit in the meta-sample is a set of
regression coefficients derived from regression models (i.e. study line2) that does
not correspond to a single study; some studies may include several regressions providing multiple study lines.
Demographers first began asking people to report their childbearing intentions in the late 1970s. But because demographic research on fertility intentions was characterised by bivariate statistical analyses in the subsequent two decades
(Westoff and Ryder 1977), we have restricted the temporal scope of our
meta-analysis primarily to the past two decades, 1990–2011.
3.2 The meta-sample
The selection of studies for the meta-sample is a major trade-offin meta-analysis.
A meta-analysis should ideally be comprehensive, but not too heterogeneous (Blettner et al. 1999). While scholars try to collect as many studies as possible, the selected pieces of research must satisfy the criteria of comparability. We adopted a three-step selection procedure. First, appropriate studies were identified by a search of Google Scholar and Web of Knowledge (WoK). Since the focus of this
study is on the effect of education on fertility intentions, the following keywords
and combinations have been utilised: “fertility intention”, “fertility desire”, and “education”; or “intended fertility” and “education”; or “fertility intention” and “education”; or “human capital” and “fertility intention”; or “intended number of children” and “education”; or “reproductive decision-making” and “education”. Second, previously undiscovered references given in the selected papers were included in the literature collection. Only papers written in English, German, French, and Italian have been considered. In a third step, several experts, nine in total, were
consulted for recommendations of papers not gathered in the first two phases. After seeking their advice, we were able to identify 161 papers that matched our criteria, of which 84 were found through the web search and 77 were recommended by the experts. Finally, this number was reduced considerably by excluding papers for a variety of reasons: e.g. the lack of a quantitative description of the relationship between education and fertility intentions, inaccurate measurements of education
and/or fertility intentions, or a focus on specific sub-groups. After these exclusions
were made, 29 papers with a total of 86 study lines remained in the meta-sample
(Table2). This final sample also contains four papers and 11 study lines in which
gender has not been distinguished. In 58 of the study lines (66%), only women’s education was considered; in 19 of the study lines (22%), both women’s and men’s education were examined; and in 11 study lines (12%), both women and men were considered, but there was no stratification by gender. This third group of study lines could not be considered in the forest plot analysis, which is conducted separately for women and men; but it was included in the meta-regression analysis, which includes gender as a control variable. For models that were built using a step-wise procedure (i.e. a gradual inclusion or exclusion of explanatory variables), only the full model specification was considered in the meta-analysis. To avoid study selection bias,
results from different studies based on the same dataset have all been included in the
analysis. The final meta-analytic sample covers studies conducted in the following 13 European countries: Austria, Bulgaria, Finland, France, Germany, Hungary, Italy, Norway, Poland, Russia, Switzerland, the Netherlands, and the United Kingdom. The selected meta-analytic studies were published between 1990 and 2011, and most (85%) were published between 2001 and 2011.
3.3 Fertility intentions measures
Measuring childbearing intentions is a challenging task because intentions
encom-pass several dimensions. One important distinction is between intentions/plans
and ideals/desires: intended fertility may not be the same as ideal fertility given
no constraints. Another distinction is made between lifetime intentions (so-called child-number intentions or quantum intentions) and short-term intentions (so-called child-timing intentions or time-dependent intentions), which are parity-specific and depend on the number of children already born. Lifetime intentions refer to the number of children an individual intends to have over his or her whole reproductive life, while short-term intentions refer to a small temporal framework in which the intention to have the first or the next child is confined.
In building the meta-sample, we selected articles using the terms “desire” and “want”, as well as the term “intention”. It is generally assumed that “want” captures wishes or feelings not directly linked to action, while “intend” captures concrete plans or conscious commitments to act. We did not restrict our analysis to one of these categories for two reasons. First, focusing merely on intentions would have considerably decreased the available meta-sample size. Second, desires have
been found to be even more predictive of reproductive behaviour than intentions, which suggests that a clear-cut distinction between the two measures might not be perceived by the interviewed individuals asked to report their answers in the survey (Miller 2011). Studies that refer to fertility desires, or ideals, rather than to intentions
constitute just 15% of the whole meta-sample (13 out of 86 study lines)3(Table1).
The meta-analysis covers studies that refer to all three measures of intentions: i.e. general childbearing intentions (the intention to have a(nother) child);
child-number intentions (the intention to have a given child-number of children4), and
child-timing intentions (the intention to have a(nother) child in a short-term period, usually the next two or three years). We decided we would not restrict our focus to just one of these measures because of the limited number of available papers in each of these categories. Of the study lines in the final meta-sample, 73% refer to general childbearing intentions, 20% to child-timing intentions, and only 7% to child-number intentions. The intention to have a first or another child, irrespective of timing and quantum, captures the intended parity transitions if information on the number of children already born is available and is controlled for in regression modelling; in such a case, the general intention to have another child becomes the specific first, second, third, or higher order birth intention. In most of the study lines in the meta-sample, a control for the number of children already born has been
included. A summary of the different expressions of fertility intentions used in the
studies covered by the meta-analysis is reported in Table1.
3.4 The analytical approach
A crucial step in the meta-analysis is the computation of the effect sizes. In our case,
the effect size is the difference between the effect of being highly educated and the
effect of being less educated on fertility intentions. The following formula has been
used for computation:
ES=⎧⎪⎪⎨⎪⎪⎩COEFhigh−COEFlow,
log(COEFhigh)−log(COEFlow), for Exp. models (e.g., Odds ratios),
(1)
where ES stands for effect size, COEF stands for coefficient, and the subscripts
“high” and “low” refer to the educational attainment categories; i.e. the highest and the lowest educational level, respectively. In the case of exponential models,
the log-transformation of the coefficients has been used to compute the differences
between the low and the high education category. Effect sizes are used to compare
3 Robustness checks showed that the results from the studies that used intentions only did not differ
significantly from the results based on the larger meta-sample that also included desires and ideals.
4 Research studies using the variable “intention to have a given number of children” were included in
the meta-analysis only if the contrast between zero children and one child or more (the choice between a family with or without children) was modelled in the regression analysis.
T able 1: Description of the studies included in the meta-sample. Model F ertility F ertility Delta-A uthor Country T able line ∗ concept measur e Gender P arity coe ffi cient Bernineer (2011) German y T able 1 n a General Intention Female P arity 0 0 . 31 Bernineer (2011) German y T able 1 n a General Intention Male P arity 0 0 . 15 Berrington (2004) UK T able 5 1 General Intention Female P arity 0 1 . 50 Bushier (2005) Bulgaria T able 6 1 T ime Intention Female P arity 0 − 0 . 06 Bushier (2005) Bulgaria T able 6 2 General Intention Female P arity 1 0 . 27 Bushier (2005) Bulgaria T able 6 3 T ime Intention Female P arity 1 0 . 14 Bushier (2005) Bulgaria T able 6 4 General Intention Female P arity 2 + 0 . 43 Bushier (2007) Poland T able 3 2 General Intention Female P arity 0 − 0 . 84 Bushier (2007) Poland T able 3 2 General Intention Male P arity 0 2 . 40 Bushier (2007) Poland T able 3 4 General Intention Female P arity 1 − 0 . 30 Buehler (2007) Poland T able 3 4 General Intention Male P arity 1 0 . 77 Bushier (2007) Poland T able 3 6 General Intention Female P arity 2 + − 0 . 62 Buehler (2007) Poland T able 3 6 General Intention Male P arity 2 + 0 . 04 Buehler (2007) Poland T able 5 6 General Intention Female P arity na − 0 . 31 Buehler (2007) Poland T able 5 6 General Intention Male P arity na 0 . 65 Ca v alli (2012) Italy T able 2 1 General Intention Female P arity na − 0 . 04 Ca v alli (2012) Italy T able 2 1 General Intention Male P arity na 0 . 17 Colloquium (2009) France Slide 11 1 Number Desire Both P arity 0 0 . 60 Colloquium (2009) France Slide 11 2 T ime Desire Both P arity 0 − 0 . 03 Colloquium (2009) France Slide 11 3 Number Desire Both P arity na 1 . 20 Colloquium (2009) France Slide 11 4 T ime Desire Both P arity na 0 . 20 Continued
T able 1: Continued Model F ertility F ertility Delta-A uthor Country T able line ∗ concept measur e Gender P arity coe ffi cient Dommerrnuth (2011) Norw ay T able 5 3 T ime W anting Both P arity 0 − 0 . 24 Dommermuth (2011) Norw ay T able 5 6 T ime W anting Both P arity na − 0 . 44 Fiori (2011) Italy T able 5 3 General Intention Female P arity 1 0 . 31 Fiori (2011) Italy T able 6 3 General Intention Female P arity 1 0 . 64 Hanappi (2014) Switzerland T able 2 3 General Intention Female P arity 0 0 . 99 Hanappi (2014) Switzerland T able 2 4 General Intention Male P arity 0 0 . 40 Hanappi (2014) Switzerland T able 3 3 General Intention Female P arity na 0 . 59 Hanappi (2014) Switzerland T able 3 4 General Intention Male P arity na − 0 . 78 Heard (2007) France T able 2 1 General Desire Male P arity na 0 . 37 Heard (2007) France T able 2 2 General Desire Female P arity na 0 . 09 Heiland (2008) German y T able 3 3 Number Desire Female P arity 0 0 . 18 Heiland (2008) German y T able 3 5 Number Desire Female P arity na 0 . 25 Heiland (2008) German y T able 3 7 Number Desire Female P arity 0 0 . 97 Heiland (2008) German y T able 3 9 Number Desire Female P arity na 0 . 15 K oenig (2011) German y T able 3 5 General Intention Female P arity 1 0 . 12 K oenig (2011) Hungary T able 4 5 General Intention Female P arity 1 0 . 00 Mencarini (2010) Italy T able 1 3 General Intention Female P arity na 0 . 33 Mencarini (2010) Italy T able 1 4 General Intention Male P arity na 0 . 00 Mencarini (2010) Italy T able 1 5 General Intention Female P arity na 0 . 48 Mencarini (2010) Italy T able 1 6 General Intention Male P arity na 0 . 13 Miettinen (2011) Finland T able A2 3 General Intention Both P arity 0 0 . 27 Miettinen (2011) Finland T able A2 6 General Intention Both P arity 1 0 . 08 Continued
T able 1: Continued Model F ertility F ertility Delta-A uthor Country T able line ∗ concept measur e Gender P arity coe ffi cient Miettinen (2011) Finland T able A3 3 General Intention Both P arity 2 + 0 . 30 Miettinen (2011) Finland T able A3 6 Number Ideal Both P arityna 0 . 31 Mills (2008) Italy T able 2 3 General Intention Female P arity na 2 . 60 Mills (2008) Netherlands T able 2 3 General Intention Female P arity na 1 . 53 P ailhe (2009) France T able 33-A 2 General Intention Female P arity 0 0 . 75 P ailhe (2009) France T able 33-A 4 General Intention Male P arity 0 − 0 . 24 P ailhe (2009) France T able 33-B 2 General Intention Female P arity na 0 . 27 P ailhe (2009) France T able 33-B 4 General Intention Male P arity na 0 . 41 P ailhe (2009) Russia T able 33-C 2 General Intention Female P arity 0 0 . 84 P ailhe (2009) Russia T able 33-C 4 General Intention Male P arity 0 0 . 43 P ailhe (2009) Russia T able 33-D 2 General Intention Female P arity na 0 . 37 P ailhe (2009) Russia T able 33-D 4 General Intention Male P arity na 0 . 58 P ailhe (2009) German y T able 33-E 2 General Intention Female P arity 0 − 0 . 06 P ailhe (2009) German y T able 33-E 4 General Intention Male P arity 0 1 . 43 P ailhe (2009) German y T able 33-F 2 General Intention Female P arity na 0 . 57 P ailhe (2009) German y T able 33-F 4 General Intention Male P arity na 0 . 24 Philipo v (2002) Bulgaria T able 7 1 General Intention Female P arity na 0 . 62 Philipo v (2002) Russia T able 7 2 General Intention Female P arity na − 0 . 03 Philipo v (2005) Bulgaria T able 1 1 General Intention Female P arity na 0 . 05 Philipo v (2005) Hungary T able 1 2 General Intention Female P arity na 0 . 35 Philipo v (2005) Bulgaria T able 1 3 T ime Intention Female P arity na − 0 . 11 Philipo v (2005) Hungary T able 1 4 T ime Intention Female P arity na − 0 . 02 Continued
T able 1: Continued Model F ertility F ertility Delta-A uthor Country T able line ∗ concept measur e Gender P arity coe ffi cient Philipo v (2005) Bulgaria T able 2 1 General Intention Female P arity 1 0 . 07 Philipo v (2005) Hungary T able 2 2 T ime Intention Female P arity 1 0 . 12 Philipo v (2005) Bulgaria T able 2 3 General Intention Female P arity 1 − 0 . 04 Philipo v (2005) Hungary T able 2 4 T ime Intention Female P arity 1 0 . 53 Philipo v (2006) Bulgaria T able 1 n a General Intention Female P arity na 0 . 05 Philipo v (2006) Bulgaria T able 1 n a T ime Intention Female P arity na − 0 . 11 Philipo v (2006) Hungary T able 1 n a General Intention Female P arity na 0 . 35 Philipo v (2006) Hungary T able 1 n a T ime Intention Female P arity na − 0 . 02 Philipo v (2006) Bulgaria T able 2 n a General Intention Female P arity 1 0 . 07 Philipo v (2006) Bulgaria T able 2 n a T ime Intention Female P arity 1 − 0 . 04 Philipo v (2006) Hungary T able 2 n a General Intention Female P arity 1 0 . 12 Philipo v (2006) Hungary T able 2 n a T ime Intention Female P arity 1 0 . 53 Rinesi (2011) Italy T able 2 1 General Intention Both P arity na 3 . 14 Schmitt (2012) German y T able A2 3 General Intention Female P arity 0 0 . 06 Schmitt (2012) German y T able A2 3 General Intention Male P arity 0 0 . 11 Schmitt (2012) UK T able A3 3 General Intention Female P arity 0 − 0 . 03 Schmitt (2012) UK T able A3 3 General Intention Male P arity 0 − 0 . 07 T esta (2012) Austria T able 3 1 T ime Intention Female P arity 0 0 . 32 T esta (2012) Austria T able 3 1 T ime Intention Male P arity 0 0 . 47 T esta (2012) Austria T able 3 2 T ime Intention Female P arity na 0 . 38 T esta (2012) Austria T able 3 2 T ime Intention Male P arity na 0 . 34 Sour ce: ∗Model line refers to the explicit column in the respecti v e table.
the educational gradients of women’s and men’s fertility intentions across parities, and to serve as an outcome variable in the regression models aimed at explaining the variation in the educational gradient across individuals’ socio-demographic
characteristics and countries. The effect sizes are also the outcome variables in
the meta-regressions that use random effects. The random approach postulates that
the ESs vary from study to study according to the underlying sample, and that a theoretically infinite number of study-specific ESs would then be distributed around some mean. The ES in the performed studies has to be interpreted as just a (random) sample of a particular given distribution of ESs (Borenstein et al. 2010). A main
advantage of considering random effects is that the ES variance can be decomposed
into two parts: a between-study variance that refers to the differences across studies,
and a within-study variance that refers to the differences across models in the same
study. The regression equation of the random effects model can be formalised as
follows:
yi=α+θ+βxi+εi+μi, εi ∼N(0, σ2i), μi ∼N(0, τ2) (2)
The model assumes two different types of effect sizes, a within and an across
study effect size:
yi =θi+εi, εi ∼N(0, σ2i) (3)
θi =θ+βxi+μi, μi∼ N(0, τ2) (4)
Here,yiis the estimated effect size in studyiandθiis the true effect in this study.θ,
on the other hand, is the overall true effect. The disturbance of the estimation ofyiεi,
is assumed to be standard normal distributed.σ2i in (3) is the within-study variance,
andτ2in (4) is the variance across studies.
In the computation of the effect sizes, several challenges had to be faced. First, we
had to re-compute (or standardise) the different educational level categories. In most
of the studies, education had been coded as a three-categorical variable of “low”, “medium”, and “high”; with “low” corresponding to compulsory primary education
and “high” corresponding to completed university education. This categorisation was kept as a benchmark for all studies, which had some important implications. In cases in which the open category “secondary education and above” was used for the highest educational attainment, this category was defined as “high”, while all categories below the complete high school were marked as “low”. Studies in which education was coded in a binary fashion could not be considered and were not included in the meta-sample. If education was treated as a continuous variable,
the coefficient, or its logarithm, was multiplied by the number of years needed to
complete tertiary education in order to obtain a comparable effect size. Another
major challenge concerned the estimation of the standard errors in cases in which the intermediate category “medium level of education” had not served as a reference group (for more on this issue, see Matysiak et al. 2014). The aggregation of two
single standard errors is usually a difficult task, and it is even harder if only
p-values are given; in such cases, the results of recalculations become more imprecise.
size uses the inverse of the study’s sample size. The underlying assumption here is that studies with larger sample sizes tend to have more precise estimates. Since the sample sizes vary greatly across our meta-sample, the inverse of the logarithmic sample size has been used.
For the sake of simplicity, the countries were grouped into four clusters in the meta-regression analysis: Northern European countries, Central European countries,
Southern European countries, and Eastern European countries (Table 2).5 The
clusters correspond to different family regimes and levels of women’s labour force
participation (Engelhardt et al. 2004), and largely reflect a grouping adopted by several other scholars investigating fertility levels in Europe (Frejka and Sardon 2004; Goldstein et al. 2009; Wilson 2013); with the exception of the UK, which is considered together with the Northern European countries. Northern European countries support the dual-earner family and the combining of work and family (Th´evenon 2008), and are characterised by favourable attitudes towards working mothers (Korpi 2000) and high levels of commitment to gender equality (Duvander et al. 2010). Western European countries are characterised by attitudes that view women as supplementary income providers, and that emphasise women’s roles as care-takers. Thus, these countries tend to follow a male breadwinner model and a female part-time career model (Baranowska-Rataj and Matysiak 2014). The Southern European countries also tend to follow the male breadwinner model, and are characterised by a labour market that does not favour women’s participation (Esping-Andersen 1999). Finally, the Eastern European countries are characterised by gender equality in the labour market (with high shares of women participating in the labour force and in full-time employment), and by an unequal gender division of childrearing and household tasks; this combination puts a so-called “double burden” on women (Kocourkov´a 2002). In the meta-sample, the structure of the clusters is unbalanced, with Central Europe being the most represented area (38% of all study lines), and Southern and Northern Europe being the least represented areas
(17% of all study lines each) (Table2). The effect sizes were tested for homogeneity
(Hedges and Olkin (1985), and the results confirmed that there is a large degree of
variation in the estimated effect sizes. The source of this variation might be related
to the different social, economic, and institutional contexts of fertility intentions
(especially the labour market and gender system); and to differences in the way
education was measured (whether continuously or discretely). The meta-regression was carried out in order to test for the influences of country- and study-specific
characteristics on the effect sizes. The software Stata/SE version 13.1 was used (see
Sterne 2009); more precisely, the command“metan” was employed for the forest
plot analysis and the command“metareg”was employed for the meta-regression
analysis.
5 Northern Europe refers to Finland, Norway, and the United Kingdom. Central Europe refers
to France, the Netherlands, and the German-speaking region (Austria, Germany, and Switzerland). Southern Europe refers to Italy. Eastern Europe refers to Hungary, Poland, Bulgaria, and Russia.
Table 2:
Description of the meta-sample by country and country cluster.
Papers∗ Study lines Regions Countries N % N % Southern Europe Italy 5 18% 10 12% Total 5 18% 10 12% Northern Europe Finland 1 4% 4 5% Norway 1 4% 2 2% UK 2 7% 3 3% Total 4 14% 9 10% Central Europe Austria 1 4% 4 5% France 3 11% 10 12% Germany 5 18% 13 15% Netherlands 1 4% 1 1% Switzerland 1 4% 4 5% Total 11 39% 32 37% Eastern Europe Bulgaria 3 11% 13 15% Hungary 2 7% 9 10% Poland 1 4% 8 9% Russia 2 7% 5 6% Total 8 29% 35 41% Total 13 28 100% 86 100%
Source:∗In five papers two countries are covered, one paper contains three countries.
Note:The number of study lines included in the table does not match the number of study lines displayed in the forest plots of Figures1and2, because in Figures1and2studies using the measures “wanting”, “desire”, or “ideal” have not been included.
3.5 The meta-regression
The outcome variable of the meta-regression is the effect size; i.e. the educational
gradient of fertility intentions as described in formula (4). Theθiin formula (4) can
be obtained as follows:
θi=θ+βX+μi, whileμi ∼N(0, τ2), (5)
whereXrepresents the set of regressors, or explanatory variables, andβis the set of
The explanatory variables include: (1) a dummy indicating whether the study used “number”, “timing”, or “general” intentions; (2) a dummy indicating whether the study used the term “intention” or “desires”; (3) the midpoint of the calendar interval in which the study was carried out; (4) a dummy indicating whether the study contained results for women only; (5) one dummy for parity one and one
dummy for parity two and above; and (6) one dummy for each group/cluster of
countries. In addition, in order to test hypothesis three, four macro-level indicators have been included in the regression: (1) the share of total female employment that was part-time; (2) the percentage of women with tertiary education among all women participating in the labour force; (3) the ratio of the female to the male labour force participation rate; and (4) the percentage of total female employment that
was temporary.6 The selection of these variables was inspired by a previous study
(Bellani and Esping-Andersen 2013), which suggested that family-friendly labour market policies positively influence the intentions of second and higher order births, especially of highly educated women. These labour market features have an impact not just on work-life balance, but on the likelihood that individuals will realise their
fertility intentions (Castro-Mart´ın and Mart´ın-Garc´ıa 2013). Moreover, “. . . these
variables are key to identifying the extent to which labour market regulation may help reduce (or increase) the potential opportunity cost of a new birth” (Bellani and Esping-Andersen 2013, p. 92). Since the starting point of the survey periods covered in the meta-sample is the year 1990, all four macro indicators refer to this
year.7 In addition, a trend component – the percentage change registered between
1990 and 2012, the time period covered in the meta-analysis – has been inserted into the model. We checked the robustness of the meta-regression results by running
different sensitivity tests. First, the country with the largest number of studies,
Germany, was dropped from the sample. Second, an additional dummy variable indicating whether the educational measure had been adjusted or recalculated was added to the models. Finally, the reference group was switched to Northern Europe.
None of the sensitivity tests altered the results reported in Table3.
6 Other macro-economic characteristics were tried, including the following: the percentage of women
in the public sector labour force, the share of women in temporary employment, the GDP per capita, the national investments in pre-primary childcare as a percentage of total investments, the UNDP gender inequality index, as well as the 1990–2011 trend components of these measures. None of these indicators were associated with any statistically significant results.
T able 3: Meta-r egr ession of e ff ect sizes of education on childbearing intentions. Beta coe ffi cients. Models V ariables (1) (2) (3) (4) (5) (6) (7) (8) (9) (10) Midpoint of the – data interv al − 0 . 0015 − 0 . 00872 − 0 . 0148 − 0 . 0042 0 . 0069 0 . 0017 0 . 0040 − 0 . 0122 − 0 . 0057 − 0 . 0098 (0 . 021) (0 . 021) (0 . 020) (0 . 021) (0 . 021) (0 . 021) (0 . 022) (0 . 0223) (0 . 022) (0 . 021) T ype of intentions General intentions (reference) Timing of intentions − 0 . 247 − 0 . 123 − 0 . 186 − 0 . 300 − 0 . 194 − 0 . 190 − 0 . 129 − 0 . 0835 − 0 . 143 − 0 . 104 (0 . 183) (0 . 170) (0 . 172) (0 . 184) (0 . 173) (0 . 187) (0 . 176) (0 . 189) (0 . 177) (0 . 182) Quantum of intentions 0 . 352 0 . 369 0 . 149 0 . 107 0 . 339 0 . 407 0 . 386 0 . 406 0 . 354 0 . 368 (0 . 412) (0 . 378) (0 . 385) (0 . 425) (0 . 395) (0 . 410) (0 . 406) (0 . 407) (0 . 385) (0 . 384) Continued
T able 3: Continued Models V ariables (1) (2) (3) (4) (5) (6) (7) (8) (9) (10) Expr ession of intentions Desire and others (reference) Intention 0 . 332 0 . 320 0 . 269 0 . 0429 0 . 217 0 . 299 0 . 279 0 . 387 0 . 283 0 . 326 (0 . 290) (0 . 275) (0 . 278) (0 . 321) (0 . 281) (0 . 289) (0 . 289) (0 . 336) (0 . 288) (0 . 280)
Gender Female (reference)
– – Male 0 . 00296 0 . 0547 0 . 0455 − 0 . 0538 0 . 0442 0 . 0384 0 . 0505 0 . 0515 0 . 0507 0 . 0430 (0 . 180) (0 . 167) (0 . 168) (0 . 179) (0 . 171) (0 . 180) (0 . 170) (0 . 172) (0 . 172) (0 . 177) P arity No child (reference) One child − 0 . 218 − 0 . 244 − 0 . 238 − 0 . 192 − 0 . 227 − 0 . 255 − 0 . 251 − 0 . 212 − 0 . 238 − 0 . 221 (0 . 185) (0 . 177) (0 . 181) (0 . 185) (0 . 185) (0 . 187) (0 . 183) (0 . 190) (0 . 180) (0 . 190) More than – one child − 0 . 448 − 0 . 308 − 0 . 302 − 0 . 356 − 0 . 311 0 . 577 ∗ − 0 . 298 − 0 . 281 − 0 . 289 − 0 . 293 (0 . 332) (0 . 309) (0 . 312) (0 . 330) (0 . 323) (0 . 339) (0 . 313) (0 . 318) (0 . 316) (0 . 329) Continued
T able 3: Continued Models V ariables (1) (2) (3) (4) (5) (6) (7) (8) (9) (10) Country cluster s Southern Europe (reference) – Northern Europe 1 . 099 ∗∗∗ − 0 . 855 − 1 . 189 ∗∗∗ − 1 . 061 ∗ − 1 . 063 ∗∗ (0 . 329) (0 . 596) (0 . 432) (0 . 537) (0 . 416) –– – Central Europe 1 . 015 ∗∗∗ − 0 . 814 − 1 . 023 ∗∗∗ 1 . 059 ∗∗ 0 . 975 ∗∗∗ (0 . 290) (0 . 527) (0 . 329) (0 . 507) (0 . 366) – Eastern Europe 1 . 103 ∗∗∗ − 0 . 641 − 1 . 189 ∗∗∗ − 0 . 940 ∗ 1 . 104 ∗∗∗ (0 . 279) (0 . 710) (0 . 363) (0 . 475) (0 . 314) Macr o-le vel indicator s 1990: P art-time emplo yment, female (% of total female emplo yment)* 0 . 0004 0 . 007 (0 . 006) (0 . 010) Continued
T able 3: Continued Models V ariables (1) (2) (3) (4) (5) (6) (7) (8) (9) (10) 1990–2011 Trend: P art-time emplo yment, female (% of total female emplo yment)* 0 . 427 ∗∗∗ 0 . 204 (0 . 118) (0 . 297) 1990: Labour force with tertiary education, female (% of female labour force)* − 0 . 033 ∗ 0 . 012 (0 . 019) (0 . 026) 1990–2011 Trend 0 . 052 0 . 092 (0 . 167) (0 . 181) 1990: Ratio of female to male labour force participation rate (%)* − 0 . 044 ∗∗ 0 . 003 (0 . 017) (0 . 030) Continued
T able 3: Continued Models V ariables (1) (2) (3) (4) (5) (6) (7) (8) (9) (10) 1990–2011 Trend − 2 . 073 0 . 922 (1 . 352) (2 . 917) 1990: V ulnerable emplo yment, female (% of female emplo yment)* 0 . 020 ∗ 0 . 002 (0 . 012) (0 . 014) 1990–2011 Trend 0 . 019 0 . 014 (0 . 034) (0 . 038) Constant 3 . 291 18 . 59 29 . 65 9 . 486 − 10 . 26 − 3 . 626 8 . 762 25 . 17 12 . 38 20 . 70 (42 . 87) (42 . 24) (40 . 25) (42 . 46) (42 . 57) (42 . 75) (44 . 87) (44 . 56) (45 . 05) (43 . 26) Study lines (obs) 86 86 86 86 86 86 86 86 86 86 Inter -study v ar 0 . 377 0 . 302 0 . 315 0 . 364 0 . 331 0 . 370 0 . 309 0 . 311 0 . 311 0 . 312 Note: Standard errors in parentheses. *p < 0.1, **p < 0.05, ***p < 0.01. *The W orld Bank, W orld De v elopment Indicators (2015). Atlas method [Data file]. Retrie v ed from http: // data.w orldbank.or g / indicator / .
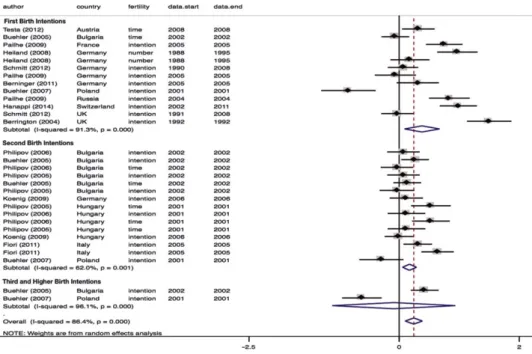
Figure 1 Panel (a):
Effect size of education on childbearing intentions by parity. Women of main reproductive ages.
4 Results
4.1 Meta-analytic evidence based on forest plots
The educational gradient of birth intentions is measured by the effect sizes; i.e. the
black dots in the forest plots of Figures1and2refer to women and men, respectively.
The variability of each study’s effect size, measured by the 95% confidence interval,
is represented by the black line that crosses the dots horizontally. The average
effect sizes by group/parity are displayed by the large diamond that appears at the
bottom of each parity group; and the overall average effect size across all parities is
given by the diamond at the very bottom of the graph that is centred on the broken
vertical line. The unbroken vertical line indicates the null value. Positive effect sizes
stand for cases in which highly educated individuals have higher intentions than their less educated counterparts. This interpretation requires some caution, because
an increase in the effect sizes could refer to the lower fertility intentions of less
educated individuals or the higher fertility intentions of highly educated individuals,
or a combination of both. Conversely, a decrease in the effect sizes could result from
the higher intentions of less educated individuals or the lower intentions of highly educated individuals, or a combination of both.
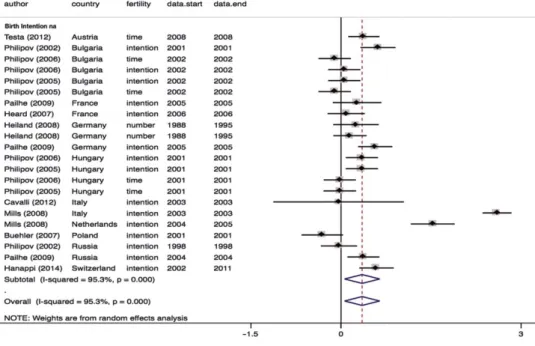
Figure 1 Panel (b):
Effect size of education on childbearing intentions. Women of main reproductive ages at any parity status.
To test hypotheses one and two, we compare the effect size of women and men
by parity. The educational gradient of first and second birth intentions is positive in
most of the studies for both women and men (Figures1and2). Gender differences
tend to become smaller at higher parities. The effect sizes of education on first
birth intentions are almost always positive among men, and tend to be positive
among women (Figure 2 and Figure 1, respectively; panel (a)). Poland and the
United Kingdom provide study lines with negative effect sizes for women (studies
by B¨uhler and Fratczak 2007 and N´ı Bhrolch´ain and Beaujouan 2011, respectively); this means that in such studies, the first birth intentions of less educated women
are higher than those of highly educated women. By contrast, the effect sizes
of women’s first birth intentions are positive and statistically significant in the
following countries: Austria, France, Germany, Russia, and Switzerland (Figure1,
panel (a)).
The black dots of second birth intentions are located mostly in the positive spectrum. As the positioning of the two diamonds at the bottom of the parity groups
indicate (Figure1, panel (a)), the effect size of education on second birth intentions
is clearly positive, and is even larger than the effect on first birth intentions.
Finally, as the positioning of the diamond at the bottom of the related parity
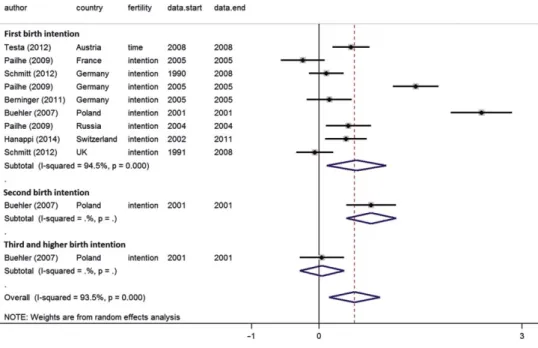
Figure 2 Panel (a):
Effect size of education on childbearing intentions by parity. Men of main reproductive ages.
intentions is still positive, but is not statistically significant. To sum up, the positive education-intention relationship is driven mainly by women who have just one child. The relationship is positive at parity zero and parity one, but is statistically significant for second birth intentions only.
Among men, there is no study line for which there is a significant negative effect
size of education on first birth intentions: among all of these nine study lines,
five show clearly positive effect sizes (Figure 2, panel (a)). The picture does not
change substantially for higher birth order intentions. Thus, the overall effect size of
education on childbearing intentions is clearly positive and statistically significant
(Figure2, panel (a)).
The variation in the effect of education across parities is greater among women
than among men. Overall, there are only a few exceptions to the positive education-intentions relationship: namely, two study lines at parity zero and one study line each at parity two and parity three among women, and two study lines at parity zero among men.
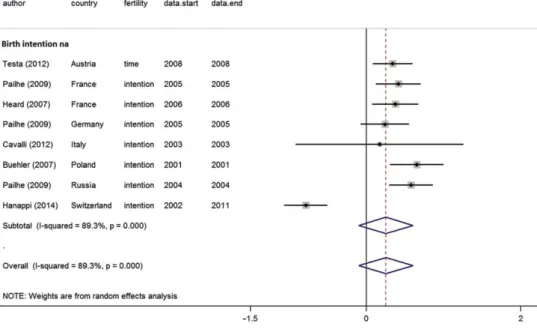
The meta-analytic results that refer to study lines without parity stratification provide further evidence of a generally positive educational gradient in fertility
intentions for both men and women (Figures 1 and2 panel (b)). To sum up, the
Figure 2 Panel (b):
Effect size of education on childbearing intentions. Men of main reproductive ages at any parity status.
attainment on birth intentions is larger among men than among women; and that among women, it is bigger for second birth intentions than for first birth intentions.
4.2 Meta-analytic evidence based on regression findings
In order to account for the cross-regional differences in the educational gradient of
birth intentions, we regressed the effect sizes on a set of country clusters dummies
(model 2, Table 3); then separately on a set of macro-level indicators (models 3
to 6, Table 3); and, finally, on both sets of covariates at a time (models 7 to 10,
Table3). In model 1, we included several control variables in the following order:
the midpoint of the time covered by the study, two dummies indicating the type of intention (i.e. general childbearing intentions, the timing of births, or the number of children), one dummy indicating whether “intentions” or “desires” were used in the study, one dummy for gender, and two dummies denoting the actual parity status (i.e. one child or two or more children). These explanatory variables were kept in all models (1 to 10). We set Southern Europe (only Italy is available in this group) as a reference category. The educational gradient of fertility intentions is lower in all clusters of countries than it is in Italy (model 2). By combining this finding with the results from the forest plots, it becomes clear that the most relevant geographical
divide in the educational gradient of fertility intentions is between Southern and Northern Europe, which, respectively, have the largest and the smallest educational
gradient of birth intentions. To account for cross-regional differences and to test
the third hypothesis, we included in the regression models four macro-level labour market indicators. The results show that all of these indicators have a statistically
significant effect on the educational gradient of fertility intentions, albeit in different
ways. On the one hand, the share of women with tertiary education among all women participating in the labour market and the gender ratio in labour force
participation (as well as its trend component) have negative effects on the effect
size; i.e. they reduce the educational differences in fertility intentions (models 4
and 5, respectively). On the other hand, the trend component of female part-time employment and the percentage of women in vulnerable employment have positive
effects on the effect sizes; i.e. they increase the educational differences in fertility
intentions (models 3 and 6, respectively). If, however, country clusters dummies
are included in the models, the effects of these labour market macro indicators
decrease in magnitude and even lose their statistical significance (models 7 to 10), which implies that these labour market features explain a significant portion of
the cross-cluster variance in the effect size of education on birth intentions, as
our third research hypothesis suggested. The indicator of inter-study variance,
which shows how much the effect sizes vary between the single studies, can be
interpreted as a measure of model fit: the smaller it is, the better the selected control variables explain the variance between single studies. According to this interpretation, model 2, which includes the set of country cluster dummies, provides the best fit for the data. This finding suggests that the diversity across countries is not explained by labour market indicators alone.
5 Concluding remarks
This investigation sought to validate empirical evidence of a positive education-fertility intentions link in Europe (Testa 2014). We conducted a meta-analysis of research published between 1990 and 2011 on fertility intentions using 86 study lines for 13 European countries. The application of a meta-analytical approach to the study of fertility intentions is entirely new in the literature. Given that reproductive decisions are sequential and individuals’ life courses are gendered, we focused on the first and second birth intentions of women and men separately. In addition, we controlled for possible confounders (such as age, partnership status, and employment status) by selecting only studies that provided regression estimates. Finally, we covered several geographical regions and grouped studies into clusters
of countries that reflect different economic, institutional, and policy contexts.
The meta-analysis revealed a positive educational gradient of both first and second birth intentions among both men and women. Thus, our findings lend support to previous cross-country empirical research that found a positive correlation between education and fertility intentions in Europe (Testa 2014). As predicted, the slope of
the gradient was shown to be steeper for men than for women; and to be more pronounced for second than for first birth intentions, especially among women (second research hypotheses). The relationship between educational attainment and birth intentions was also found to be positive among women and men at the start of childbearing; i.e. among those who were forming their first birth intentions (first research hypothesis). For this group, the correlation was found to be stronger among
men than among women, as the finding that the effect size is larger in the men’s than
in the women’s forest plot suggests.
One potential explanation for these gender differences is that the income effect
is more important than the substitution effect among men than among women. It is
possible that men have higher intended fertility than women across parities because men tend to have more financial resources and to face lower economic costs when
having children (Berrignton 2004). The parity differences can be read in light of the
persistence of the two-child family norm, which is, surprisingly, just as common among the most emancipated social group of highly educated women (Testa 2014) and men as it is among other educational groups. We speculate that this outcome is attributable to the unique reasons that drive highly educated people to have a first and a second child, which are, respectively, the desire to become a parent and the
desire to provide the first child with a companion. Additionally, parity differences
can be explained by evidence showing that highly educated women tend to have their children over a shorter time period because they start later, and thus have less time to reproduce before reaching the end of their fertile period (time squeeze) (Kreyenfeld 2002). Hence, if highly educated women are at parity one, they will be more likely than their less educated counterparts to be observed while planning their second birth. Another possible explanation is related to the selection stemming from a parity-specific analysis; i.e. there are unobservable variables that could be correlated with the probability of having a child in parity n (in this case, zero), as
well as with the probability of intending to have a child of the next order, n+1 (in
this case, one). Thus, the women and men who are at parity one are also more likely to intend to have a second child (self-selection) (Kreyenfeld 2002).
The meta-data could not tell us whether this positive correlation emerged only recently as a result of the implementation of policies designed to facilitate work-family balance, or had been present in earlier decades. We were unable to answer this question because in the meta-sample collection, there were too few studies for the same countries across time, and we could not go back earlier than 1990. The finding in the meta-regression that the midpoint of the data interval used in the study line lacked statistical significance suggests that there was no temporal change in the educational gradient of birth intentions in the years 1990–2011.
In support of the third research hypothesis, we found that the educational gradient of birth intentions was positively correlated with the trend in the share of women in part-time employment: in contexts in which women increasingly opted for part-time
employment, the educational differences in birth intentions were larger. Women
often choose to work part-time to facilitate the combining of work and family life. This result therefore suggests that more educated women could be encouraged to
have larger families by an increase in the availability of part-time work, which would make it easier for them to have both a career and a family with (more) children. Moreover, the educational gradient of birth intentions was found to be positively correlated with the share of women in vulnerable employment arrangements. The
most plausible explanation for this finding is that the largest educational differences
were driven by the lower fertility intentions of the less educated women who experienced more labour market vulnerability.
In line with the third research hypothesis, we found that gender equality in labour force participation and the share of highly qualified women in employment were reducing the educational gradient of birth intentions. This suggests that labour markets supportive of working mothers can perhaps ease the opportunity costs of childbearing for lower educated women, and can therefore encourage them to develop fertility plans that are more similar to those of their more educated counterparts. Alternatively, labour markets supportive of working higher educated mothers might allow them to be more focused on their careers, and in turn reduce their fertility intentions for additional children, hence making them more similar to the intentions of their lower educated counterparts.
This study has several caveats, which may provide direction for future research. First, the criteria of cross-country comparability and quality used in the selection of the meta-sample led us to sharply reduce our initial collection of papers: the sample of 161 papers was narrowed to just 23 papers, and almost none of these remaining papers examined third or higher order birth intentions. This suggests that although the number of studies on reproductive intentions has increased considerably in recent decades, this research topic remains under-investigated.
Second, differences in the educational gradient (size effects) cannot be clearly
traced back to elevated intentions among the highly educated, and the source of
the change in the effect sizes in the educational gradient remains unknown. This
suggests that there is an opportunity to complement this quantitative literature review with statistical analyses based on cross-country comparative datasets; and to include other dimensions such as enrolment in education and field of education, both of which are very relevant for reproductive choices (Blossfeld and Huinink 1991; Hoem et al. 2006; Tesching 2012). Third, because only a few countries have study lines available for several years, it was not possible to conduct deep
investigations into the temporal trends of national patterns and the effects of changes
in institutional support for families. Furthermore, the distribution of study lines across parities was very unbalanced, with some countries providing study lines for all parity statuses, and others providing study lines for just one parity status (either zero or one child). Gender distribution was also unbalanced, with some countries
providing study lines for both men and women, and other countries offering study
lines for women only.
The limited availability of study lines by country forced us to cluster together
countries with different welfare regimes, institutional contexts, and labour markets,
like the UK, Norway, and Finland. While we acknowledge this limitation, we can reasonably assume that the ranking of the countries clusters in the meta-analytic