IJPBCS
Genotype by Environment Interaction on Yield Components
and Stability Analysis of Elite Cassava Genotypes
*
1Rotich D. C.,
2Kiplagat O.K.,
3Were V. W.
1Department of Biotechnology University of Eldoret P.O Box 1125-30100, Eldoret, Kenya
2Head of Department, Agriculture and Biotechnology, University of Eldoret, P.O. Box 1125-30100, Eldoret, Kenya 3Senior Plant Breeder, Kalro Kakamega, P.O Box 169-50100 Kakameg, Kenya
Newly developed varieties can only contribute to increased productivity if high producing varieties are released in production niches they are adapted to. In order to enhance adoption of new improved cassava varieties in western Kenya, a study was conducted to evaluate the effects of genotype by environment interaction (GEI) on agronomic and farmer preferred traits of cassava and to asses yield stability of 16 cassava genotypes. The study was conducted in randomized complete block design with three replications across five different environments of western Kenya. AMMI analysis of variance identified highly significant (P= 0.001) GEI effects for plant height, height at first branching, and fresh root yield. Generally, GEI effects accounted for 14.98%, 24.64% and 28.3% variability in PH, HB, and FRY respectively. GGE biplot analysis shows that MM06/0138, MM96/9308, MM97/0293, MM98/3567, MM06/0074, MM96/4271 were high yielding and stable genotypes. AMMI stability value revealed that genotype MM06/0143 combined high stability for plant height, height at first branching, number of storage roots and fresh root yield. Genotypes MM06/0138, MM98/3567, MM96/9308, MM97/0293, and MM06/0074 outperformed the check in storage roots yield exhibited high yields in farmer preferred traits and were classified as stable genotypes. Therefore, recommended for release to farmers.
Key Words: Elite cassava, Farmer preferred traits, Genotype X Environment interaction, AMMI analysis, GGE-biplot analysis
INTRODUCTION
Cassava (Manihot esculenta Crantz) is an important staple grown for its starchy tuberous roots. Its roots and leaves are suitable for human consumption as well as animal feed. The tuberous roots are an important source of carbohydrates while the leaves are cheap valuable source of proteins, minerals and vitamins A, B and C (Montagnac et al., 2009). The storage roots are also used as industrial raw materials like starch extractions for various industrial uses, breweries, pharmaceutical, and biofuel among other uses (Nweke, 2004; Jackson et al., 2014). Cassava is the second most important food crop after maize in Western and coastal regions of Kenya (Njeru & Munga, 2003). However, production level in Kenya is 11 t/ha, below the potential of 90 t/ha, which is attributed to low yield of popular varieties, poor access to quality planting material, lack of well adapted varieties, pests and diseases
(Mwango’mbe, et al., 2013). Cassava mosaic disease (CMD) and cassava brown streak disease (CBSD) are the leading yield limiting biotic constraints for cassava production causing an estimated loss of more than US$ 14 million per annum in CMD (Alabi, et al., 2015). Cassava genetic improvement has been difficult due to the biology of the crop (Ceballos et al., 2004).
*Corresponding Author: Rotich C. Damaris, Department of Biotechnology University of Eldoret P.O Box 1125-30100, Eldoret Kenya. Email: ([email protected] Tel: +254703276027. Co-Authors Email: 2[email protected], Tel: +254723967672, 3[email protected], Tel: +254729981023
International Journal of Plant Breeding and Crop Science
Vol. 5(1), pp. 361-369, March, 2018. © www.premierpublishers.org. ISSN: 2167-0449
Use of improved varieties is the current leading tool for solving viral disease challanges in cassava (Alabi, et al., 2015), hence continuous deployments of elite resistant cultivars are necessary as CMDs are known to evolve producing virulent strains while different strains of CBSD are being reported in Kenya (Mware, 2009). However, low adoption of the new improved varieties has been reported in western Kenya (Odendo et al., 2010; Woyengo & Omari, 2014).
In the last three decades, cassava breeding has majorly concentrated on increasing yields and resistance to pest and disease (Ceballos et al., 2004). However, there has been lack of focus on farmer preferred traits by breeding programmes which has been observed to be the major course of low adoption of improved varieties despite the high yield and resistance to common pests and diseases (Woyengo, 2011). Moreover, some of the improved varieties fail to perform well in target production niches due to lack of detailed stability studies of these traits. It’s therefore a prerequisite that cassava varieties should not only be released on the basis of average yield and reaction to diseases pests but also on the presence of farmer preferred traits and stability. The work of Achepong et al. (2013), identified longevity and disease resistance as two major attributes of cassava that influence adoption of improved varieties in Ghana. Njukwe et al. (2013) observed regional differences for farmer preference in cassava attributes and cassava genotypes in Cameroon, for instance farmers in Ebolowa and Bertoua preferred leafy, sweet roots and early branching varieties while those in Bamenda and Ngaoundere preferred tall, drought tolerant and in some cases flowering varieties. In Kenya the work of Were (2011), identified farmer preferred traits that encourage adoption of improved cassava genotypes by order of preference as high root yield, tall plants and lower height of first branching. However, no study has been reported on influence of environment on farmer preferred traits and stability of new improved cassava genotypes.
Genotype stability and adaptability are ultimate resources for achieving food security which is an allusive goal for Kenya and Sub-Saharan Africa at large (Muzari et al., 2012). Lobell (2009) stated that agricultural adaptability should be a priority in meeting food security presently and in future in the face of sever climate change. This is achieved by development of stable varieties of crops. Stability of performance of quantitative traits is influenced by genotype, environment and genotype by environment interaction (GEI) effects. GEI is important in plant breeding because it complicates demonstration of a superiority of a variety. An effective method which has been used to reduce GEI is stratification of environment such that the sub-region in which the breeder is developing improved varieties are somehow similar (specific adaptation). However, this is not mineable to breeding since even with the refinement of this technique the interaction of genotypes within a location in a sub-region and with environments encountered at the same location in different
years frequently remains too large (Crossa 1990). Moreover, Woyengo and Omari, (2014) clearly pointend out that it is not feasiable to breed for specific adaptation with current eratic climatic conditions and effect of climimate change hence breeding for stable varieties remains as the only viable option. Many statistical procedures have been advocated for the basis of analysis of GEI and stability of genotypes. Studies show that stability of performance are expected to become more relevant issues as greater emphasis is placed on sustainability of agricultural systems (Kang et al., 2012). The objective of this study therefore, was to evaluate GEI effects on agronomic and farmer preferred traits of cassava and to assess yield stability of 16 cassava genotypes across five environments of western Kenya.
MATERIALS AND METHODS
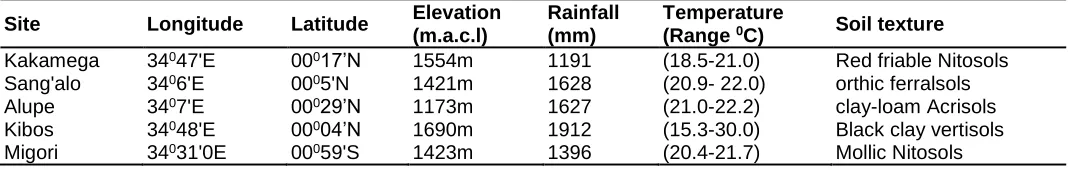
The study was conducted across five environments (Kakamega, Sang’alo, Alupe, Kibos and Migori), which represent major cassava growing zones of western Kenya, between 2014 and 2015. The experimental material consisted of 15 elite cassava clones (G1=MH95/0183 G3=MM06/0013, G4=MM06/0046, G5=MM06/0074, G6=MM06/0082, G7=MM06/0083, G8=MM06/0131 G9=MM06/0138, G10=MM06/0139, G11=MM0H6/0143, G12=MM96/2480, G13=MM96/4271, G14=MM96/9308, G15= MM97/0293, G16=MM98/3567) in advanced stage of yield trials performance and one local check (G2=migyera). Improved clones’ seeds were developed and introduced from International Institute of Tropical Agriculture (IITA). The clones were derived from half-sib progenies of elite varieties. They have been tested by Kenya agricultural livestock and research organization (KALRO) Kakamega for resistance to CMD and CBSD. The experiment was laid in randomised complete block design with three replications and established under rain fed conditions. No fertilizer nor pesticide were applied. Each experimental plot had six rows and 30 plants spaced of 1m by 1m between plants and rows.
Data Collection
Table 1: Agro-ecological description of experimental sites
Site Longitude Latitude Elevation (m.a.c.l)
Rainfall (mm)
Temperature
(Range 0C) Soil texture Kakamega 34047'E 00017’N 1554m 1191 (18.5-21.0) Red friable Nitosols Sang'alo 3406'E 0005'N 1421m 1628 (20.9- 22.0) orthic ferralsols Alupe 3407'E 00029’N 1173m 1627 (21.0-22.2) clay-loam Acrisols Kibos 34048'E 00004’N 1690m 1912 (15.3-30.0) Black clay vertisols Migori 34031'0E 00059'S 1423m 1396 (20.4-21.7) Mollic Nitosols
Root sample weighing 3-5kg was prepared, the weight of the sample was measured in air (Wa) using a digital weighing balance. The same sample was also measured in water (Ww). Specific gravity(x) was computed at:
Ww/ (Wa-Ww)
%DMC was computed using the formula DMC = (158.3x-142)100
%starch was computed using the formula starch = (112.1x-106.4)100
Statistical Analysis
Genotypic stability for each clone was computed using GenStat software, 14th edition. The additive main effects and multiplicative interactions (AMMI) statistical model suggested by Gauch and Zobel (1996) was used to analyze yield data to obtain (AMMI) analysis of variance and (AMMI) mean estimates as follows as follows:
Yger = µ + αg +βe + ∑ʎn ygn δen + ρge + Eger
Where: Yger = yield of genotype g in environment e for replicate r, μ = grand mean, αg = genotype mean deviation (genotype means minus grand mean), βe = environment mean deviation, n = number of principal component analysis (PCA) axes retained in the model, ʎn = singular value for PCA axis n,ygn = genotype eigenvector values for PCA axis n,δen = environment eigenvector values for PCA axis n, ρge = residuals, Eger = error term.
The AMMI stability value (ASV) proposed by Purchase et al. (2000) was used to quantify and rank genotypes according to the yield stability. The ASV has been defined as the distance from the coordinate point to the origin in a two-dimensional scatterplot of first interaction principal component axis (IPCA1) scores against the second interaction principal component axis (IPCA2) (Farshadfar et al., 2012). Since IPCA1 accounts for most of the GEI variation, the IPCA1 scores are weighted by the ratio of IPCA1SS (from AMMI ANOVA) to IPCA2 SS in the ASV formula as follows:
𝐴𝑆𝑉 = √{𝑆𝑆𝐼𝑃𝐶𝐴1
𝑆𝑆𝐼𝑃𝐶𝐴2(𝐼𝑃𝐶𝐴1 𝑠𝑐𝑜𝑟𝑒)}
2
+ (𝐼𝑃𝐶𝐴2 𝑠𝑐𝑜𝑟𝑒)2
The lower the ASV, the more stable a genotype is.
Another important point was further explained by Yan et al. (2007) that genotype and genotype-by-environment effects must be considered simultaneously to make a meaningful decision in selection. Significant genotype by environment interaction was also analyzed by GGE biplot which was also useful in ranking genotypes based on their average performance and stability for farmer preferred traits in cassava. The model for the GGE biplot based on singular value decomposition (SVD) of first two principal components is:
Yijj1i1j12i2j2ij
Where: Yij = measured mean of genotype i in environment j, = grand mean, j = main effects of environment j, + j = the mean yield across all genotypes in environment j, 1 and 2= are the singular values (SV) for the first and second principle components (PCA 1 and PCA 2) respectively. i1 andi2 = are eigenvectors of genotype i for PCA 1 and PCA 2 respectively; j1 andj2 = eigenvectors for environment j for PCA 1 and PCA 2, respectively. ij = residual associated with genotype i in environment j
RESULTS AND DISCUSSION
Table 2: AMMI analysis of variance for16 cassava clones evaluated across five agroecological zones of Western Kenya
PH (cm) HB(cm) NSR FRY (t/ha) DMC (%) STARCH Source Df MS %SS MS %SS MS %SS MS %SS MS %SS MS %SS
Total 239 2923 557 10.37 100.3 11.24 73.8
Treatments 79 8567*** 1584*** 28.72*** 288.9*** 20.84*** 162.5***
genotype 15 9119*** 20.20 4247*** 50.9 47.29*** 64.83 370.6*** 24.35 75.37*** 68.67 661.9*** 77.33
Environ 4 109651*** 64.81 7651*** 24.46 252.19*** 23.07 2701.7*** 47.35 19.76* 4.84 422.6*** 13.16
Block 10 474ns 43ns 1.05ns 7.1ns 7.08ns 19.7ns
GEI 60 1690*** 14.98 514*** 24.64 9.18ns 12.09 107.7*** 28.30 7.28ns 26.52 20.3ns 9.5
IPCA 1 18 3172*** 56.31 1132*** 66.13 15.18ns 49.59 178.7*** 49.79 15.25ns 30.00 37.5ns 55.46
IPCA 2 16 2104*** 33.2 524*** 27.20 9.49ns 27.55 104*** 25.72 5.22ns 26.67 18.4ns 24.2
IPCA 3 14 486*** 6.72 125** 5.69 6.64ns 16.86 84.8*** 18.38 4.68ns 23.33 11.7ns 13.45
IPCA 4 12 319** 3.77 25ns 0.98 2.74ns 6.00 32.7*** 6.11 1.10ns 20.00 7.1ns 6.97
Residuals 0 0 0
Error 150 114 50 1.33 7.1 6.46 30.6
*** Significant at (P≤0,001), ** (P≤ 0.01), *(P≤ 0.05) and ns = not significant respectively; PH = plant height, HB = plant height at first branching, NSR = number of storage roots per plant, FRY =Fresh root yield, DMC = dry matter content, SS=% sum of squares, IPCA=interaction principle component.
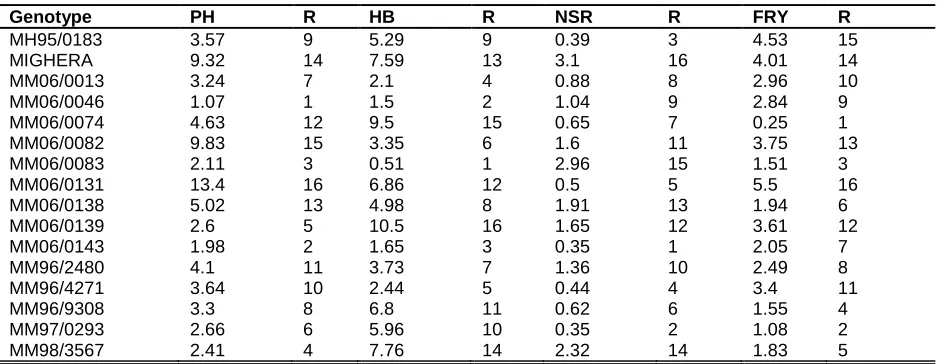
Table 3: Ranking of 16 cassava genotypes according to their AMMI stability value evaluated for PH, HB, SR and FRY
Genotype PH R HB R NSR R FRY R
MH95/0183 3.57 9 5.29 9 0.39 3 4.53 15
MIGHERA 9.32 14 7.59 13 3.1 16 4.01 14
MM06/0013 3.24 7 2.1 4 0.88 8 2.96 10
MM06/0046 1.07 1 1.5 2 1.04 9 2.84 9
MM06/0074 4.63 12 9.5 15 0.65 7 0.25 1
MM06/0082 9.83 15 3.35 6 1.6 11 3.75 13
MM06/0083 2.11 3 0.51 1 2.96 15 1.51 3
MM06/0131 13.4 16 6.86 12 0.5 5 5.5 16
MM06/0138 5.02 13 4.98 8 1.91 13 1.94 6
MM06/0139 2.6 5 10.5 16 1.65 12 3.61 12
MM06/0143 1.98 2 1.65 3 0.35 1 2.05 7
MM96/2480 4.1 11 3.73 7 1.36 10 2.49 8
MM96/4271 3.64 10 2.44 5 0.44 4 3.4 11
MM96/9308 3.3 8 6.8 11 0.62 6 1.55 4
MM97/0293 2.66 6 5.96 10 0.35 2 1.08 2
MM98/3567 2.41 4 7.76 14 2.32 14 1.83 5
Plant height (PH), height at first branching (HB), number of storage roots per plant (NSR) and fresh root yield (FRY)
branching and fresh root respectively, meaning more than 24% variability observed in height at first branching and fresh root yield is due to GEI effects. In spite of this, the magnitude of the genotype sum of squares for plant height and height at first was branching was larger than that of GEI (20.2% and 50.9%) respectively which indicates presence of moderate control of genotype effects over genotype by environment interaction effects for these traits.
On the other hand, there was non-significant GEI effects for number of storage roots, dry matter content and starch. The phenomenon was also the same as reported by Peprah et al. (2013) who observed non-significant GEI for dry matter content. This finding also agrees with those of Aina et al. (2007) who reported non-significant GEI effects for number of storage roots and dry matter content. Similarly, Benesi et al. (2004) reported non-significant GEI for starch.
An obvious deduction from non-significant GEI effects on number of storage roots, dry matter content and starch is that, genotypes might have similar responses across the
locations in which they were evaluated and that they can consistently be evaluated under any of the locations used for this study in impending performance trials. This view is in conformity with the view of Peprah et al. (2013) who found non-significant GEI effects for dry matter content and reported that fewer environments may be needed to distinguish clones with high and stable performance for this trait. In other words, evaluating genotypes for these traits concurrently in the various locations used for these studies in consequent evaluation trials might not be important. Thereby, offering an opportunity to manage inadequate means available for testing programme (Tonk et al., 2011).
storage roots and fresh root yield. MM98/3567 combines stability for plant height and fresh root yield while MM97/0293 combines stability for plant height, number of storage roots and fresh root yield. Genotypes MM06/0046, MM06/0083, MM06/0143, and MM06/0074 were stable genotypes for plant height, height at first branching, number of storage roots per plant and fresh root yield respectively. These suggest the possibility of identifying clones exhibiting stable performance in both agronomic and farmer preferred traits.
GGE Biplot analysis
According to Yan et al. (2007) genotype-by-environment interaction effects must be considered simultaneously to make a meaningful decision in selection. These requires biplot analysis that considers genotype and GEI simultaneously. Additionally, genotypes should be evaluated based on combined performance of the mean across environments with their stability which also necessitates the use of a biplot analysis.
Analysis of GGE biplot further elucidated the yield performance and stability of genotypes across the study sites for fresh root yield and number of storage roots. Analysis of yield stability of genotypes was evaluated using GGE biplot by an average environment coordination (AEC) method on fresh root yield and number of storage roots. In this method, the average principle components are used in all environments, as depicted in Figures 1 and 2. The AEC ordinate separate genotype with below average means from those with above average means. A line is then drawn through this average environment axis and serves as the abscissa of the AEC.
The arrow points to a greater genotype main effects, the AEC ordinate and either direction away from the biplot origin indicates greater GEI effects and reduced stability. Hence, the stability of a variety or environment was determined by the length of the vector from genotype marker to the average environment coordinate (AEC) abscissa. The vector which was closer to the AEC abscissa was considered to have less interaction effects and hence regarded as stable. A clone located at the origin is not influenced by environment in any way hence it would rank the same in all the environments and therefore considered as the most stable.
In Figure 1 the mean number of storage root per plant and stability performance of cassava genotypes was depicted. The genotypes were ranked along the average environment co-ordinate (AEC) x-axis with an arrow indicating the highest mean. Thus, results revealed that G16 (MM98/3567) which was closer to the AEC had the highest number of storage roots while G4 (MM06/0046) was the lowest yielding genotype because they were further away from the AEC axis. However, the lengths of vectors from genotype marker to the AEC abscissa
concentrated around zero for most of the clones suggesting that the candidate clones were stable for this trait (number of fresh root yield). Though clones G2 (migyera), G11 (MM0h6/0143) and G4 (MM06/0046) revealed some displacement on the Y-axis from the origin, it’s clear that the PC scores for these clones in this Y’-axis is less than one (near zero) for the three clones hence it was adjudged that all the candidate clones were stable for this trait.
Figure 1: Mean performance and stability of 16 cassava genotypes (G1 – G16) at five environments (K:Kakamega, S:Sangalo, A:Alupe, B:Kibos, M:Migori) for number of storage roots.
Figure 2: Mean performance and stability of 16 cassava genotypes (G1-G16) at five environments (K:Kakamega, S:Sangalo, A:Alupe, B:Kibos, M:Migori) for fresh root yield.
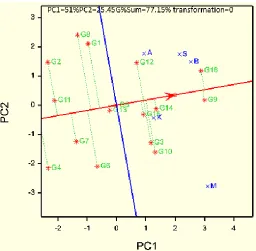
The polygon view of the GGE biplot explicitly displays the ’’which won where pattern’‘ and hence is a concise summary of the GEI pattern (Figures 3 and 4) .The polygon is formed by connecting the markers of the genotypes that are further away from the biplot origin such that all the genotypes are contained in the polygon (Yan et al., 2007; Akinwale, 2011).Convex-hull are drawn from the biplot origin which divides the biplot into sectors that demarcate mega-environment the vertex genotypes in a sector of environment are considered the most stable for that environment. In Figure 3, the “which won where pattern” of the GGE biplot on number of storage roots grouped all the environments in one sector. Moreover, the genotypes clustered around the origin of the biplot revealing that the genotypes had the same response across the environments. Generally, the GGE biplot on number of storage roots accounted for 95.74% of the total GEI variation due to GEI effects on number of storage roots with PC1 and PC2 accounting for 87.52% and 8.22%, respectively.
Figure 3: “Which won where pattern” of GGE biplot for sixteen clones (G1-G16) at five environments (K:Kakamega, S:Sangalo, A:Alupe, B:Kibos, M:Migori) on number of storage roots.
Figure 4: “Which won where” pattern of GGE biplot for 16 cassava genotypes (G1-G16) at five environments on fresh root yield
Another important feature of GGE biplot analysis is its ability to evaluate test environments for effective selection of superior genotypes (Yan et al., 2007). In Figure 5 the discriminatory power of the environments was detected by the length of the vector from the origin of the GGE biplot to the coordinate of the location. The length of the vectors approximates the standard deviation within respective environments which is a measure of the discriminating ability of the environments (Yan, 2005). The longer the vector, the more discriminatory power. Migori environments was the most discriminating but the least representative environment having the long vector length from biplot origin with large absolute PC2 scores and large PC1 scores. Contrarily, Kakamega environment was the least discriminative and the most representative environment based on short vector length from the origin and having large absolute PC2 scores and small PC1 scores. However, Kibos environment was considered as ideal environment for selection of superior clones based on its discriminating ability and representativeness. Noerwijati et al. (2013) identified Kediri environments as ideal for selection of superior cassava genotypes based on the discriminating and representative view of the GGE biplot having small absolute PC2 scores and large PC1 scores. Likewise, Agyeman et al. (2015) identified (PK08) as the ideal environment having a small angle (representativeness) to the average environment axis and a long vector length from the biplot (discriminating ability) in a cassava study using GGE biplot analysis. Generally, if financial limitations allow only few test environments Kibos should be the first choice. Migori environments cannot be used in selecting superior genotypes, but it is useful in ‘culling’ unstable genotypes.
Figure 5: Discriminating power of the five environments for 16 cassava genotypes (G1 to G16)
CONCLUSION
Genotype by environment interaction was significant for fresh root yield, plant height, and height at first branching indicating the need of assessing genotypes for stability and adaptability before effective selection can be done. Six genotypes (MM98/3567, MM06/0138, MM96/9308, MM97/0293, MM06/007, and MM96/4271) were classified as stable and outperformed the check cultivar in fresh root yield across five environments of western Kenya. On the other hand, number of storage roots, dry matter content and starch are not influenced by GEI, this implies that evaluation of genotypes for these traits can effectively be done in a single location and variety selection can effectively be done based on the mean performance of genotypes.
ACKNOWLEDGEMENT
Exceptional appreciations to Alliance for Green Revolution in Africa (AGRA) foundation for funding this study. The assistance in field activities provided by the technical staff of Kenya Agricultural Livestock and Research organization Kakamega, Mr. Njaro, Mr. Otiya, James and Madam Linnet is acknowledged and appreciated.
CONFLICT OF INTEREST
REFERENCES
Acheampong, P.P., Owusu, V. and Nurah G.K. (2013). Farmers Preference for Cassava Variety Traits: Empirical Evidence from Ghana. Contributor Paper Prepared for Presentation of African Association of Agricultural Economics. Hammet, Tunisia.
Adjebeng-Danquah, J., Manu-Aduening, J., Gracen, V. E., Asante, I. K., & Offei, S. K. (2017). AMMI stability analysis and estimation of genetic parameters for growth and yield components in cassava in the forest and Guinea Savannah ecologies of Ghana. International Journal of Agronomy, 10. doi: https://doi.org/10.1155/2017/8075846
Agyeman, A., Parkes, E., & Peprah, B. (2015). AMMI and GGE biplot analysis of root yield performance of cassava genotypes in the forest and coastal ecologies. International Journal of Agricultural Policy and Research, 3(3), 222-232. doi: http: //dx.doi.org/10.15739/IJAPR.034
Aina, O., Dixon, A., & Akinrinde, E. (2007). Additive main effects and multiplicative interaction (AMMI) analysis for yield of cassava in Nigeria. Journal of Biological Sciences, 7(5), 796-800.
Akinwale, M. G., Akinyele, B. O., & Dixon, A. G. (2011). Genotype X Environment Interaction and Yield Performance of 43 Improved Cassava (Manihot esculenta Crantz) Genotypes at Three Agro-climatic Zones in Nigeria. British Biotechnology Journal, 1(3), 64-68.
Alabi, J., Legg, J., & Mulenga, R. (2015). Virus diseases of tropical and subtropical crops. In P. Temnant, & G. Fermin (Eds.). CAB International. doi:10.1079/9781780644264.0042
Benesi, R. M., Labuschgne, M. T., & Dixon, A. G. (2004). Genotype X Environment interaction effects on native cassava starch use in the commercial sector. African Crop Science Journal, 12(3), 205-216.
Ceballos, H., Igelesias, C. A., Pérez, J. C., & Dixon, A. G. (2004). Cassava breeding: opportunities and challenges. Plant Molecular Biology, 56, 503-516. doi: 10.1007/s11103-004-5010-5
Crossa, J. (1990). Statistical analyses of multilocation trials. 44, 55-85. Advances in Agronomy, 44, 55-85. De Vries, S. C., Van de ven, G. W., Van Ittersum, M. K., &
Giller, K. E. (2010). Resource use efficiency and environmental performance of nine major biofuel crops, processed by first-generation conversion techniques. Biomass and Bioenergy, 34, 588-601.
Farshadfar, E., Mahamodi, N., & Yaghotipoor, A. (2012). AMMI stability value and simultaneous estimation of yield and yield stability in bread wheat (Triticum aestivum L.). Australian Journal of Crop Science, 5, 1837-1844.
Gauch, H., & Zobel, R. W. (1996). AMMI analysis of yield trials. In M. S. Kang, & H. Gauch (Eds.). USA: CRC Press.
Jackson, B., Oladipo, N., & O., A. M. (2014). Cassava: A potential crop for industrial raw material in Nigeria. International Journal of Life Science, 3(3), 105-112. Kang, M. S., Prabhakaran, V., & Mehra, R. B. (2012). Plant
Breeding: Mendelian to Molecular Approaches (Vol. 23). (H. K. Jain, & M. C. Kharkwal, Eds.) New Delhi, India: Springer.
Lobell, D. (2009). Prioritizing climate change adaptation needs for food security in 2030. Science, 319(5863), 607-610. doi:10.1126/science.1152339
Montagnac, A. J., Christopher, R. D., & Tanumihirdjo, S. (2009). Nutritional value of cassava for use as a staple food and recent advances for improvement. Comprehensive Review in Food Science and Food Safety, 8(3), 186-194. doi:10/1111/j.1541-4337.2009. 00077.x
Muzari, W., Gatsi, W., & Muvhunzi, S. (2012). The impacts of technology adoption on smallholder agriculture: A review. Journal of Sustainable Development, 5(8), 69-77.
Mwango’mbe, A. W., Mbugua, S. K., Olubayo, F. O., Ngugi, E. K., Mwinga, R., Munga, T., & Muiru, W. M. (2013). Challenges and Opportunities in cassava production among the rural households in Kilifi County in the coastal region of Kenya. Journal of Biology, Agriculture and Healthcare, 3(10), 3033.
Mware, B. A. (2009). Transmission and distribution of cassava brown streak virus disease in cassava growing areas of Kenya. Journal of Applied Biosciences, 864-870.
Mware, B. O., Narla, R., Amata, R., Olubayo, F., Songa, J., Kyamanyua, S., & Ateka, E. M. (2009). Efficiency of cassava brown streak virus transmission by two whitefly species in coastal Kenya. Journal of general and molecular Virology. 1(4), 40-45.
Njeru R. W. and T.L. Munga. (2003). Current status of Cassava Brown Streak Disease in Kenya. In Legg J.P and Hillocks, R.J. (eds) Cassava Brown Streak Virus Disease: Past, Present and Future. Proceedings of an International workshop, Mombasa Kenya, 27-30 October 2002. P12-13. Natural Resources International, Aylesford.
Njukwe, E., Hanna, R., Kirscht, H., Araki, S. (2013). Farmers Perception and criteria for cassava variety preference in Cameroon. African Study Monographs, 34(4), 221-234.
Noerwijati, K., & Budiono, R. (2013). Yield and Yield Components Evaluation of Cassava (Manihot esculenta Crantz) Clones in Different Altitudes. Energy Procedia, 65, 155-161.
Nweke, F. I. (2004). New challenges in the cassava transformation in Nigeria and Ghana.International Food Policy Research Institute. Washington, D.C
<http://www.kainet.co.ke/fileadmin/publications/10thpr oceedings/Poster/Adop_Im act_Cassava.pdf>
Peprah, B. B., Ofofi, K., Asante, I. K., & Parkes, E. (2013). Performance of nine cassava (Manihot esculenta Crantz) clones across three environments. Journal of Plant Breeding and Crop Science, 5(4), 48-53.
Purchase, J., Hatting, H., & Van Deventer, S. (2000). Genotype x environment interaction of winter wheat (Triticum aestivum L.) in South Africa: II. Stability analysis of yield. South African Journal of Plant and Soil, 17, 101-107.
Tonk, F., Ilker, E., & Tosun, M. (2011). Evaluation of genotype x environment interaction in maize hybrids using GGE biplot analysis. Crop Breeding and Applied Biotechnology, 11(1), 01-09.
Woyengo, V. W. (2011). A comparative analysis of conventional and participatory cassava breeding approaches in western Kenya. Doctorial dissertation, university of KwaZulu-Natal, South Africa.
Woyengo, V. W., & Omari, O. M. (2014). Genotype X environment interaction effect on farmer preferred traits of cassava varieties adapted to the tropical climate conditions of Western Kenya. American Journal of Experimental Agriculture, 686-702. doi:10.9734/AJEA/2014/6271
Yan, W (2005). Use of biplot analysis in crop breeding. Proceedings of the Eastern Wheat workers and Southern Small Grain Conference (pp. 7-30). Greek: Bowling.
Yan, W., & Kang, M. S. (2003). GGE biplot analysis: A graphical tool for breeders, geneticists and agronomists. Boca Raton: FL CRC press.
Yan, W., Kang, M. S., Baoluo, M., Woods, S., & Baoluo, M. G.-b.-e.-6. (2007). GGE biplot Vs. AMMI analysis of genotype-by-environment data. Crop science, 641-653. doi:10.2135/Cropsci2006.06.0374
Accepted 3 March 2018
Citation: Rotich D.C., Kiplagat O.K., Were V. W. (2018). Genotype by Environment Interaction on Yield Components and Stability Analysis of Elite Cassava Genotypes. International Journal of Plant Breeding and Crop Science 5(1): 308-316.