Vol.9 (2019) No. 2
ISSN: 2088-5334
The Optimization of Temperature and Length of Extraction of Local
Corn Silk Powder Using Response Surface Methodology
Haslina
#,^, Danar Praseptiangga
#,*, V.Priyo Bintoro
#,+, Bambang Pujiasmanto
$ #Graduate School Program of Sebelas Maret University (UNS), Surakarta 57126, Indonesia Central Java E-mail:[email protected]
^
Faculty of Agriculture Technology, Semarang University, Semarang 50196, Central Java, Indonesia
*
Department of Food Science and Technology, Faculty of Agriculture, Sebelas Maret University, Surakarta 57126, Central Java, Indonesia E-mail:[email protected]
+
Department of Agriculture, Faculty of Animal and Agricultural Sciences, Diponegoro Univesity, Semarang 50275, Central Java, Indonesia E-mail:[email protected]
$
Department of Agrotechnology, Faculty of Agriculture, Sebelas Maret University (UNS), Surakarta 57126, Central Java, Indonesia E-mail:[email protected]
Abstract— Corn silk from female flowers consists of a group of stigmas that are smooth, soft, and look like threads and yellowish silk. Corn silk is rich in phenolic compounds, especially flavonoids and high natural antioxidant compounds. This content varies according to the corn varieties. Bisma variety is one of the many local corn varieties grown in Temanggung, Central Java. The first step in separating phenolic compounds is extraction with solvents. Methanol is one of the solvents that are often used in the extraction of phenolic compounds. Some of the contributing factors affect the rate and quality of extraction on the components of bioactive compounds, two of which are temperature and length of extraction. This study aims to determine the optimum condition of extraction of corn silk from local Bisma varieties using Response Surface Methodology. The experimental design used was factorial in the Randomized Block Design (RBD) with two factors and three replications. The local corn silk of the Bisma variety, 80% methanol solvent concentration and a ratio (1:20) were extracted with a length of extraction (60, 70, 80 and 90) minutes and a temperature of 40° C, 50°C, 60°C and 70°C. The extraction results from each corn silk were analyzed for chemical and phytochemical characteristics. The optimum condition for extracting corn silk powder was obtained at 40oC and the extraction time was 60 minutes. In this condition, chemical content produced is as follow: 0.80% of soluble fiber, 0.58% of insoluble fiber, 1.38% of total fiber, 2.36% of moisture content, 2.50% of ash content, 1.29% of fat content, protein content of 16.93%, and carbohydrate content of 78.20%, and phytochemical content were total phenol of 5342.45µg EAG / g, total flavonoids of 167.45µg EAG / g, beta-sitosterol of 996.53 ppm, antioxidant activity of 50.41 %.
Keywords— corn silk; extraction; dietary fiber; phytochemicals; proximate; response surface methodology.
I.INTRODUCTION
Corn silk is a by-product or waste which commonly used as traditional medicine such as smoothing urine and lowering blood pressure [1]. It contains bioactive compounds such as volatile oils, steroids, alkaloids, flavonoids, chlorogenic acids and other phenolic compounds [2], [3]. Corn silk contains secondary metabolites including flavonoids, saponins, tannins, flobatanin, phenol, alcohol, terpenoids, glycosides, proteins, carbohydrates, fiber, vitamin B, vitamin C, vitamin K, Zn, Ka, Ca, Mg and P, steroids such as stigma sterol, alkaloids, saponins, tannins, flavonoids, anthocyanins, protokatekin, vanillic acid,
hesperidin derivatives and quercetin [4]–[6], maysin, β -carotene, beta-sitosterol, geraniol, hordenine, limonen, menthol and viteskin [7]. Explained that corn silk contained 9.65% water, 17.6% protein, 0.29% fat, 3.91% ash and 40% crude fiber [8]. In addition, Corn silk is a source of bioactive compounds, especially flavonoids [9]. Corn silk is rich in phenolic compounds, especially flavonoids and natural antioxidant compounds which are high in different amounts and the proportion depends on corn varieties [10]. The local Bisma corn variety has the best phytochemical content compared to the other two varieties, Arjuna and Srikandi Putih [11]. Also showed that the Bisma variety had higher salinity resistance than Arjuna [12].
The solvent that is often used for the extraction of flavonoids is methanol. Extracted antioxidant components from corn silk using methanol and water with the amount of polyphenol content in methanol and water extracts respectively 272.81 mg GAE/100 g and 256.36 mg GAE/ 100 mg (dry) [13]. Extract sweet Corn silk using a combination of solvents (methanol: water) (85:15) [14]. The total flavonoids obtained were 291.28 mg QE/kg higher than using a combination of solvents (ethanol: water), (acetone: water) and (ethyl acetate: water). Chose methanol 70% (v / v), with a ratio of 10: 1 (v / w) to materials for the same purpose and material [15].
Several factors contribute to the extraction rate and quality of the bioactive compounds of phenol compounds, namely solvent extraction type, solvent concentration, particle size, temperature, pH and extraction time. Response Surface Methodology (RSM) has been used to obtain the optimum condition of corn silk powder extraction [16]. The advantage of using the RSM method is that it is faster and more informative than the approach of one classic variable or a complete factorial design [17]. This study aims to determine the optimum temperature conditions and the length of extraction of local corn silk powder (bisma variety) using RSM.
II.MATERIALS AND METHOD
A. Materials
The raw material used is fresh Corn silk, Bisma variety, aged ± 80-90 days (mature) originating from Temanggung Regency, Central Java. Obtained from Lawangan Hamlet, Lempuyang Village, Candiroto District, Temanggung Regency.
B. Equipment
The equipment which is used for the proximate test includes the Sanyo Drying Oven Mov-112 oven (moisture content test), Kjeldahl flask (protein content test), Soxhlet and thimble (fat content test), furnace (ash content test) and glassware. Essential equipment for analysis of dietary fiber are furnaces and crucible porosity, as well as equipment for testing total phenol, total flavonoids, beta-sitosterol, and antioxidant activity tests, are spectronic spectrophotometers UV-VIS 20, centrifuges, vortices, cup cups, test tubes, cuvettes, pipettes Mohr, and the gas chromatography of the Shimadzu QP 5000 brand (GCMS).
C. Sample Preparation
The 3g of fresh silk is washed with distilled water and then dried in an oven at 600 C for 24 hours [18] to the final moisture content of 10-11%, crushed into powder using a vacuum grinder, packed and stored below -200C until analysis.
D. Extraction of Corn Silk Powder
Corn silk is extracted using the modified method [13]. The 5500 g of local Corn silk of Bisma variety, mixed 11.000 ml solvent methanol, 80% of solvent concentration, and ratio (1:20) of extracted with length of time (60; 70; 80; and 90) minutes and temperature of 40;50; 60; and 700C with a water bath shaker. 1.5 hours later filtered separate the pulp
using Whatman No. 1 paper. Solvent separation with the rotary flash evaporator.
E. Analysis
Chemical analysis was carried out on fibers (soluble, insoluble, and total fiber) using the enzymatic method [19], thermo gravimetric method (loss on drying) moisture content, which is determined by constant temperature and ash is determined. By measuring the muffle furnace [19], protein content using the Micro Kjeldahl method [19], fat content using the Soxhlet method [19] and carbohydrate content using carbohydrate by difference [19] and phytochemical corn silk includes: total phenol [20], flavonoids [11], beta-sitosterol [21], and antioxidant activity [20].
F. Experimental Design
The experimental design used was factorial Randomized Block Design (RBD) with two factors and three replications. Local corn silk of Bisma variety, 80% solvent concentration, and ratio (1:20) were extracted with extraction time (60; 70; 80; and 90) minutes and temperatures of 40; 50; 60; and 700C. The analysis process is carried out using Response Surface Methodology. The draft formulation and response was made with the DX 11.0® Program to determine the dependent variables and independent variables. Minimum and maximum limit values are entered into RSM Optimize Design's DX 11® program to be randomized. After combination randomization, two treatments of temperature and time were analyzed as shown in Table 1.
TABLEI
INDEPENDENT VARIABLE RANGE
Component Independent
Variable Category Min Max
X1 Time
60; 70; 80; and
90 minutes 60 90
X2 Temperature
40; 50; 60; and
700 C 40 70
Data are expressed as mean and standard deviation (SD). Furthermore, the data obtained were analyzed statistically using ANOVA with 95% significance level and if there were differences between treatments followed by the Duncan New Multiple Range Test (DNMRT) test at the level 5%. The results of the study are processed with Design's DX 11® software to determine the optimum concentration of temperature and the length of time the extract of corn silk powder.
III.RESULT AND DISCUSSION
The description of fiber, chemical, and phytochemical content are displayed in Table 2, 3 and 4. Contour plate and 3d surface are presented in Figure 1 until Figure 13. These Figures presents the data of counter plate and 3d surface on soluble fiber, non-soluble fiber, total fiber, water content, ash, fat content, protein content, carbohydrate content, total phenol, total flavonoid, antioxidant activity, and Beta Sitosterol as well as contour plot chart and optimum surface response of corn silk powder extract.
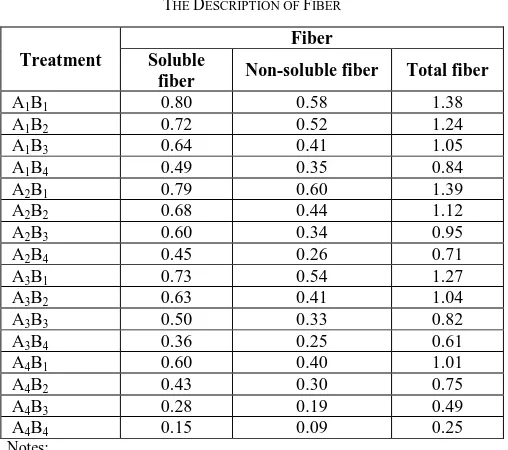
TABLEII THE DESCRIPTION OF FIBER
Treatment
Fiber Soluble
fiber Non-soluble fiber Total fiber
A1B1 0.80 0.58 1.38
A1B2 0.72 0.52 1.24
A1B3 0.64 0.41 1.05
A1B4 0.49 0.35 0.84
A2B1 0.79 0.60 1.39
A2B2 0.68 0.44 1.12
A2B3 0.60 0.34 0.95
A2B4 0.45 0.26 0.71
A3B1 0.73 0.54 1.27
A3B2 0.63 0.41 1.04
A3B3 0.50 0.33 0.82
A3B4 0.36 0.25 0.61
A4B1 0.60 0.40 1.01
A4B2 0.43 0.30 0.75
A4B3 0.28 0.19 0.49
A4B4 0.15 0.09 0.25
Notes:
Time: A1 (60 minutes), A2 (70 minutes), A3 (80 minutes), A4 (90 minutes) and Temperature: B1 (400C), B2 (500C), B3 (600C), B4 (700C)
Figure 1, the contour graph of green soluble fiber plots shows the response of the lowest soluble fiber is 0.5%; the yellow color shows the highest soluble fiber response is 0.7%.
Fig 1. Contour plate and the 3d surface of soluble fiber
Figure 2, contour graph plot value of green insoluble fiber shows the lowest insoluble fiber response value is 0.3%, yellow indicates the highest response of insoluble fiber is 0.5%.
Fig 2. Contour plate and the 3d surface of nonsalable fiber
Figure 3, contour graph plot of the total value of green fiber shows the lowest total fiber response value is 0.8%, yellow indicates the highest total fiber response is 1.2%.
Fig 3. Contour plate and the 3d surface of total fiber
Temperature and time that are too high on the component will be damaged by the atoms that decompose. Meanwhile, the temperature and time that are too low cannot reach the boiling point of the solvent, so the component is not properly extracted [22].
TABLEIII CHEMICAL CONTENT
Treatment
Proximate Moisture
Content (%)
Ash (%)
Fat (%)
Protein (%)
Carbohydrate (%)
A1B1 2.36 2.50 1.29 16.93 78.20
A1B2 2.20 2.38 1.23 14.51 80.78
A1B3 1.80 2.13 1.10 11.85 84.06
A1B4 1.51 1.81 0.89 9.64 86.71
A2B1 2.41 2.49 1.30 16.90 78.06
A2B2 2.19 2.28 1.20 12.53 82.90
A2B3 1.59 2.02 1.01 10.88 85.45
A2B4 1.13 1.51 0.73 7.815 87.01
A3B1 2.15 2.18 1.15 13.08 82.49
A3B2 1.64 2.02 1.03 10.99 84.83
A3B3 1.39 1.67 0.83 8.56 88.31
A3B4 1.05 1.31 0.64 7.01 90.59
A4B1 1.82 1.89 1.00 10.75 85.46
A4B2 1.47 1.61 0.81 9.50 87.35
A4B3 1.19 1.31 0.66 7.10 90.36
A4B4 0.93 1.03 0.49 5.395 92.63
Notes:
Time: A1 (60 minutes), A2 (70 minutes), A3 (80 minutes), A4 (90 minutes) and Temperature: B1 (400C), B2 (500C), B3 (600C), B4 (700C).
Figure 4 contour graph plot value of light blue water content shows the lowest water content response value of 1.4%; yellow indicates the highest moisture content response of 2.2%.
Fig 4. Contour plate and the 3d surface of water content
The longer the cooking, the water content will decrease, causing more water evaporation, so that the water content in the material gets smaller. Evaporation is also caused due to the difference in vapor pressure between water in the
material and water vapor in the air. The pressure of water vapor in materials is generally greater than the pressure of water vapor in the air so that there is a mass transfer of water from material to air [23]. Figure 5, contour graph plots the value of light blue ash content shows the response value of the lowest ash content is 1.6%, pink indicates the highest ash content response is 2.4%.
Fig 5. Contour plate and the 3d surface of the ash
The high ash content in corn silk powder extract can be derived from the mineral content of the material [24], [25]. Figure 6, contour graph plots the value of light blue fat content shows the response value of the lowest fat content is 0.8%, the color yellow shows the highest fat content response is 1.2%.
Fig 6. Contour plate and the 3d surface of fat content
The reduction in fat content in protein concentrates thought to be because it contains free fatty acids, where free fatty acids have sufficient good solubility in ethanol [26]. Figure 7 presents the contour graph plot value of dark blue protein content shows the response value of the lowest protein content is 8%, dark yellow indicates the highest response of protein content is 16%.
Fig 7. Contour plate and the 3d surface of protein content
The higher the temperature and length of extraction, the lower the protein content of corn silk extract. It is suspected that the more protein dissolved in alcohol as the temperature
and extraction time increase. Protein solubility generally increases when the temperature rises from 0 to 400C, and the longer the dissolution time, the contact between the solute and solvent is longer, so that many solutes are taken [27]. Figure 8, contour graph plot of light blue carbohydrate values shows the response value of the lowest carbohydrate level is 80%, yellow indicates the response of the highest carbohydrate level is 88%.
Fig 8. Contour plat and the 3d surface of carbohydrate content
The longer the extraction time, the higher the carbohydrate content, this is presumably because the total sugar content in the extract is getting bigger [28]. This is also supported by the statement of Agus [29], the evaporation of water during heating, causing the water content to decrease and the concentration of solids will increase. Decreasing water content will also increase the high levels of nutrients left behind.
Figure 9. contour graph plot of total phenol value in blue shows the lowest total phenol response value is 2000 μgGAE /g, green color shows the highest total phenol response of 4000 μgGAE/g, and the largest 3D surface graph of total phenol is 60 minutes and 400C. This is presumably because, with the temperature and length of extraction time, it will be able to release wall cell phenolic compounds or bound phenolic compounds, thus causing more phenol compounds to be extracted. The use of high temperatures for extraction increases the solubility of phenol. High temperatures can release phenol wall cells or bound phenolic compounds caused by damage to cell elements, causing more phenolic compounds to be extracted [30].
Fig 9. Contour plate and 3d surface of total phenol
Figure 10, contour graph of plots of total value of light blue flavonoids shows that the lowest total flavonoid response value is 80 μgGAE/g, the highest green color shows the highest total flavonoid resp. minutes and temperatures is 400C. The lowest mean total flavonoids were obtained in A4B4 (90 minutes and 700C) at 38.91 µgGAE/g, while the highest total flavonoid was found in A1B1 (60
minutes and 400C) at 167.45 µgGAE/g. Low total flavonoids in corn silk powder extract caused by temperature and extraction time. Flavonoids are heat resistant and easily oxidized at high temperatures [31]. Flavonoids will be degraded at temperatures above 1000C. Flavonoids are sensitive to heat, because of their hydroxyl and ketone groups, and unsaturated double bonds [32].
Fig 10. Contour plate and the 3d surface of total flavonoid
TABLEIV PHYTOCHEMICAL CONTENT
Treatment
Phytochemical component
Total Phenol (µgGAE
/g
Total Flavonoid
µgGAE/g
Anti-oxidant activity (%)
Beta Sitosterol
(ppm)
A1B1 5342.45 167.45 50.41 996.53
A1B2 5329.82 157.47 50.20 903.66
A1B3 4096.05 122.38 36.85 647.95
A1B4 1924.87 82.71 21.05 376.21
A2B1 5110.20 159.65 49.90 961.29
A2B2 4232.26 122.10 39.15 730.86
A2B3 2779.64 99.18 29.40 515.54
A2B4 1430.21 76.59 16.75 297.53
A3B1 3815.86 128.42 31.55 846.81
A3B2 2343.97 107.71 30.60 697.89
A3B3 1417.74 91.53 21.30 452.65
A3B4 789.54 62.6 13.17 247.59
A4B1 2373.31 103.41 33.05 698.47
A4B2 1860.33 81.14 20.15 562.45
A4B3 1124.98 53.12 13.05 397.92
A4B4 757.90 38.91 8.65 154.75
Notes:
Time: A1 (60 minutes), A2 (70 minutes), A3 (80 minutes), A4 (90 minutes) and Temperature: B1 (400C), B2 (500C), B3 (600C), B4 (700C)
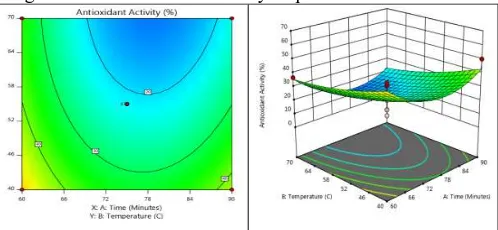
Figure 11, contour graph plots the total value of antioxidant activity in light blue shows the total response
value of antioxidant activity is 20%, light green shows the highest total antioxidant activity response is 40%.
Fig 11. Contour plate and the 3d surface of antioxidant activity
The lowest average antioxidant activity was found in A4B4 (90 minutes and 700C) at 8.65%, while the highest
average antioxidant activity was A1B1 (60 minutes and 40 0
C) at 50.41%. The high total phenol and total flavonoids in corn silk powder extract showed high antioxidant activity. There is a relationship between the ability of phenol compounds as antioxidants and their chemical structure [33]. The configuration and the total hydroxyl group is the basis that significantly influences the mechanism of its activity as an antioxidant. There is a positive correlation between antioxidant activity and the content of polyphenol compounds [34]. Figure 12, contour graph plot of light blue beta-sitosterol values showed the lowest beta-sitosterol response value is 400 ppm; the yellow color showed the highest total antioxidant activity response is 900 ppm.
Fig 12. Countour Plate and 3D Surface of Beta-Sitosterol
The temperature and duration of extraction affect the solubility of solvents and can enlarge the pores of the solid so that the solvent enters through the pores of solids and dissolves the absorbed solid component then the solute diffuses out the surface of the solid particles and moves to the next solid film layer into solution [35]. The high beta-sitosterol in corn silk powder extract is a positive correlation with total phenol, total flavonoids, and antioxidant activity.
TABLEV
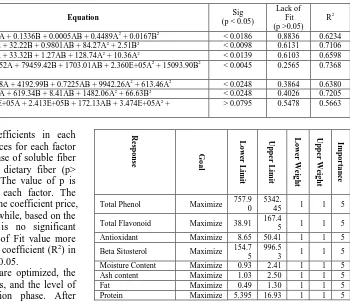
MODEL ANALYSIS FOR CHEMICAL CONTENT AND PHYTOCHEMICAL EXTRACT OF CORN SILK POWDER
Response Model Equation Sig
(p < 0.05)
Lack of Fit (p >0.05)
R2
Fiber -Soluble Fiber
.Quadratic Y = 0.0268A + 0.0577B + 5.551E-17AB + 0.1800A2 + 0.0162B2 > 0.0691 0.9423 0.5027
-Non-soluble Fiber .Quadratic Y = 0.0209A + 0.0329B + 0.0009AB + 0.1158A2 + 0.0011B2 > 0.0636 0.8024 0.5190
-Total Fiber .Quadratic Y = 0.0950A + 0.1777B + 0.0009AB + 0.5724A2 + 0.0231B2 > 0.0640 0.8952 0.5168
Proximate -Moisture content
.Quadratic Y = 0.1321A + 0.5835B + 0.0036AB + 1.80A2 + 0.0001B2 < 0.0147 0.7637 0.6498
-Ash Content .Quadratic Y = 0.1051A + 0.4238B + 0.0002AB + 1.44A2 + 0.0990B2 < 0.0154 0.8912 0.6369
Response Model Equation Sig
(p < 0.05)
Lack of Fit (p >0.05)
R2
- Fat content .Quadratic Y = 0.0333A + 0.1336B + 0.0005AB + 0.4489A2 + 0.0167B2 < 0.0186 0.8836 0.6234
- Protein .Quadratic Y = 19.80A + 32.22B + 0.9801AB + 84.27A2 + 2.51B2 < 0.0098 0.6131 0.7106
- carbohydrate .Quadratic Y = 25.96A + 33.32B + 1.27AB + 128.74A2 + 10.36A2 < 0.0139 0.6103 0.6598
Fitokimia - Total phenol
.Quadratic Y = 28305.52A + 79459.42B + 1703.01AB + 2.360E+05A2 + 15093.90B2 < 0.0045 0.2565 0.7368
- Total flavonoid .Quadratic Y = 2248.98A + 4192.99B + 0.7225AB + 9942.26A2 + 613.46A2 < 0.0248 0.3864 0.6380
- Antioxidant activity .Quadratic Y = 210.15A + 619.34B + 8.41AB + 1482.06A2 + 66.63B2 < 0.0248 0.4026 0.7205
- Beta sitosterol .Quadratic Y = 1.003E+05A + 2.413E+05B + 172.13AB + 3.474E+05A2 +
1035.30B2
> 0.0795 0.5478 0.5663
Table 5 shows that, regression coefficients in each response there are no significant differences for each factor with p-value <0.05, except for the response of soluble fiber (p>0.0691), insoluble fiber (p>0.0636), dietary fiber (p> 0.0649), and beta-sitosterol (p>0.0795). The value of p is used to determine the significance of each factor. The smaller the p-value, the more significant the coefficient price, and the more important the results. Meanwhile, based on the results of quadratic equations, there is no significant difference for all factors with the Lack of Fit value more than 0.05. The price of the determination coefficient (R2) in the equation model is obtained more than 0.05.
Table 6, shows the components that are optimized, the target, the minimum and maximum limits, and the level of importance in the formula optimization phase. After statistical analysis using regression and variance analysis, response optimization analysis is performed to obtain optimum conditions for corn silk extraction. The optimization is then carried out with the optimal design method. This method will optimize according to variable data, and the response measurement data entered. The output of the optimization stage is the recommendation of several new formulas that are optimal according to the Design Expert program. Optimization is done by determining the desired response criteria with a range that is possible to achieve. The most optimal formula is a formula with maximum desirability value. Desirability value is a function value for optimization purposes that shows the ability of the program to fulfill desires based on the criteria specified in the final product. The desirability value that is getting closer to the value 1 indicates the program's ability to produce the desired product more perfect. Montgomery [36], states that the value of desirability is to determine the degree of accuracy of the results of optimal solutions. Desirability value that is close to one, the higher the value of accuracy optimization.
TABLEVI
THE RESPONSE COMPONENTS,TARGETS,LIMITS, AND THE IMPORTANT THE
FORMULA OPTIMIZATION STAGE
R
es
p
o
n
se Goa
l L o w er L im it U p p er L im it L o w er W ei g h t U p p er W ei g h t Im p o rt a n ce
A:Time Minimize 60 90 1 1 3
B:Temperature Minimize 40 70 1 1 3
Soluble Fiber Maximize 0.15 0.80 1 1 5
Non-soluble Fiber Maximize 0.09 0.60 1 1 5
Total Fiber Maximize 0.25 1.39 1 1 5
R
es
p
o
n
se Go
a l L o w er L im it U p p er L im it L o w er W ei g h t U p p er W ei g h t Im p o rt a n ce
Total Phenol Maximize 757.9
0 5342.
45 1 1 5
Total Flavonoid Maximize 38.91 167.4
5 1 1 5
Antioxidant Maximize 8.65 50.41 1 1 5
Beta Sitosterol Maximize 154.7 5
996.5
3 1 1 5
Moisture Content Maximize 0.93 2.41 1 1 5
Ash content Maximize 1.03 2.50 1 1 5
Fat Maximize 0.49 1.30 1 1 5
Protein Maximize 5.395 16.93 1 1 5
Time and temperature will affect the quality of corn silk produced. Time and temperature are optimized with minimized response targets and importance level 3 (+++). Chemical and phytochemical responses are optimized components with the maximum target (maximizing) and importance level 5 (+++++). The level of importance is different because it maximizes the level of optimization [36]. Chemistry and phytochemicals are responses that much determine the efficiency of the process. This condition has high desirability value is 0.75 as shown in Figure 13.
Fig 13. Contour plot chart and the optimum surface response of corn silk powder extract
After analyzing the quadratic model, the optimum point of variety, type of solvent and concentration of solvent are carried out to produce optimum conditions for chemical and phytochemical content. The desirability value generated is 0.7; the optimum solution is obtained at 60 minutes and temperature 400C. From the optimum solution, it is predicted to produce chemical content (soluble fiber 0.80%, insoluble fiber 0.58%, total fiber 1.38%, moisture content 2.36%, ash content 2.50%, fat content 1,29%, protein content 16.93%, carbohydrate content 78.20%), and phytochemical content
(total phenol 5342.45 µgEAG / g, total flavonoids 167.45 µgEAG / g, beta-sitosterol 996.53 ppm, and antioxidant activity 50.41%).
IV.CONCLUSION
The optimum conditions for extracting corn silk powder are at temperature is 400C, and the extraction length is 60 minutes. In this condition chemical content are produced (soluble fiber 0.80%, insoluble fiber 0.58%, total fiber 1.38%, moisture content 2.36%, ash content 2.50%, fat content 1.29%, protein content 16.93%, carbohydrate content 78.20%), and phytochemical content (total phenol 5342.45µg EAG / g, total flavonoids of 167.45µg EAG / g, beta-sitosterol of 996.53 ppm, and antioxidant activity 50.41 %).
REFERENCE
[1] EFT. Nuridayanti. 2011. Uji Toksisitas Akut Ekstrak Corn silk Ditinjau dari Nilai LD50 dan Pengaruhnya terhadap Fungsi Hati dan
Ginjal pada Mencit. Skripsi. Universitas Indonesia. Jakarta. [2] BS.Bushman. 2002. Daya Tabir Surya dan Antioxidant Formula
Krim Ekstrak Rimpang Kencur (Kaempferia galanga L) dan Rimpang Temu Kunci (Boesenbergia pandurata (Roxb.). Universitas Muhammadiyah Purwokerto.
[3] J.Liu, S. Lin, Z. Wang, C.Wang, E.Wang, Y.Zhang, and J.Liu. 2011. Supercritical fluid extraction of flavonoids from Maydis stigma and its nitrite-scavenging ability. Food Bioprod Process. 89: 333–339. [4] MA.Ebrahimzadeh, F.Pourmorad, and AR. Bekhradnia. 2008. Iron
chelating activity, phenol, and flavonoid content of some medicinal plant from Iran. African Journal of Biotechnology. 7 (18): 3188-3192. [5] J. Guo, T.Liu, L.Han, and Y.Liu. 2009. The effect of corn silk on
glycaemic metabolism. Journal of Nutrition and Metabolism Biomed Central. 6:47.
[6] MA.Sholihah, AR.Nurhanan, and WIW Rosli. 2012. Phytochemicals screening and total phenolic content of Malaysian Zea mays silk extracts. International Food Research Journal.19 (4): 1533-1538. [7] A.Rahmayani. 2007. Telaah kandungan kimia Corn silk (Zea mays
L). Institut Pertanian Bogor: Bogor.
[8] C.Wang, T. Zhang, J. Liu, S.Lu, C.Zhang, E.Wang, Z.Wang, Y.Zhang, and J.Liu. 2011. Subchronic toxicity study of corn silk with rats. Journal of Ethnopharmacology. 137: 36-43.
[9] SC.Ren, ZL.Liu, and XL.Ding. 2009. Isolation and identification of two novel flavone glycosides from corn silk (Stigma maydis). Journal Med Plants Res. 3(12): 1009-1015.
[10] J.Liu, C.Wang, Z.Wang, C.Zhang, S.Lu, and J.Liu. 2011. The antioxidant and free-radical scavenging activities of extract and fractions from corn silk (Zea mays L) and related flavone glycosides. Food Chemistry. 126: 261–269.
[11] Haslina, D.Praseptiangga, VP.Bintoro, and B.Pujiasmanto. 2017. Chemical and phytochemical characteristics of local corn silk powder of three different varieties. International Journal on Advanced Science Engineering Information Technology 7(5):1957-1963. [12] A.Dachlan, N.Kasim, and AK.Sari. 2013. Uji Ketahanan Salinitas
Beberapa Varietas Jagung (Zea mays L.) dengan Menggunakan Agen Seleksi NaCl. Jurnal Ilmiah Biologi BIOGENESIS. Vol 1, No. 1, ISSN 2302-1616, hal 9-17.
[13] AR.Nurhanan, WIW.Rosli, and SSJ.Mohsin. 2012. Total polyphenol content and free radical scavenging activity of corn silk (Zea mays silks). Sain Malysiana. 40 (2):155-161.
[14] Haslina dan M.Eva. 2016. Extract corn silk with a variation of solvents on yield. Total phenolics, total flavonoids, and antioxidant activity. Indonesian Food and Nutrition Progress. Vol 14. Issue 1.ISSN:0854-6177.
[15] Selcuk. 2011. The causal relationship between producer price index and consumer price index: empirical evidence for selected European countries. International Journal of Economics and Finance. Vol 3. No. 6 November 2011.
[16] KK.Chew, SY.Ng, YY.Thoo, MZ.Kho, AWM. Wan, and CW.Ho. 2011. Effect of ethanol concentration, extraction time, and extraction temperature on the recovery of phenolic compounds and antioxidant capacity of Centella asiatica extracts. International Food Research Journal. 18:571-578.
[17] M.Assegaf, H.Pudji, H.Chusnul, dan Supriyadi. 2012. Optimasi ekstraksi pala (Myristica fragrans houtt) asal Maluku Utara menggunakan Response Surface Methodology (RSM). Jurnal Fakultas Teknologi Pertanian Universitas Gadjah Mada. Yogjakarta 32 (4):2-3.
[18] QL.Hu, LJ.Zhang, YN.Li, YJ.Ding, and FL. 2010. Purification and antifatigue activity of flavonoids from corn silk. International Journal of Physical Sciences. 5: 321–326.
[19] Association of Official Analytical Chemist (AOAC). 2007. Official method of analysis of the association of official agriculture chemist (sixteenth edition). Virginia.
[20] E.Candesa and L.Parker. 2002. Handbook of Antioxidant. Ed 2. New York. Marcell Dekker Inc.
[21] I.Yinusa, NI.George, RG.Ayo, and Y.Rufai. 2015. Vacuum liquid chromatographic isolation and characterization of beta-sitosterol from the bark of Sarcocephalus latifolius (Smith Bruce). Journal of Chemistry and Chemical Sciences, Vol.5 (9), 480-488.
[22] M.Solehudin. 2001. Ekstrak Minyak dan Oleoresin dari Kulit Kayu Manis (Cinnamomum burmanii blume). Skripsi, Fakultas Teknologi Pertanian, Institut Pertanian Bogor, Bogor.
[23] S.Fitriani. 2008. Pengaruh suhu dan lama pengeringan terhadap beberapa mutu manisan belimbing wuluh (Avverhoa bilimbi L) kering. Jurnal Teknologi Pangan 7:32-37.
[24] S.Darmawan. 2012. Ekstraksi protein dari biji lamtoro dengan pelarut NaOH. Jurnal Fakultas Teknik, Universitas Setia Budi, Jakarta.
[25] HA.Phaza dan AE.Ramadhan. 2010. Pengaruh Konsentrasi Etanol, Suhu dan Jumlah Stage pada Ekstraksi Oleoresin Jahe (Zingiber Officinale Rosc) Secara Batch. Jurusan Teknik Kimia, Fakultas Teknik, Universitas Diponegoro.
[26] Ismiyarto, AH.Siti, dan JW.Pratawa. 2006. Identification of Fatty Acid Composition in Turi Seed Oil (Sebania grandiflora) (L) Pers). JSKA, IX (1): 1-3.
[27] E.Kurniati. 2009. Suplementasi Albumin dari Ekstrak Ikan Gabus (Ophilocephalus striatus) Metode Pemanasan dan pH Isoelektrik pada Pembuatan Kecap Kedelai (Kajian Konsentrasi Penambahan Ekstrak Albumin dan Suhu Pemasakan Kecap). Skripsi. Universitas Brawijaya, Malang.
[28] D.Yulianti, S.Bambang, dan Y.Rini. 2014. Pengaruh lama ekstraksi dan konsentrasi pelarut etanol terhadap sifat fisika-kimia ekstrak daun stevia (Stevia rebaudiana Bertoni M.) dengan metode microwave assisted extraction (MAE). Jurnal Biproses Komoditas Tropis 2(1):35-41.
[29] MI.Agus. 2012. Pengaruh suhu dan lama waktu ekstraksi terhadap sifat kimia dan fisik pada pembuatan minum sari jahe merah dengan kombinasi penambahan madu sebagai pemanis. Jurnal Pangan dan Agroindustri 3(2):530-541.
[30] D.Wazir, A.Syahida, M. Radzali, M.Maziah, and MY.Shukor. 2011. Antioxidant activities of different parts of Gnetum gnemon L. Journal Plant Biochemistry and Biotechnology. (July–Dec 2011) 20(2):234–240.
[31] S.Lenny. 2006. Senyawa flavonoid, fenilpropanoida dan alkaloida. Medan: Fakultas MIPA, USU.
[32] LY.Qiao, R.Sun, Chen, Y.Fu, W.Zhang, X.Li, J.Chen, YX.Shen, and Ye. 2014. Sonochemical effects on 14 flavonoids common in citrus relation to stability. Plos ONE, vol. 9, no. 2:e87766.
[33] A.Miryati, L.Sapei, K.Budiono, dan S.Indra. 2011. Ekstraksi Antioksidan dari Kulit Buah Manggis (Garcinia mangostana L). Universitas Katolik Parahyangan, Bandung.
[34] S.Ogawa. 2003. Studies on Antioxidant Activity in Japanese Edible Seaweeds. Tesis. Tokyo University of Fisheries, Tokyo.
[35] HA.Phaza dan AE.Ramadhan. 2010. Pengaruh Konsentrasi Etanol, Suhu, dan Jumlah Stage pada Ekstraksi Oleoresin Jahe (Zingiber officinale Rosc) secara Batch. Jurusan Teknik Kimia, Fakultas Teknik, Universitas Diponegoro.
[36] DC.Montgomery. 2001. Design and Analysis of Experimental. John Wiley & Sons Inc, New York.