A Reuse Method of Large-scale Embedded Software
Based on Inter-module Relations
Hidetoshi Kambe1, Shinji Kitagami2, Shigeki Nankaku3, Jun Sawamoto4,*, Hiroyasu Mitsui5
1One Solutions, Inc., Tokyo, 161-0034, Japan
2Information Technology R&D Center, Mitsubishi Electric Corp., Kanagawa, 247-8501, Japan 3Department of Computer Sceience, Osaka Electro-Communication University, Osaka, 575-0063, Japan 4Faculty of Software and Information Science, Iwate Prefectural University, Takizawa, Iwate, 020-0193, Japan
5Department of Computers and Systems Engineering, Tokyo Denki University, Saitama, 350-0394, Japan
Abstract
Embedded software is starting to play a key role in almost every modern consumer electronic device. As demand for software is growing, the lines of code that must be developed tend to increase; moreover, much shorter development time is required. Software installed in such electronic equipments used to be a simple micro-processor firmware to control the hardware, but dedicated OSs, such as Linux are adopted and comes to realize high level processing. It is also becoming increasingly inevitable that existing embedded software system will be reused. In this paper, we propose a method to accomplish the effective composition of embedded software function by managing dependency information among modules. The method analyses mutual relations among existing modules and visually presents not only inter-module dependency but also a list of available reusable modules based on the developer’s demand. It also improves the development process by maintaining the development management property information for each source file and using the property information in the reuse process. We have developed a configuration management system that integrates proposed functions to support large-scale embedded software development by efficient software reuse. We evaluated the method by applying it to some actual developments.Keywords
Configuration management, Embedded software, Program visualization, Software reusability1. Introduction
Embedded software is starting to play a key role in almost every modern consumer electronic device such as mobile telephones, vehicle controller, memory music players, digital cameras, HDD recorders, etc. Multi-functionality and high performance of such devices’ are progressing very rapidly [1, 2]. Software installed in such electronic equipments was used at first as a microcomputer firmware that was simply intended to control the hardware. Recently, however, some kinds of OSs are used combined with dedicated hardware to provide even greater functionality than that of former PCs, e.g., sophisticated image processing and communication control [3, 4].
Nowadays, as demand for software is growing, the lines of code that must be developed tend to increase; moreover, much shorter development time is required [5, 6]. These trends indicate that the securing of embedded software development capability is the key factor which determines
* Corresponding author:
[email protected] (Jun Sawamoto) Published online at http://journal.sapub.org/se
Copyright © 2014 Scientific & Academic Publishing. All Rights Reserved
the company's ability to develop products [1]. The reuse of existing software is becoming unavoidable. For reuse, software modules have to be well managed for developers’ better usability. Although many research reports are issued on software reuse, we have recognized only a few reports on the module dependency among reused software and other related software [7-10]. If existing software to be reused is not well managed in configuration, users would not be able to know which modules might be affected when some parts of software are modified. That would create unwanted new program bugs [11].
levels of the structural hierarchy. For that reason, it was not suitable for software reuse in large-scale software development.
In this paper, we aim at an improvement of the process in software reuse development of large-scale embedded software which reuses modules from multiple systems. While holding development management property information individually corresponding to source files, modules and software blocks and using the information in the reuse development flow, management and development process is improved. By our method, a source file is analysed first, then the dependency in the symbol level between modules is extracted and the functional hierarchical structure of software is made visible in the form of a block diagram. Incidental information, including development management information, bag information, number of times of reuse, etc., is managed as properties with the information acquired from the source files in this block diagram. By using and updating information of the block diagram, software reuse development of large-scale embedded software is carried out in an efficient manner. In our study, we evaluated this method for a development system having as many as 6,000 source code files.
In Chapter 2, the problems and the measures to take for the current software development project are summarized. Chapter 3 describes Inter-module dependency visualization method to support reuse. Structure of the proposed method and its implementation is described in Chapter 4, and the results of implementation and its evaluation are described in Chapter 5.
2. Current Problems and Measures to
Take
2.1. Current Problems
When embedded software is developed for devices such as mobile telephones and car navigation systems, which are rapidly progressing with ever-increasing sophisticated functions included, there are practically almost no such cases in which the associated software is developed from scratch. For them, either the existing framework is used or the existing software asset with the associated platform is reused to achieve cost reduction of the development under the condition of shorter development time with great quality improvement that must be accomplished. However, reusing such software assets for development induces some problems, as explained hereinafter.
(1) As the software development size grows, it becomes necessary to split the development resources to allocate to each functional unit. The number of functional units might often extend to the hundreds or even thousands, in which case no developer would be able to understand all functionalities, nor to manage the versions of every piece of software. Consequently, it would take quite a long time to discover which software modules are newly added, modified,
or reused.
(2) A developer who worked on a specific part of the software might not necessarily be available when the software is to be developed for reuse. In such a case, it would be difficult to obtain the right information merely from a briefing by the associated staff members, when it is hard to obtain sufficient knowledge on the software configuration or inter-module relation from the documents.
(3) Using the function of an ordinary method of the software configuration management, it would be possible to manage a version of source code files, but it would not be useful to determine inter-modular software relations on specification changes or validation checking after modifications.
(4) The developer, when the development size is large, cannot normally know much about the software modules except for the portion for which he or she is professionally responsible. Concentrating only on the software modules that the developer is responsible for, it would be hard to identify and select the right reusable ones from among all other numerous software modules.
2.2. Measures to Take
The following type of measures should be taken for developers to reuse the existing software assets to perform efficient development.
(1) Out of the existing software assets including the reusable source code files, the right information of source code files required for development, should be selected automatically. This would significantly reduce the time required to investigate assets before development starts.
(2) It would be useful to give information related to the software configuration to the developers in a visible form such as a block diagram that shows the inter-module relations among the software modules that are planned to be used for development or modification.
(3) Linking the block diagram information with the associated source code files allows the developers to expedite the work of coding while preventing unnecessary information shortfalls and leaking.
(4) When developing new software modules, it would help the developers arrange their work more efficiently to allow them to add necessary functions on the block diagram and simultaneously clarify the relation definitions among the modules on the diagram as well.
(5) For the newly added block on the diagram, a template for its associated source code file is created automatically; thereby it is simplified to embed it into the software environment.
3. Inter-module Dependency
Visualization Method to Support
Reuse
method that is expected to facilitate reuse.
3.1. Block Diagram for Visualization of Software Groups
The embedded software is normally divided and structured in a hierarchy trying to have the better work sharing performance capability during development and in consideration of the possibility of later reuse of the software. In general, it might be divided by a large category such as OS, driver, middleware, and application; if it is a complex one, it might be split further by every sub-function into a hierarchical level. Eventually, every source code file is the smallest unit of a split.
However, as the split-level becomes increasingly detailed, it would take the developer a significant amount of time to understand such a hierarchical structure, thereby engendering more errors and mistakes. That would certainly degrade the efficiency level of the investigation for the
software reuse possibility.
The method we propose herein helps the developer understand the structure of the software instantly by looking at a block diagram that visualizes its hierarchical structure by every function level or by any split-level determined at the time of development planning.
Figure 1 shows the relations among the source files in the left hand side and its associated block diagram in the right hand side. The developer might get the macroscopic view of the block diagram if he or she wants to know and understand the entire structure. If he or she wants to check the functional structure in detail, for example, the developer could do it by visualizing the detail level of the block diagram. Therefore, by changing the level of the visualization, the developer can grasp the structure graphically.
Figure 1. Source files and its block diagram expression
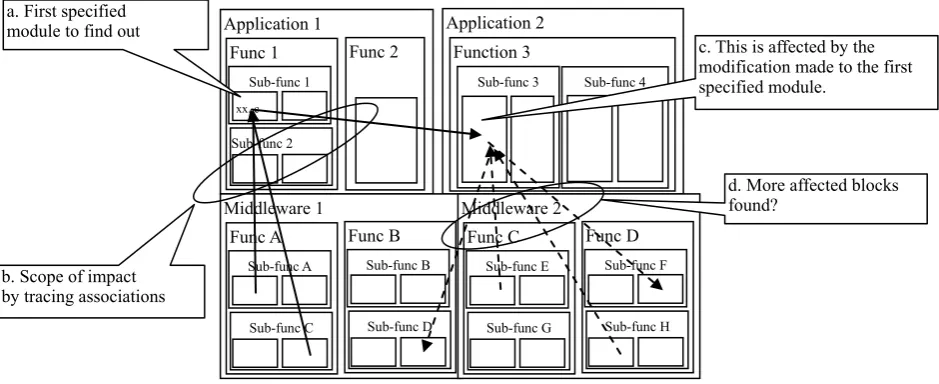
Figure 2. Inter-modular dependency for the reuse process of modules
Application 1 Func 1
Sub-func 1
Func 2
Sub-func 2 xx..c
Application 2 Function 3
Sub-func 3 Sub-func 4
Middleware 1 Func A
Sub-func A
Sub-func C
Func B
Sub-func B
Sub-func D
Middleware 2 Func C
Sub-func E
Sub-func G
Func D
Sub-func F
Sub-func H
c. This is affected by the modification made to the first specified module.
d. More affected blocks found?
a. First specified module to find out
b. Scope of impact by tracing associations
Source Files:
C:\Project\ProjectA\Main\…..\Cart\Ctrl\Cstmr\dbs\accs.cpp C:\Project\ProjectA\Main\…..\Cart\Ctrl\Cstmr\dbs\cdb.cpp C:\Project\ProjectA\Main\…..\Cart\Ctrl\Cstmr\sec\Auth.cpp C:\Project\ProjectA\Main\…..\Cart\Ctrl\Cstmr\sec\crtp.cpp C:\Project\ProjectA\Main\…..\Cart\Ctrl\Rsv\rdb.cpp C:\Project\ProjectA\Main\…..\Cart\DB\Cmn\Load\Blnc.cpp C:\Project\ProjectA\Main\…..\Cart\DB\Cmn\Load\test.cpp
:
Block diagram display Ctrl
Rsv Cstmr
dbs
sec crpt auth rdb
cdb accs
DB Cmm load
3.2. Visualization of Inter-modular Dependency
Figure 2 shows a case in which the developer, after any modifications are applied, narrows down the functional blocks and/or the source code files to reuse, thereby learning what modules might be affected in terms of reuse. The developer, on the block diagram, first specifies the block that he or she is planning to reuse after the necessary modifications (a in Figure 2). The developer then executes the relation search on the block diagram by visualizing the status of the associated blocks with which any function level input/output is associated with the first block he specified (b in Figure 2). The developer further checks, one-by-one, all the blocks that are associated with the first block he specified to see if anything might be affected when the developer modifies the first block so that the affected blocks might need modification in some way or another. If such an associated module is selected for modification next, he would display all the relations again (c in Figure 2) but this time also display those around that block of the module to find additional relations (d in Figure 2).
Therefore, starting from the originally specified module and tracing its relations one by one, the developer could proceed with the investigation in the scope of development when he or she plans to reuse such software, and check with the existence of any function-level relations in terms of its input and output between associated modules during the design phase of the development.
3.3. Reuse Process Flow by Inter-module Relation Analysis and Visualizing Associated Information
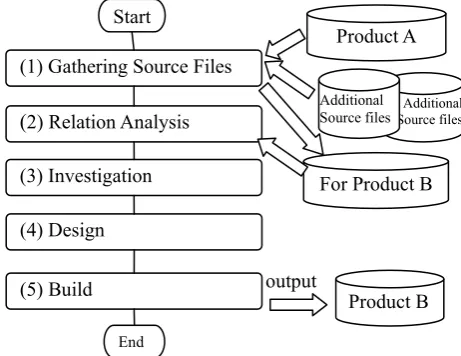
Figure 3 shows the process flow of the proposed method in which new software Product-B is developed by reusing the existing application software, Product-A.
(1) Gathering Source Files
The developer first sets up the specifications of Product-B to be developed.
(2) Relation analysis
The associated information of the symbols among the files is analysed. Furthermore, the software structural data and the software block diagram are produced for the group of software.
(3) Investigation
The developer then investigates the reused software modules by visualizing their software structure displayed in a block diagram based on relation analysis information.
The information of all software modules associated with the modified module to reuse is displayed in the block diagram.
(4) Design
In the design phase, the developer performs two tasks: modification of the existing software modules, and addition of new software modules.
(5) Build
The developer builds the software through the compile and link steps to produce the executable code of software Product-B.
Figure 3. Process flow of the proposed reuse method
4. Structure of the Proposed Method and
Its Implementation
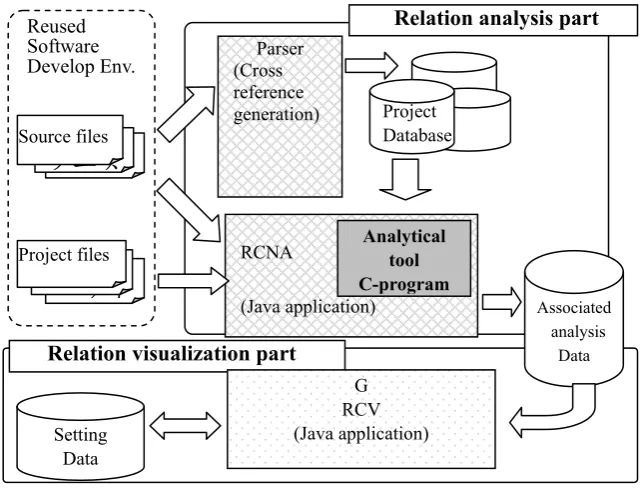
Figure 4 shows the system configuration of method that we proposed. The method comprises two parts: a relation analysis part, and a relation visualization part.
(1) Relation analysis part
The relation analysis part consists of a parser and RCNA (Relation CoNnection Analyser).
The parser generates cross-reference information from the source code files. In the development we conducted, we made RCNA which produces a cross-reference by first categorizing the symbols used in every source code, putting them in the database, and then creating the relations among the database tables using its unique analytical engine.
RCNA generates a software block structure from the project file. Then, using the cross-reference information that the parser produced, the RCNA analyses the relation among the software modules.
(2) Relation visualization part
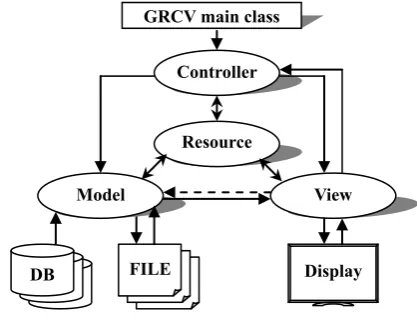
The relation visualization part includes a database that retains the configuration setup information and the relation visualization software. The relation visualization software is Java application software that visualizes the software module that has been analysed by the relation analysis part based on its configuration setup file information in the form of a software block diagram. The relation visualization part depicts the relation between every pair of software block diagrams. We implemented these softwares on the architecture based on the MVC model which is normally used for developing a Web application. Figure 5 shows the
(1) Gathering Source Files Start
(2) Relation Analysis
(3) Investigation
(4) Design
(5) Build
End
Additional Source files
Product A
For Product B Additional Source files
output
implementation structure for the relation visualization part based on the MVC architecture as follows.
● Model: Mainly reads the associated analysis data from the database, accesses the external files, and executes creation of various instances. Basically, this portion is activated by an event issued from the Controller. Some events from the user operations are invoked directly from the View.
● View: Organizes the screen structure and executes
display operations. It receives various events of user operations, and passes them to Model through the Controller or directly to it.
● Controller: Controls Model and View, and passes the event coming from View over to the Controller when necessary. Resource manages character labels, parameters, and various properties.
Table 1 shows functions implemented in the relation visualization part.
Figure 4. System configuration of the proposed method
Table 1. Relation visualization functions implemented in relation visualization part
Function Description
Software block structure display Display the block structure obtained by the relation analysis part using a software block diagram.
Relationship display Display I/O relations among units (files, modules, etc.) by using colours and arrow symbols.
Relationship data comparison
Display the differences that are used to determine whether the specific block should be added or not. It can be accomplished by comparing the relation analysis result for the block selected on the screen with the analysis result of the original version software.
New block addition or deletion Based on the relation display part the decision on whether to add new software (functionality) or delete existing one can be made straightforwardly in the development.
Relationship addition and /or deletion Relation information on addition or deletion can be edited on the block diagram.
Source code viewer Opens the source code file of the specified block.
Skelton generation A source code skeleton is generated in the source code file when a new block is added. Reused
Software DevelopEnv.
Relation visualization part
プロジ
ェクト
Project filesソース
Source filesRCNA
(Java application) Associated
analysis Data
G RCV (Java application) Setting
Data
Relation analysis part
Parser (Cross reference
generation) Project
Database
5. Evaluation Results
In this chapter, we describe the result of the implementation and the evaluation based on the process flow shown in Figure 5.
Figure 5. Extended MVC structure of the relation display part
5.1. Preparation of Software Resources for Reuse
We prepared a software package consisting of 6,900 source code files, 2,000 object code files, and 520 project files as for Product-A, which is to be reused. Reusing this Product-A while modifying the part of its application logic, and adding some of the new application functionalities, we used it as an example of developing Product-B and to evaluate the proposed method.
5.2. Relation Analysis
We first applied the relation analysis to software Product-B, which we prepared first and to which modifications were going to be made (so that it is identical to Product-A at this stage). In the relation analysis, the point of evaluation is stressed on how the expected analysis functionalities are fulfilled, and how well the analysis is performed in terms of its processing time.
Followings are the results of the relation analysis applied to Product-B before modifications.
•The analysis was accomplished in about 60 minutes
(32 minutes for cross-reference creation and 28 minutes for relation data creation).
•The number of symbols and the number of block
diagrams for which the analysis was made were 677,405, and 9,800, respectively, with the total data size of 1.7 MB. Furthermore, relation analysis data of about 140 MB were created.
•The number of symbols analysed and the number of
software blocks created are far too large for a developer to look over and check one by one manually. Therefore, we confirmed the necessity to visualize them on the relation visualization part.
5.3. Usage of Relation Information of Modules
Having extracted the software modules to be modified, the developer considers other associated software modules next. That is depicted in Figure 6. The associated relation is displayed around the source code file, EcrioPocLib Signaling, which is planned for modification.
The diagram shows the relation information around the specified source code file, EcrioPocLib Signaling. With the arrows as shown in the diagram, it is easier for the developer to get the right image about which function blocks are associated in what direction. Additionally, it is possible to display the associated blocks for check only shown in Figure 6(b) by hiding unnecessary blocks. This enables checking much easier when numerous relations pertain.
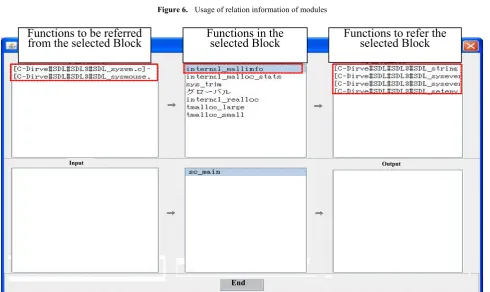
When the inter-module relation is depicted on the block diagram with the least unit of the source code file, it enables checking on file-level implementation. In our example, the relation among five source code files was apparent. When the input and output relations are displayed by every function call level, they are displayed as shown in Figure 7. The list of the functions of the specified block is given at the center of the diagram. Selecting one function causes a display of the input-associated function blocks with their source code file information on the left-hand side and the list of the blocks that use the output results on the right-hand side. In our example, five interrelated source code files were affected each other and each of them was necessary to modify accordingly. Overall, the evaluation results showed that the checking of every relation was accomplished efficiently.
Here, we describe the results of the evaluation of the work performance of associated information visualization.
Starting from the function specified at first, and locating the source code file in which the function is defined, the work of investigation to find its associated modules was compared in the code of 17 functions between the two methods: an ordinary manual level investigation, and the method to use the diagram we are proposing.
In the ordinal method, a developer extracts all files that contain the specified function name, which are searched under the directories that stores all the associated software modules by using the original function name as a key. The developer checks every file among them to locate the source code file that defines the specified function. This process was repeated for all functions that must be checked. It took 7 minutes. Therefore, a 119 min (= 7 min × 17, which is about 2 h) workload was needed to check all 17 functions.
Next, using the relation visualization that we have proposed, the developer first performed the relation analysis. The developer then used the result from the analysis. And it took one and a half minutes to search the files for each function name obtained from the relation analysis data, and
View GRCV main class
DB FILE Display
Model
Controller
to get the block diagram for it displayed. To check all 17 functions, it took approximately 26 minutes. In this comparison between two methods, two medium-skilled programmers of C++ with five years’ experience were assigned. These results are illustrative that the more functions that must be checked, the more efficient this method becomes in reducing the investigation workload for a developer having to look into the relation files.
5.4. Design Phase
Regarding the design phase using the relation information available, we evaluated the case where we
modified the source code files. Then, we confirmed the function to check the difference between the old modules and the new modules at the time of modification.
(1) Linkage to source code file
With the block diagram used for module modification, we confirmed that we were able to check and edit the right program by reaching the associated source code file. Figure 8 shows an example of calling to edit the source code file of the block specified on the relation diagram. This function was useful to save much time and effort to seek the source code.
Figure 6. Usage of relation information of modules
Figure 7. Display of input/output relations
Functions to refer the
selected Block
Functions in the
selected Block
Functions to be referred
from the selected Block
Output Input
End
Figure 8. Linkage to source code files
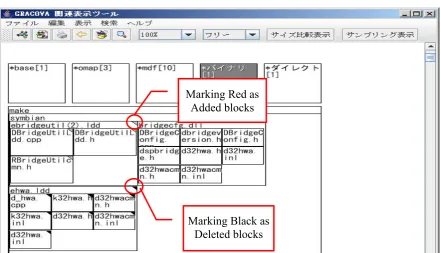
Figure 9. Difference block diagram display
Marking Red as
Added blocks
Marking Black as
Deleted blocks
select
(2) Difference checking
Keeping the associated information among the blocks that are designed using a block diagram, any possible differences between the old modules and new modules under development can be displayed. Using this function, we were easily able to locate the portion in which changes were made. Because it allows the developer to extract any changes made automatically, it is an effective way of avoiding unwanted checking failure or leaking during the source code review or when the developer is checking for any errors caused. Figure 9 shows a screen display that was used when we checked the differences among the associated software modules for which addition or deletion was applied during the library modification process. On the diagram, the added blocks are marked in red, whereas the deleted blocks are marked in black. Consequently, the differences made are visually recognizable.
6. Conclusions
In this paper, we proposed a method of visualizing inter-module relations. The method was designed to support software reuse. We constructed a system based on the proposed software reuse process. Then, we clarified the following facts as a result of evaluation of the system we constructed.
(1) By visualizing the hierarchical module structure of the reused software in block diagrams, all modules which have any dependency with reused software modules are extracted.
(2) By applying and evaluating the proposed method to the software configuration of about 6,900 modules, we confirmed its usefulness.
In the future, we intend to carry out the evaluation of the method by applying it to much larger and multiple software configurations, and also we improve the performance of the relation analysis part of the tool implementation.
REFERENCES
[1] K. Inoue, Y. Ikawa, A framework for embedded software sourcing: Another strategic sourcing in the electronics industry. In Technology Management in the IT-Driven
Services (PICMET), 2013 Proceedings of PICMET'13: pp. 2735-2743 IEEE 2013.
[2] C. Ebert, C. Jones, Embedded software: Facts, figures, and future. Computer, 42(4), pp. 42-52, 2009.
[3] SUZUKI, Yasufumi; OGAWA, Hideto. An aspect-oriented CPU resource reservation framework integrated in MDE tools. In: Proceedings of the 8th international workshop on Advanced modularization techniques. ACM, 2013. p. 1-4. [4] KUMURA, Yusuke, et al. A Low-Power Link Speed Control
Method on Distributed Real-time Systems. In: Embedded Multicore Socs (MCSoC), 2013 IEEE 7th International Symposium on. IEEE, 2013. p. 49-54.
[5] YANG, Kai-Chao, et al. Application-oriented teaching of embedded systems. In: Microelectronic Systems Education (MSE), 2011 IEEE International Conference on. IEEE, 2011. p. 118-121.
[6] EKLUND, Ulrik; BOSCH, Jan. Archetypical Approaches of Fast Software Development and Slow Embedded Projects. In: Software Engineering and Advanced Applications (SEAA), 2013 39th EUROMICRO Conference on. IEEE, 2013. p. 276-283.
[7] H. Washizawa, H. Kambe, H. Koizumi, Reuse of software based on structure management, 2006 Kansai-Section Joint Convention of Institutes of Electrical and Information Engineers, Japan, G12-4,G289, 2006.
[8] CHANG, Chih-Hung, et al. XML-based reusable component repository for embedded software. In: Computer Software and Applications Conference Workshops (COMPSACW), 2011 IEEE 35th Annual. IEEE, 2011. p. 345-350.
[9] WANG, Xichen; WANG, Luzi. Software Reuse and Distributed Object Technology. In: Computational Sciences and Optimization (CSO), 2011 Fourth International Joint Conference on. IEEE, 2011. p. 804-807.
[10] Y. Shinyashiki, T. Mise, Y. Eura, H. Hatanaka, M. Hashimoto, N. Ubayashi, K. Katamine, T. Nakatani, Conceptual model of unexpected obstacles in embedded software, Researching report of Information Processing Society, 145, pp.105-112, 2004.
[11] “Software Reliability Enhancement” [Online]. Available: http://www.ipa.go.jp/english/sec/index.html