Volume 6, Number 1, pp. 71–80. http://www.scpe.org c 2005 SWPS
PROBES COORDINATION PROTOCOL FOR NETWORK PERFORMANCE MEASUREMENT IN GRID COMPUTING ENVIRONMENT
R. HARAKALY∗, P. PRIMET†, F. BONNASSIEUX‡, AND B. GAIDIOZ§
Abstract. The fast expansion of Grid technologies emphasizes the importance of network performance measurement. Some network measurement methods, like TCP throughput or latency evaluation, are very sensitive to concurrent measurements that may devalue the results. This paper presents the Probes Coordination Protocol (PCP) which can be used to schedule different network monitoring tasks. In addition, this paper goes on to discuss the main properties of the protocol; these being, flexibility, efficiency, robustness, scalability and security. This study presents the results of its evaluation and of experiment periodicity measurements.
Introduction. The purpose of Computational Grids is to aggregate large collections of shared resources (computing, communication, storage, information) in order to build an effective and high performance com-puting environment for data-intensive or comcom-puting-intensive applications. The underlying communication infrastructure of these large scale distributed environments consists of a complex interconnection of the public Internet, local area networks and high performance system area networks like Myrinet. Consequently “the network cloud” may exhibit extreme heterogeneity in performance and reliability that can considerably effect the distributed application performance. In a Grid environment, monitoring the network is, therefore, critical in determining the source of performance problems or in fine tuning the system to perform better. For such purposes a network performance measurement system may be deployed over the Grid and net cost function may be computed and provided to a grid resource allocation component. Sensors that aim to measure the different network metrics such as end to end throughput, loss rate or end to end delay are the basic building blocks of the network performance measurement system. However, classical Internet measurement tools can also be used for this purpose. Two kinds of measurement methodology are classically applied (these being active and passive methods).
Active methods inject extra traffic to determine the capacity of the links in terms of latency, loss or bandwidth. Passive methods measure the traffic but are unable to evaluate the real capacity of a link. For example to evaluate the available TCP or UDP throughput tools like Iperf [1] or Netperf [2] send probe packets during a given duration (default 10s). Amounts of send probe data are from 12.5 MB on a 10Mbps link to 1.25 GB on the 1Gbps link.
As the traffic generated by active testing is added to the usual traffic load on the network, there are drawbacks to active methodologies. Firstly, they add a potentially burdensome load to the network; secondly, the additional traffic may perturb the network and devalue the resulting analysis. Therefore, these tools must be appropriately scheduled to minimize the impact on networks while still providing an accurate measurement of a particular network metric.
Grid network monitoring raises problems which are not so critical in classical Internet performance mea-surement. As the number of sites and their respective logical links used by a community of users in a Grid environment are finite the probability of concurrent measurements is high.
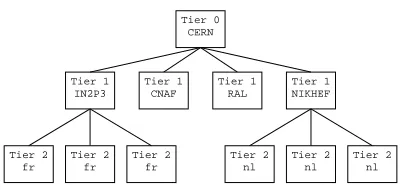
The possibility of sensor probes colliding and thereby measuring the effect of sensor traffic increases quadrat-ically with the number of sensors [3]. This can become highly critical in hierarchical Grids like the HEP physics DataGrid (see section 3), organized following a multi-tiered architecture. For example, the probes from tier 1 to tier 0 (CERN) may collide frequently making tier 0 site a real bottleneck (see fig. 0.1). This leads to chaotic results.
In this paper the main features of the protocol which we have developed for coordinating the network monitoring probes in the European Data Grid (EDG) project [5], are described.
The paper is organized as follows. In the first section probes coordination service and four possible experi-ment scheduling strategies as well, as requireexperi-ments which must be fulfilled for probes coordination service, are discussed. The second section goes on to describe probes coordination protocol, its design principle and char-acteristics. In a third section our implementation of PCP, with EDG distribution, the evaluation methodology and the results of testing are presented. Finally related work is discussed.
∗CNRS-UREC, ENS-LIP, 46, all´ee d’Italie, 69 364 Lyon, France ([email protected]) †INRIA-RESO, ENS, 46, all´ee d’Italie, 69 364 Lyon, France ([email protected]) ‡CNRS-UREC, ENS-LIP, 46, all´ee d’Italie, 69 364 Lyon, France ([email protected]) §INRIA-RESO, ENS, 46, all´ee d’Italie, 69 364 Lyon, France ([email protected])
Tier 0 CERN
Tier 1 IN2P3
Tier 1 CNAF
Tier 1 RAL
Tier 1 NIKHEF
Tier 2 fr
Tier 2 fr
Tier 2 fr
Tier 2 nl
Tier 2 nl
Tier 2 nl
European DataGrid multitiered architecture
Fig. 0.1.Multi-tiered architecture of the European DataGrid project.
1. Probes coordination service.
1.1. Strategies. For coordinating active probes, different approaches, from very optimistic to very pes-simistic are possible. Optimistic strategy, considers that the probability of measurements collision is relatively low. At the opposite, pessimistic strategy aims to avoid any measurement collision. Four main approaches are possible:
• random scheduling
• cron based distributed scheduling
• centralized scheduling
• token passing
1.1.1. Random scheduling. The most optimistic and simple method is random activation of the sensors. We define this as random scheduling. This type of strategy assumes that load generated by active measurement is negligible and considers that all traffic is production traffic. This method is valid for non-systematic monitoring.
1.1.2. Cron based distributed scheduling. The most popular scheduling method uses cron daemon scheduler on each measurement host. Good time synchronization between hosts is required. The smallest time slot enabled by the cron mechanism is one minute. Any time shift, or unexpected long measurement duration can cause collision. This strategy is valuable only if the number of sensors is small or if the measurements are non-intrusive.
1.1.3. Centralized scheduling. At the midpoint between the optimistic and pessimistic scheduling strategies lies the “measurement on demand” strategy. Here a central server coordinates the experiments. This strategy has a single point of failure and is not scalable.
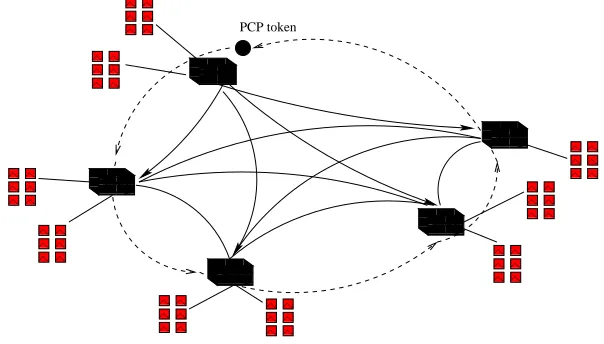
1.1.4. Token passing. Considering high collision probability in a grid context one has to adopt a pes-simistic strategy to avoid contention and to provide a scalable way to generate pertinent network performance measurement. To realize such pessimistic strategy, a token passing protocol may be used (see fig. 1.1).
1.2. Requirements. In a grid context, and especially in the case of a hierarchical ones, the pessimistic strategy has to be privileged. A mechanism implementing such synchronization strategy has to exhibit the traditional properties of a grid service, that are: flexibility, efficiency, robustness, scalability and security.
2. Probes Coordination Protocol.
2.1. Design principle. Probes coordination protocol is a standalone protocol dedicated to network mon-itoring. It is based on a token passing protocol and on a clique concept inspired from the NWS approach [3]. PCP is open in the sense that it can support any type of sensor. It implements many original features like distributed registry, inter-clique synchronization and security.
0000 0000 0000 0000 1111 1111 1111 1111 0000 0000 0000 0000 1111 1111 1111 1111 0000 0000 0000 0000 1111 1111 1111 1111 0000 0000 0000 0000 1111 1111 1111 1111 000 000 000 000 111 111 111 111 0 0 1 1 0 0 0 1 1 1 000 111 0 0 1 1 0 0 0 1 1 1 000 111 0 0 1 1 0 0 0 1 1 1 000 111 0 0 1 1 0 0 0 1 1 1 000 111 00 00 11 11 0 0 0 1 1 1 000 111 0 1 0 1 0 1 0 1 00 11 0000 11110011001100111010001100110011 0000 1111
0000 11110011001100111010001100110011 0000 1111 0 0 1 1 0 0 1 1 0 0 1 1 0 0 1 1 0 0 1 1 0 0 1 1 0 0 1 1 0000 1111 0000 11110011001100111010001100110011 0000 1111 000
111001111001100001100110110 000 111 0 0 0 1 1 100
0 1 1 1 0 0 0 1 1 1 0 0 0 1 1 1 0 0 0 1 1 1 0 0 0 1 1 1 0 0 0 1 1 100
0 1 1 1 0 0 0 1 1 1 0 0 0 1 1 1 0 0 0 1 1 1 0 0 0 1 1 1 0 0 0 1 1 100
0 1 1 1 0 0 0 1 1 1 0 0 0 1 1 1 0 0 0 1 1 1 0 0 0 1 1 1 0 0 0 1 1 100
0 1 1 1 0 0 0 1 1 1 0 0 0 1 1 1 0 0 1 1 0 0 1 1 0 0 0 1 1 100
0 1 1 1 0 0 0 1 1 1 0 0 0 1 1 1 0 0 0 1 1 1 0 0 0 1 1 1 0 0 0 1 1 100
0 1 1 1 0 0 0 1 1 1 0 0 0 1 1 1 0 0 0 1 1 1 0 0 0 1 1 1 0 0 0 1 1 100
0 1 1 1 0 0 0 1 1 1 0 0 0 1 1 1 0 0 0 1 1 1 0 0 0 1 1 1 0 0 0 1 1 100
0 1 1 1 0 0 0 1 1 1 0 0 0 1 1 1 0 0 0 1 1 1 0 0 0 1 1 1 0 0 1 10 0 0 1 1 1 0 0 0 1 1 1 0 0 1 1 0 0 0 1 1 1 0 0 0 1 1 1 PCP token
Fig. 1.1.Probes scheduling using token passing protocol.
1) name:date member:wp7.ens-lyon.fr member:netmon.grid.science.upjs.sk member:ccwp7.in2p3.fr period:120 timeout:10 delay:4
command:iperf -c netmon.cern.ch >> netmon.cern.ch.log
or 2)
command:iperf -c %m >> %n.log
Fig. 2.1. Sample PCP clique definition. 1) Three member sites measure available throughput achievable on their link to CERN using iperf tool. 2) parameters %m and %n will be replaced by member host IP address and name, respectively. It enables to create full mesh measurements easily. In both cases the results (stdout) are appended to the<hostname>.log files.
2.1.2. Token structure. Token is a data structure exchanged within the PCP protocol. Three token types are defined. Different types of tokens are identified bytype of tokenfield in the token header (see Table 2.1) and they are processed according their type.
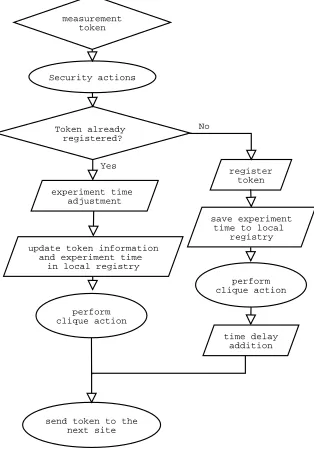
Measurement token is the main token type. It is used for periodic activation of the sensors. Contains information from clique definition combined with the security information to authenticate the token’s owner as well as the integrity of the token information. Table 2.1 illustrates the measurement token structure. The fields can be grouped into different groups following defined characteristics of the protocol. Type of tokenfield distinguish different types of the token. Main definition of the clique is in the fieldsclique namewhich is the unique name of the clique, list of members saved in the arraymembers[], field periodicity and shell command
defining the sensor. Fieldtimedelaybelongs to the group of scheduling accuracy attributes. Protocol robustness is ensured by set of fields token id, regeneration host and timeout and security by fields owner s email and
crypted signature. Field optionis used to distribute additional information. These fields will be discussed in the next sections of the paper.
Table 2.1 Structure of the token
{
byte type of token
string clique name host id members[ ]
time periodicity
string shell command
time timedelay
integer token id
host id regeneration host time timeout
byte option
string owner s email string crypted signature
}
For distribution of control messages between PCP nodes, two additional token types were defined.
Distributed control tokenthese tokens implements clique broadcasting functions when the information has to be delivered to each member site. Typical example of this is a token stop function.
Simple control tokenimplements simple functions where information is exchanged between two nodes. There are token start and token update functions and host locking tokens.
2.2. Characteristics.
2.2.1. Flexibility. It is one of the original characteristic of PCP. It was designed to be flexible in terms of definition of the action and its customizability. Protocol is not bound to any measurement system or tool. Theshell commandparameter allows to fully customize the actions.
2.2.2. Protocol robustness. The robustness is very important for such a distributed protocol. Moni-toring data and services using these data like forecasting and network cost function needs to be continuously available. This impose the very strong requirement on the monitoring longevity. To reach high robustness and fault tolerance the protocol is based on a peer-to-peer approach, which insures high independence of participat-ing sites. Nevertheless the token passparticipat-ing architecture, raises several classical important issues that have to be addressed.
Lost token: The token might be lost due to host or network failures. Token timeout based token regeneration mechanism initiates a creation of new token after timeout expiration.
Delayed token: In case of big instabilities of the network it may happen that measurement takes longer than typically. The token will not be received in time at the next hop and in some cases the timeout will expire. In such situation the token regeneration mechanism will initiate a new token, like in the case of the lost to-ken. After end of the long experiment, the original token will be sent to this hop. Since this host has already regenerated a new token, this original token will be discarded. Newly generated token and original ones are differentiated by using thetoken id field which is incremented at each regeneration. Thus, if a system receives token withtoken id lower than is locally registered, it will discard a token.
Token storm: Occurs when tokens with the sametoken id on subsequent hosts are created. It might hap-pen in case of misconfiguration of the system, or in case of real network instabilities. To solve this issue the
regenerating host identifier was used, which characterizes the site which has regenerated the token. If a system receives token withregenerating host lower than is locally registered it will discard it.
Figure 2.3 displays four scenarios of token passing. a) shows typical scenario when token is delivered in time.
measurement token
Security actions
Token already registered?
register token
perform clique action
perform clique action experiment time
adjustment
time delay addition update token information
and experiment time in local registry
save experiment time to local
registry
send token to the next site
No
Yes
Fig. 2.2.PCP experiment token passing through system
c) Delayed token: Due to network instabilities the measurement on the node 2 takes very long. It causes expiration of the timeout on the node 3, which regenerates a token and start measurement. The former token is delivered after the timeout expiration to the node 3 which discards it.
d) Token storm: Creation of the token storm due to small timeout parameter value. As in the previous case, network instability causes long measurement delay on node 2. Node 3 regenerates a token, but due to shift of experiment start time, the experiment on node 3 cannot be finished before timeout expiration on a node 4. This regenerates again the token. The delayed tokens from node 2 and node 3 the receiving nodes will be discarded.
Node 1 Node 2 Node 3 Node 4
Node 1
Node 2
Node 3
Node 4
time
Experiment start
Timeout
a)
b)
c)
d) id = i
id = i
id = i
id = i
id = i+1 id = i+1 id = i+1 id = i+1
Fig. 2.3.Token passing issues. a) normal passing, b) lost token, c) delayed token and d) token storm.
iperf pinger
pinger
iperf pinger
iperf
pinger clique
iperf clique
node A
node B
node C
node D
Fig. 2.4.PCP distributed registry architecture. Each node creates its own local registry of cliques/tokens it belongs.
registers only cliques it belongs to (nodes A, C and D registers clique pinger and nodes A, B and D registers clique iperf).
A large number of sensors can be easily managed by grouping them in multiple logical groups. They might be defined according to the network topology or any other characteristics of the measured system. In the case of the EDG project the cliques definition policy reflects the multi-tiered architecture.
Since measurement host might run multiple sensors as well as any sensor might be member of multiple cliques, it is necessary to analyze the interactions between different cliques. For example the Tier1 IN2P3 site in the fig. 0.1 belongs to two cliques. If the probe is bandwidth measurement like Iperf, the Tier1 site might be simultaneously source/destination of two experiments of two cliques, making the measurement unreliable. To solve this problem an inter-clique synchronization mechanism based on host locking has been introduced. Both source and destination hosts are locked during experiment. If other lock request arrives to one of these nodes, the requesting node will be blocked until the lock is released.
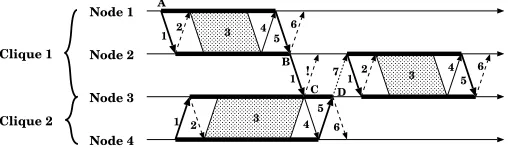
Figure 2.5 illustrates the host locking mechanism. In this figure node 1 to node 3 are members of the Clique 1 andnode3 andnode4 are members to the Clique 2. At time Anode1 sends locking request tonode2 (message1), it is locked and returns successful result in message 2. Afternode1 starts monitoring experiment (message 3). At the end of the experiment information message 4 is sent from node2 tonode1. N ode1 asks to unlock thenode 2 (message 5) which answers with the unlocking status (time B, message 6) and starts its own measurement to thenode3 with the locking request (message 1). Sincenode3 in time C is still locked due to the experiment with node 4,node 3 answers to the locking request with the error message (‘!’). It causes thenode2 to wait for the end of the experiment with the node3. N ode3 adds thenode 2 to the waiting list and after successful unlocking it informs the node2 with the information message 7 that it is unlocked. This message is followed by locking request fromhost 2.
Host locking mechanism raises an issue of the deadlocks. Deadlocks may strongly disturb the measurement and destroy the measurement periodicity. The detailed study of the measurement scenario and good clique creation policy are necessary to minimize the probability of deadlock creation. To enable the system to release itself from a eventual deadlock state, we introduce the timeout mechanism that releases the locks and prevent deadlocks.
2.3. Scheduling accuracy. Network monitoring data can be used for many different purposes. They may serve as information for network administrators as well as for optimization of data transfers and resource scheduling in grid systems. The network monitoring data may also serve as a basis for prediction of network metrics. Currently used prediction methods (e.g. [3]) require good measurement periodicity. To meet this requirement PCP has a built-in mechanism for start time adjustment.
second is the fluctuation of the token transmission time. Both are due to the network instable behavior. The aim of start time adjustment is to achieve highest timing precision possible. Experiment is triggered using time-stamp saved into local registry during previous experiment and the periodicity value. If the token arrives in advance, the start of clique action is delayed, otherwise the clique action is executed immediately and experiment execution time is adjusted.
tw= (tn−1+p)−t
wheretw is time adjustment delay,tn−1 is the experiment time-stamp saved during previous experiment, pis the periodicity andt is current time.
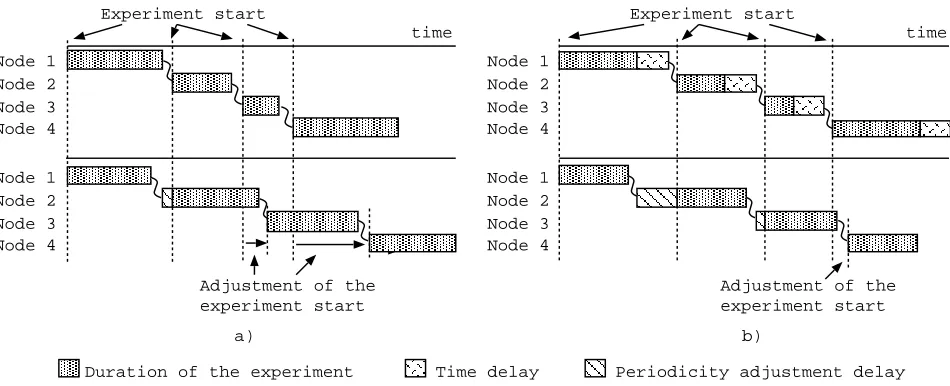
In order to adapt to the experiment length and transmission delay fluctuations we introduced an optional parameter called timedelay. This timedelay is inserted after the experiment only during the first round (fig. 2.6). It, in conjunction with start time adjustment enables to absorb most of mentioned fluctuations and to achieve good measurement periodicity even at the beginning of the measurement.
! Node 1
Node 2
Node 3
Node 4
time
1
1
1 1 2
2
2
3 3
3 4
4
4 5
6
5
6
5 6 7
A
B
C D
Clique 1
Clique 2
Fig. 2.5.Communication using inter-clique locking protocol.
2.4. Security. In distributed computing the security is one of the most important issue. Although PCP is designed like user level process without special privileges, the possibility to launch any external program requires to provide the highest security level possible. Security issues might be divided into two groups:
• Host security: Local system administrator must have full control over the host. There must be possibility to define local security policies, authentication of the token owners, authorization of the tools used. Token owner’s authorization is implemented using its digital signature and its validation using the public key of authorized person, and tool authorization is done by copying it to the$PCPD HOME/scripts directory.
• Token security: In this part the goal is to provide and ensure access rights to the token information and to the token itself. It is necessary to ensure, that content of the token might be changed only by its owner and in case of the violation, to detect it. In case of the token function (token stoportoken update
) enable it only in case it is issued/signed by token owner.
Previous items shows the necessity of assignment the owner to the token and introduction of the security fields into the token structure. Table 2.1 shows the token structure with the security fields: token owner’s e-mail, and its digital signature. Token is signed using crucial token information (cannot be changed using token update function) as token name, clique action and token owner’s e-mail and owner’s private key. The signature is included into the signature field of the token.
3. Application and results.
3.1. European DataGrid project. The PCP protocol has been developed within the European Data-Grid project that aims to develop, implement and exploit a large-scale data and CPU-oriented computational GRID [5]. The objective of this project is to enable next generation scientific exploration that requires intensive computation and analysis of shared large-scale databases, from hundreds of TeraBytes to PetaBytes, across widely distributed scientific communities. The EDG testbed comprises today more than 40 sites with hundreds of processors organized in a multi-tiered architecture.
Node 1
Node 2
Node 3 Node 4
Node 1
Node 2
Node 3 Node 4
Node 1
Node 2
Node 3 Node 4
Node 1
Node 2
Node 3 Node 4 time
Adjustment of the experiment start
Experiment start Experiment start
time
Adjustment of the experiment start
a) b)
Time delay
Duration of the experiment Periodicity adjustment delay
Fig. 2.6. Token passing in first and second round without time delay a) and with time delay b).
best use of this resource. Anetwork cost functionthat is able to compare two destinations is provided. It is computed from collected metrics. For example, givensrca source site,dest1and dest2, two destination sites,
v an amount of data to be transferred,r1 et r2the estimatedthroughput of link1 and link2. The network cost
functionf is expressed as a transfer delay that is the relevant metric for the optimizer. We have: (f(src, dest1, v) =v/r1)and(f(src, dest2, v) =v/r2)
and
(f(src, dest1, v)≤f(src, dest2, v))or(f(src, dest2, v)≤f(src, dest1, v))
EDG GridNetMon is a prototype set of tools for network monitoring within the framework of a simple and extensible architecture that permits the basic network metrics to be published to the Grid middleware, and also for them to be available, via visualization, to the human observer. The architecture for network monitoring comprises four functional units, namely, monitoring tools or sensors, a repository for collected data, the means of analysis of that data to generate network metrics and the means to access and to use the derived metrics. The EDG Network monitoring system implements basic monitoring tools which produce the standard measurements: Round Trip Delay, Packet Loss, Total Traffic volume, TCP and UDP Throughput, Site Connectivity and Service Availability. Well known monitoring tools have been tested and integrated in the architecture. New specific software has also been developed within the project to fill several gaps.
Grid network measurement architecture raise lot of specific problems like deciding where, when and how to deploy the sensors in the Grid, but also deciding how to schedule the measurements especially when they may be intrusive. PCP protocol address this last issue.
We have implemented PCP under RedHat 7.3 distribution of the Linux in a daemon calledpcpd. To support multiple tokens the multi-threaded architecture is used. Current version of the pcpd implements basic features of PCP. The inter-clique scheduling is actually not supported. It implements only authorization of allowed commands/scripts by administrator by installing them to$PCPD HOME/scriptsdirectory.
3.3. Evaluation. We set up a methodology which consists of different actions to evaluate the protocol. To test individual properties of the protocol we built up different testbeds with different network properties.
• Well provisioned testbed, this testbed provides higher latency between 10ms and 30ms, small performance fluctuations and low packet losses. These testbeds are used to study the scalability issues and the inter-clique synchronization.
• Wide area unstable testbed,this platform provides latencies up to 80mswith large instabilities and important packet loss. This testbed serves for the validation of the protocol robustness (the timeout based token regeneration as well as elimination of the duplicate tokens or token storms), scalability and the scheduling accuracy (influence of thetimedelayparameter to the scheduling accuracy and the start time adjustment).
These testbeds are built on the network of ENS Lyon, metropolitan network of Lyon, EDG WP7 testbed based on European academic core network GEANT and national NRNs. WAN testbed adds hosts in Slovakia.
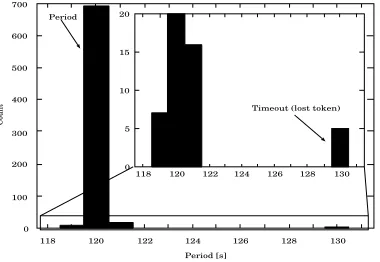
Here are presented the results of the evaluations in the WAN testbed. Network connection during the eval-uation process showed instabilities due to traffic in the bottleneck connection between Slovak NRN (SANET), and GEANT network. Thanks to that the protocol robustness and scheduling accuracy were studied. Long-term tests were conducted for approximately 2−3 weeks. Results prove high resistivity of the protocol against network instabilities and effectivity of the timeout-based token regeneration mechanism. Since network connec-tion showed important fluctuaconnec-tions of the network parameters (latency, available bandwidth) we studied the scheduling accuracy of the protocol. Experiment was done using one clique consisting of four member sites (two in France and two in Slovakia). Periodicity of the measurement was set to 120s, timeout parameter was set to 10sand timedelay parameter was set to 4s. Results of this measurement are displayed on Figure 3.1. It shows the histogram of measured periodicities. The highest peak corresponds to the periodicity of 120s. Satellite peaks (emphasized in the inset) corresponds to the experiment periodicity dispersion due to 1sresolution of the used timer and peak at 130scorresponds to activation of token regeneration mechanism.
Current version of pcpd is deployed on some EDG monitoring testbed sites to schedule intrusive Iperf-based available throughput measurements. During future deployment of the PCP, the scalability and inter-clique scheduling will be studied.
700
600
500
400
300
200
100
0
118 120 122 124 126 128 130 20
15
10
5
0
118 120 122 124 126 128 130 Period
Count
Period [s]
Timeout (lost token)
Fig. 3.1.Measured experiment periodicity distribution. Experiment period120s, timeout10s. Peak at130sis due to timeout expiration and token regeneration
4. Related work. As presented in section 1.1 different scenarios are possible to schedule network moni-toring activities. Appropriate scenario depends on the used tool as well as on a measurement architecture.
Cron based distributed scheduling approach is adopted for example in PingER tool [6]. Ping experiments are nonintrusive thus the optimistic scenario is valid.
Another example of using a cron based scheduling is a IperER tool. Iperf measurements may be very intru-sive. That makes this approach quite limited. It request very good time synchronization on the measurement nodes and a central (administrative) agreement about the reservation of the timeslots for each measurement node to avoid conflicting measurements. The minimum of 1 minute timeslot per experiment, given by cron daemon, strongly reduces the scalability of the mechanism.
Network Weather System (NWS) [3] uses token passing approach. It defines aClique protocol to schedule exclusive network measurements. Clique protocol is embedded in the NWS infrastructure and it is fully dedicated to built-in monitoring actions and don’t support the scheduling of external sensors.
5. Conclusion. In this article we presented Probe Coordination Protocol. It is based on the pessimistic scheduling scenario. This protocol is open, scalable, highly customizable, secure and robust.
We present an evaluation of our implementation of the PCP protocol. It is deployed within the European DataGrid project on several sites for synchronizing the network experiments executed by EDG grid monitoring infrastructure. We observed very good robustness and fault tolerance of the protocol and efficiency of the timeout based token regeneration. We reported the results of experiment periodicity measurements. They showed good periodicity distribution.
This lightweight and robust peer-to-peer tool may be adapted to implement any type of synchronization or ordered broadcast in grid environment.
Acknowledgments. This work is supported by European DataGrid project IST-2000-25182, Unit´e R´e-seaux du CNRS and INRIA project RESO.
REFERENCES
[1] Iperf Home Page:http://dast.nlanr.net/Projects/Iperf
[2] Netperf Home Page:http://www.netperf.org/
[3] R.Wolski, N.T.Spring, J. Hayes,The Network Weather Service: A Distributed Resource Performance Forecasting Service
for Metacomputing,Future Generation Computer Systems, 1998
[4] B. Gaidioz, R. Wolski and B. Tourancheau,Synchronizing network probes to avoid measurement intrusiveness with the
network weather service,In Proc. 9th IEEE Symp. on High Performance Distributed Computing, 2000
[5] DataGrid project Home Page:http://www.eu-datagrid.org/
[6] L. Cottrell, W. Matthews, C. Logg,Tutorial on Internet monitoring and pinger at slac, July 1999, Available from
http://www-iepm.slac.stanford.edu/comp/net/wanmon/tutorial.html
[7] RTPL Home Page:http://fseven.phys.uu.nl/∼blom/rtpl/index.html
Edited by: Dan Grigoras, John P. Morrison, Marcin Paprzycki
Received: September 30, 2002