Real Remote Experiment with Embedded Synchronized
Simulation “Remote Wave Laboratory”
https://doi.org/10.3991/ijoe.v13i11.7650
Franz Schauer, Miroslava Ozvoldova , Michal Gerza, Michal Krbecek, Tomas Komenda!!", Sayan Das, Mbuotidem Ime Archibong
Tomas Bata University in Zlin, Zlin, Czech Republic
Abstract—The paper describes a new remote experiment in REMLABNET
as “Remote Wave Laboratory” constructed on the ISES (Internet School Exper-imental System). The remote experiment contributes to understanding of con-cepts of harmonic waves, their parameters (amplitude, frequency and period, and phase velocity) and dependence of the instantaneous phase on time and path covered. Also it serves for the measurements and understanding of the concept of the phase sensitive interference and the superposition of paral-lel/perpendicular waves.
Keywords—to ISES, remote wave laboratory, embedded multiparameter
simu-lation, wave phenomena, parameters of waves, interference, superposition
1
Introduction
Waves and their phase sensitive interference and superposition are important phe-nomena constituting a major problem in students’ teaching of waves and optics, due to the necessary students’ imagination. Then, the phenomena of interference of waves and their superposition are difficult to understand. The proposed “Remote Wave La-boratory” is aimed at real measurements of the phase and the most frequent phenome-na of phase-sensitive wave superposition on real physical instrumentation with multi-ple use and applications. As a teaching tool for better understanding of real measure-ments serves the embedded real multiparameter simulation of the observed phenome-na introduced for the first time in our remote experiments.
2
Purpose or goal
fre-Short Paper—Real Remote Experiment with Embedded Synchronized Simulation “Remote Wave Lab…
! The concept of the instantaneous phase (corroborated with our electronic phase laboratory) as the function of the elapsed time and the path covered by the wave (in relation to two periodicities of waves - in time and in space),
! The concept of the phase sensitive interference and the superposition of paral-lel/perpendicular waves.
3
Approach and schematic arrangement
3.1 Theory of wave laboratory
Let us suppose the signal detected by both acoustic detectors is !!! ! !"#!!"!!and !!! ! !"#!!"! ! !!!!.
• Parallel interference of both signals gives in general
!!!!!!! ! !"#!!"!! ! ! !"# !"! ! !!! ! ! !"#!!" ! !!!, (1) where the amplitude A and the initial phase "!of the resulting signal is
!! !! ! ! ! !"#!!!! ! (2)
!"!!!!! ! !!!!"# !!!"#!!!!! !! (3)
• Perpendicular superposition of both signals gives ! ! ! !"#!!"!! and ! ! ! !"#!!"! !!!! ! !!!!!gives in general
!!! !!"#$% !! ! !!! !!!!"# !! !! (4)
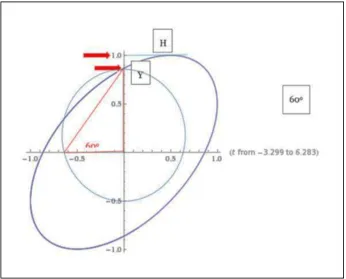
which reduces in particular cases "" = 0 and #/2 into the straight line and circle, respectively, in other cases of "" gives an ellipse.
• Phase measurements - it is then possible to determine the phase shift of both signals (waves) "" from the position of the ellipse as shown Fig. 1.
Fig. 1. Scheme for the phase shift "$ of two waves determination using eq. (4) and (5)
3.2 Students’ results in computer oriented hands-on laboratory
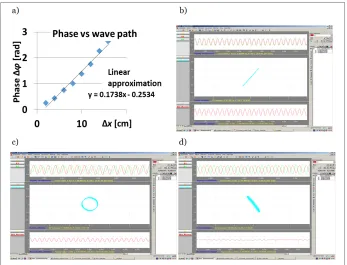
Computer oriented hands-on laboratory exercise on acoustic waves has been for considerable time the part of students’ laboratory. Its arrangement is similar as that in Fig. 3, with positioning of the sound detector manually. The students’ results are in Fig. 2, where a) depicts the phase shift dependence of both signals from detectors ""
on the wave path difference of both waves "x for wavelength # = 35.3 cm, and in b)-d) are the superpositions of two waves’ signals for phase shifts "" = 0 rad b), "" = #/2 rad and c) "" = # rad d). The upper panel shows the signals of both the sound waves, the middle panel the phase-sensitive superposition - Lissajous figures (for perpendicular waves) and the bottom panel shows the phase-sensitive interference signal (for parallel waves).
3.3 “Remote Wave laboratory”
Short Paper—Real Remote Experiment with Embedded Synchronized Simulation “Remote Wave Lab…
Fig. 2. Examples of student’s work on hands - on experiment a) Phase shift "" dependence
on the difference of the wave path "x, b)-d) Superposition of two waves for phase shift ""=0 rad b), ""= $/2 rad c), ""= $rad d), all for the wavelength #= 35.3 cm; the
upper panel shows signal of both waves, the middle panel phase-sensitive superposition-Lissajous figures (for perpendicular waves) and bottom
panel phase-sensitive interference signal (for parallel waves)
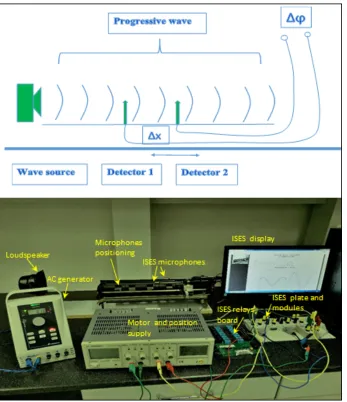
coherent signals, corresponding to the detectors distance "x. Both signals are phase-sensitively added/superimposed in parallel/perpendicular directions.
Fig. 3. Schematic arrangement (upper panel) and the real RE “Remote Wave Laboratory” (lower panel) with the loudspeaker as the acoustic wave source, two acoustic detectors
1 and 2 and the driving motor for moving detector 2, producing the phase shift "$ of both signals, corresponding to the detectors´ distance "x
3.4 Embedded simulation of the wave laboratory
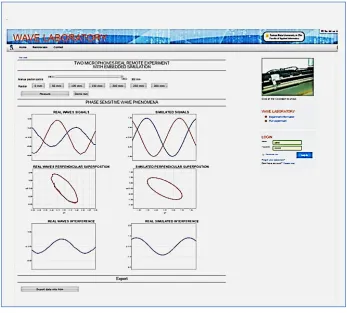
In Fig. 4 is the web page of RE “Remote Wave Laboratory” (from Fig.3) with the measured data output (left) and the output of the embedded simulation (right).
Short Paper—Real Remote Experiment with Embedded Synchronized Simulation “Remote Wave Lab…
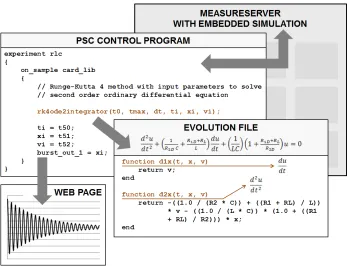
equations [4]. The example of the use for the response of the RLC circuit to voltage perturbation is shown in Fig. 5 [2], here was used for simple plotting of calculated quantities according to eqs. (1-4).
The Measureserver unit is a significant software part of the ISES RE concept. It is the processing and communicating server located between the physical hardware and connected clients. The Measureserver core is designed as an advanced finite-state machine to setup and process the logical instructions solving prescribed activities. Its functioning is based on the control program that comes from the .psc file loaded to the Measureserver before its startup.
When the client starts RE, the Measureserver begins the communication with ISES HW. Then the RE is ready to perform all the required measurements according to the web page instructions given by the client. Then, the Measureserver obtains experi-mental data from the ISES modules (meters, sensors and probes) and transports them again on the client’s web page for the analysis [3].
Fig. 4. Example of the view of the RE web page “Remote Wave Laboratory”, measured data,
(left) and simulation of the observed phenomenon (right); from upper graph: both sig-nals-perpendicular superposition- interpherence; the position of the movable detector is
Fig. 5. The general mathematical unit for ISES remote experiments enabling both arithmetical operations and differential equations solutions
The embedded ES works in a similar way, replacing the ISES module by the math-ematical solver and providing the data for graphical comparison with the measured data. The difficult problem was the synchronization of both measured and simulated data into one time dependent graphical representation to study the role of model pa-rameters on the resulting signals.
4
Conclusions
The remote environment “Remote Wave Laboratory” provides the following knowledge from waves:
! Phase of the wave as a function of the covered distance (with respect to the refer-ence signal and its linearity),
! To examine parameters of the wave - the phase velocity and the wavelength in a medium, the amplitude, the frequency and the period of the wave,
! To examine the concept of the coherence of two acoustic waves,
condi-Short Paper—Real Remote Experiment with Embedded Synchronized Simulation “Remote Wave Lab…
! To show the phase sensitive superposition of two perpendicular waves and to find the phase shift and amplitude to the reference wave,
! To find the integer quotient of frequencies of an unknown waves.
5
Acknowledgment
The support of the project of the Swiss National Science Foundation (SNSF) - “SCOPES”, No. IZ74Z0_160454 is highly appreciated. The support of the Internal Agency Grant of the Tomas Bata University in Zlin No. IGA/FAI/2017 for PhD stu-dents is acknowledged.
6
References
[1]OZVOLDOVA, Miroslava and Frantisek SCHAUER. Remote Laboratories in research-based education of real world, Peter Lang, Int. Acad. Publ., Frankfurt, F. Schauer (ed.), 157 pp., 2015, ISBN 978-80-224-1435-7.
[2]GERZA, Michal, Frantisek SCHAUER and Petr DOSTAL. Embedded Simulations in Real Remote Experiments for ISES e-Laboratory. In: EUROSIM 2016. Oulu, Finland, 653 – 658. ISBN 978-1-5090-4119-0.
[3]GERZA, Michal a Franti%ek SCHAUER. Intelligent Processing of Experimental Data in ISES Remote Laboratory. International Journal of Online Engineering [online]. Austria, 2016, 58 – 63. ISSN 1861-2121.
[4]Inspiration of prof. F. Esquembre in solver compiling is appreciated.
7
Authors
Franz Schauer received a M.S. degree in Electronics from the Brno University of Technology in 1963 and his Ph.D. degree in Solid State Physics from Prague Univer-sity of Technology in 1978. In 1982 he was appointed Associate Professor and in 1988 Professor in Condensed Matter Physics at the Technical Academy in Brno, Czech Republic. In 1993-2002 he was with the Faculty of Chemistry, Brno University of Technology and since then he was with the Polymer Centre of the Faculty of Tech-nology. At present he is with the Tomas Bata University in Zlín, Faculty of Applied Informatics, Czech Republic. His main activities are molecular organic electronics, electronic structure spectroscopy by electrochemical and charge injection methods and computer assisted experiments. He is the author of about 300 papers in both Solid state physics, Education practice and Remote laboratories with about 350 SCI cita-tions.
Tomas Bata University in Zlin. Her main activities are optical properties of chalco-genide and heavy metal optonic glasses and e-learning in Physics teaching.
Michal Gerza, Michal Krbecek, Tomas Komenda, Sayan Das, Mbuotidem Ime Archibong are PhD students with the Tomas Bata University in Zlín, Faculty of Applied Informatics, Nad Strán&mi 4511, Zlín, CZ- 760 05, Czech Republic