Determining dimensional, gravimetrical and frictional properties
of red radish seeds (Raphanus Sativus L.) as a function of
moisture content
Amir Hossein Mirzabe
1*, Mojtaba Taheri
1, Habil Asaei
2,
Mohammad Hossein Kianmehr
1(1.Department of Mechanical Engineering of Biosystems, Aboureihan College, University of Tehran, Tehran, Iran;
2. Biosystem Engineering Department, Faculty of Agriculture, Shiraz University, Shiraz, Iran.)
Abstract: To design the planting, separating, threshing, sizing and packing machines for agricultural products, physical and mechanical properties of the products should be known. In this paper, some physical properties of red radish seeds were studied. Dimensional parameters, when moisture content equals to 5.65% based on dry bases (d.b), were measured using image processing technique. Effects of moisture content on gravimetrical and frictional properties of the seeds, including mass of single seed, 1000-unit seed, bulk density, true density, porosity, static coefficient of friction on various surfaces, and angle of repose based on pouring, Hele-Shaw, empting and filling methods were studied. Effects of volume of the container (150, 350, 550 and 750 mL) and height of fall on bulk density and porosity of the radish seeds when moisture content equals to 5.65% (d.b) were studied. Also length, width, thickness and mass distributions of radish seeds were modeled using Gamma, Generalized Extreme Value and Weibull distributions. Results showed that length, width and thickness of the seeds ranged from 0.660 to 0.900 mm, 0.524 to 0.763 mm and 0.490 to 0.759 mm, respectively. With increasing volume of the container from 150 to 550 mL, bulk density of the seeds increased; but with increasing volume of the container from 550 to 750 mL, bulk density of the seeds decreased. With increasing volume of the container from 150 to 550 mL, bulk density of the seeds increased; but with increasing volume of the container from 550 to 750 mL, bulk density of the seeds decreased. With increasing moisture content from 5.65 to 21.71% (d.b) , bulk and true density of the seeds decreased from 694.807 to 654.889 kg/m3 and 1141.810 to 1057.795 kg/m3; but with increasing moisture content from 5.65% to 21.71% (d.b) , 1000-unit mass increased from 6.98 to 7.17 g.
Keywords: image processing technique, dimensional properties, modeling, moisture content, gravimetrical properties, frictional properties.
Citation: Mirzabe, A. H., M. Taheri, H. Asaei, and M. H.Kianmehr. 2015. Determining dimensional, gravimetrical and frictional properties of red radish seeds (Raphanus Sativus L.) as a function of moisture content. Agric Eng Int: CIGR Journal, 17(4): 288-310.
1 Introduction
1Radish (Raphanus sativus) is an edible root vegetable
of the Brassicaceae family that was domesticated in
Europe in pre-Roman times (Lewis‐Jones et al. 1982).
Radish seeds are grown and consumed throughout the
world. Radish has numerous varieties, varying in size,
color and duration of required cultivation time. There are
Received date: 2015-07-02 Accepted date: 2015-08-16 *Corresponding author: Amir Hossein Mirzabe, Department of Mechanical Engineering of Biosystems, Aboureihan College, University of Tehran, Tehran, Iran. Email: [email protected]
some radishes that are grown for their seeds; oilseed
radish is grown, as the name implies, for oil production.
Almost all parts of the plant including leaves, seeds
and roots are utilizable in medicine (Alqasoumi et al.
2008). The fresh juice obtained from leaves are diuretic
and laxative, roots are used for urinary complaints,
haemorrhoids, gastrodynic pains and several gastric
ailments. Seeds are expectorant, digestive, diuretic,
laxative and carminative and the root extract has been
reported to have antiurolithiatic properties (Alqasoumi et
Black radish (Raphanus sativus L. var. niger) root has
been used in folk medicine since antiquity as a natural
drug for the stimulation of bile function. According to in
vitro studies, the squeezed juice from black radish root
exhibits significant antioxidant properties (Lugasi et al.
2005). Lugasi et al. (2005) reported that although the
exact mechanism of the biologically active compounds in
black radish on the lipid metabolism and lipid
peroxidation is not clear yet, a beneficial effect of the
drug was evident in alimentary hyperlipidemia.
White radish has an abundance of health benefits, not
only because it belongs to the crucifer family of
flowering plants highly efficacious in fighting cancer, but
also because it packs 10 times as much vitamin C as
apples or pears. White radishes have also been found to
contain a wide variety of isothiocyanates, which have
anti-carcinogenic properties. The large white radish has
long been called "little ginseng" in China. The old saying
goes that "when radishes come onto the market, nobody
will go to the pharmacies".
Radish is considered to be a model crop and is widely
used for studies related to heavy metal pollution (Khan
and Frankland 1983; Kostka-Rick and Manning 1993).
The advantage of using radish and other members of
cabbage family for heavy metal studies are well described
in Mathe-Gaspar and Anton (2002). The influence of
brassinosteroids on seed germination and seedling growth
under Cd toxicity in Raphanus sativus seedlings were
examined by Anuradha and Rao (2007).
It was reported that radish roots could accumulate large
amounts of lead (Pb), which could cause a potential
health risk in polluted conditions (Lane and Martin 1977;
He et al. 2008). Considerable efforts have been invested
into investigating Pb stress in radishes, especially its
accumulation, translocation, physiological and metabolic
variations, and cell deposition (Inoue et al. 2013).
However, little is known about the mechanism of radish
plant responses to Pb stress at the molecular level, i.e.
gene expression variations under Pb stress (Wang et al.
2013).
The proper design of process equipment depends
essentially on the physical and mechanical properties of
agricultural crops and products. Different researchers
report the use of characteristic dimensions to determine
the size of seeds (Aviara et al. 2013; Garnayak et al.
2008). Size and shape are of importance for separator and
sorter and can be used to determine the lower size limits
of conveyors. Furthermore, the characteristic dimensions
allow a calculation of the surface area and volume of
grains, important aspects for the modeling of drying and
ventilation. Porosity affects the bulk density which is also
necessary factor in the design of dryer, storage and
conveyer capacity while the true density is useful to
design separation equipment (Sologubik et al. 2013). The
angle of repose and coefficient of friction are considered
by engineers as important properties for the design of
seed containers and other storage structures and
accessories. The static coefficient of friction limits the
maximum inclination angle of conveyor and storage bin.
The amount of power requirement for conveyor depends
on the magnitude of frictional force. Angle of repose is a
useful parameter for calculation of belt conveyor width
and for designing the shape of storage.
There are many published literature on radish
(Moreland et al. 1974; Sekimata et al. 1989; Terras et al.
1992; Hwang 2009); numerous studies have been
conducted on physical and mechanical properties of
agricultural seeds, grains, fruits, nuts and kernels.
Sometimes many similar studies have been conducted on
one and same product; both similar and different results
have been obtained.
Literature review showed that there is one published
work on physical properties of radish seeds. The length,
width and thickness of radish seeds, 1000-seed mass,
projected area, sphericity, terminal velocity, bulk density,
true density, porosity and static coefficient of friction of
radish seed against surfaces of four structural materials,
namely, rubber, aluminum, stainless steel and galvanized
iron were measured as a function of moisture content in
(2010). There are some dimensional parameters that were
not measured by Çetin et al. (2010) such as geometric
mean diameter, arithmetic mean diameter, equivalent
diameter, surface area, volume, flakiness ratio and
elongation ratio. On the other hand, for a single seed,
dimensions and mass can be determined; however, values
of these properties differ for each individual seed to other.
Normally, we are not interested to know the properties of
each individual seed, but description of the frequency
distributions of the dimensions of the whole sets of the
seeds is needed for designing agricultural equipment
(Mirzabe et al. 2012).
Although angle of repose is a very important parameter
for granular materials and agricultural seeds, Cetin et al.
(2010) did not investigate the effect of moisture content
on angle of repose. Although measuring bulk density of
the agricultural seeds has a standard method (height of
fall equal to 150 mm, volume of the container equal to
500 mL), in practice, when filling large reservoirs and
silos, we do not normally use standard parameters, so the
effect of height of fall and volume of the container are of
importance parameters on bulk density. Cetin et al. (2010)
did not investigate these effects. The aim of this study
was to investigate dimensional properties, gravimetrical
properties and frictional properties of red radish seeds.
The dimensional parameters investigated include three
principle dimensions (length, width, and thickness),
geometric mean diameter, equivalent diameter, arithmetic
mean diameter, sphericity, volume, surface area,
projected area, flakiness ratio, elongation ratio, aspect
ratio, and modeling of dimensions by statistical functions.
The effects of the moisture content on mass of single seed,
1000-unit seed, bulk density, true density, porosity, static
angle of friction on various surfaces, and angle of repose
based on pouring, Hele-Shaw, empting and filling
methods were investigated. Also effects of the volume of
the container and height of fall on bulk density and
porosity were investigated.
2 Materials and methods
2.1 Sample preparation
Three kilograms of the red radish seeds were bought
from a local market in Varamin, Tehran province, Iran in
2013. The seeds were cleaned manually to remove all
foreign materials. The moisture content of each sample
was determined using the standard hot air oven method at
105±1 oC for 24 hours (Gupta and Das 1997; Altuntaş et
al. 2005), and using Equation 1, moisture content of the
seeds based on dry bases (d.b) were calculated:
Where,M is moisture content of the sample, % (d.b) ;
Mw is the initial mass of the sample or wet mass, g; Mi is
the initial moisture content of the sample, % (d.b) ; and
Md is the final mass of the sample or dry mass, % (d.b) .
The average values of three replications were reported
as moisture content for the seeds. Initial value of the
moisture content of the radish seeds was equal to 5.65%
(d.b). The tests which investigated dimensional properties
and the effects of the volume container and height of fall
on bulk density and porosity were conducted in this
moisture content level.
In order to study effects of moisture content on
gravimetrical and frictional properties, the seeds were
divided into three portions labeled A, B, C and D. The
sample A was left at the market storage moisture content
(5.65 % (d.b)), while a different distillated water was
added to samples B, C, and D at room temperature in
order to raise their moisture content to the desired
different levels, based on the following formula
(Garnayak et al. 2008):
Where, Mwater is the mass of water added, kg; Wi is the
initial mass of the sample, kg; Mi is the initial moisture
content of the sample, % (d.b); and Mf is the final
moisture content of the sample, % (d.b) .
The sample was packed in sealed polyethylene bags
and kept in a refrigerator for 72 hours to enable the
The moisture content of each sample was determined
using the standard hot air oven method at 105±1oC for 24
h (Gupta and Das 1997; Altuntaş et al. 2005; Özarslan
2002). The average values of three replications were
reported as moisture content for each sample. The
samples with different moisture content were stored in
refrigerator until the test.
2.2 Dimensional properties
2.2.1 Calculate parameters
The three major perpendicular dimensions of each
radish seed were measured by image processing
technique. The average diameter of each seed was
calculated using the geometric mean and arithmetic mean
of the three axial dimensions. The geometric mean
diameter, DG, arithmetic mean diameter, DA and
equivalent diameter, DE of the seed were calculated using
the following Equations (Garnayak et al. 2008; Milani et
al. 2007; Heidarbeigi et al. 2009):
√
* +
Where, L is the length, W the width and T is the
thickness, all in mm.
The sphericity ( ) of the grains, seeds, nuts, kernels or
fruits is an index of its roundness. Sphericity is defined as
the ratio of the surface area of a sphere having the same
volume as the seed to the surface area of the seed. The
sphericity of radish seed was calculated using the
following Equation (Sirisomboon et al. 2007):
(√ )
Where, L is the length, W the width and T is the
thickness, all in mm.
The surface area of seed (S) was found by analogy with
a sphere of the same geometric mean diameter, using the
following Equation (McGahon et al. 2007; Xu et al. 2009;
Ersoy 2010):
* +
Where, L is the length, W the width and T is the
thickness, all in mm and P is a constant. P approximation
has the least relative error (±1.061% in the worst case)
when P≈1.6075.
The volume of seed (V) was found by analogy with a
sphere of the same geometric mean diameter, using the
following Equation (Perez et al. 2007; Burubai et al.
2007):
The projected area (AP), one of the most important
parameters for determining aerodynamic properties, of
the seeds was determined using Equation 9 (Kabas et al.
2007):
( )
The flakiness ratio, Fr, and elongation ratio, Er for each
seed were calculated using the Equation 10 and 11
respectively (Mora and Kwan 2000):
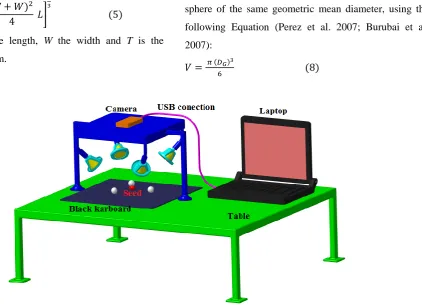
2.2.2 Image processing set up
The image processing system consisted of a camera
(Canon, IXY 600F, 12.1 megapixels, USB connection,
Japan), and four white-colored fluorescent lamps (32 W)
and a laptop computer (Dell, 1558, China) equipped with
Matlab R2012a software package (Figure 1). A white
paper was placed on the floor of the box to provide a
white background. Tow RGB color images were captured
from up and front views of seed. The contrast between
the seeds and the background was improved by several
functions of MATLAB. Pixels above a certain threshold
value, 52, were converted into white, pixels below this
threshold to black, resulting in a binary image (Koc 2007).
A group of black pixels adjacent to each other
represented a seed. The pixels must be converted to
millimeter, hence some circulars and squares with
identified dimensions were depicted on the paper and
then a relation between pixel and length in millimeter was
obtained.
2.2.3 Modeling of dimensions
Distributions of the length, width and thickness of
radish seeds were modeled with three probability density
functions. These functions were: Gamma, Weibull and
Generalized Extreme Value (G. E. V). The probability
density function and cumulative frequency for Gamma
distribution are described in Equation 12 and 13,
respectively (Bhunya et al. 2007):
where, x is variable; δ is location parameter; ζ is scale
parameter; ε is shape parameter; Γ is the Gamma function
and Γz is the incomplete Gamma function:
∫
∫
If δ equals to zero, the Gamma distribution would be a
two-parameter distribution; otherwise, that would be
named a three-parameter distribution. In the present work,
for modeling the data, three-parameter Gamma
distribution was used. The probability density function
and cumulative frequency for Weibull distribution are
described in Equations 16 and 17, respectively (Mirzabe
et al. 2012):
( ) ( ( ) )
( ( ) )
where, x is variable; α is location parameter; β is scale
parameter; γ is shape parameter. If α equals to zero, the
Weibull distribution would be a two-parameter
distribution; otherwise, that would be named a
three-parameter distribution. In the present work, for
modeling the data, three-parameter Weibull distribution
was used. The probability density function and
cumulative frequency for Generalized Extreme Value (G.
E. V) distribution are described in Equations 18 and 19
respectively (Mirzabe et al. 2012):
[ ( )]
, [
( )]
-
, [ ( )]
-
Where, x is variable; is scale parameter; is location
The adjustable parameters for each probability density
function were calculated using the commercial
spreadsheet package of Easy Fit 5.5.
Kolomogrov-Smirnov methods were used for comparison
of all probability densities. Kolmogorov-Smirnov
goodness of fit test was used to test how well different
prediction techniques work for prediction of diameter,
thickness and height distributions (Gorgoso et al. 2007).
The test is based on the vertical deviation between the
observed cumulative density function and estimated
cumulative density function based on the Equation 20. In
this equation, small values of the test statistics Ks index
indicate a better fit.
[ ]
where, S(x) is the cumulative frequency distribution
observed and F(x) is the probability of the theoretical
cumulative frequency distribution. Also the
Kolmogorov-Smirnov index for each probability density
function was calculated using the commercial spreadsheet
package of Easy Fit 5.5.
2.3 Gravimetric properties
To measure mass of each radish seed, 100 seeds were
randomly selected from the bulk sample; then the mass of
the seeds were measured by a digital balance (Kern,
Japan, accuracy of ±0.001 g) one by one. To evaluate the
1000-unit mass, 100 seeds were randomly selected from
the bulk sample; the 100-unit mass was measured by the
same digital balance. 1000-unit mass was calculated by
multiplying the 100-unit mass by 10.
Four containers with known volumes, 150, 350, 550
and 750 cm3, were used to measure the bulk density of
radish seeds and investigate the effects of volume of the
container. The seeds were poured into the containers at
the height of 50, 100, 150, 200 and 250 mm (Gupta and
Das 1997; Mirzabe et al. 2013a). The bulk density (ρb) is
equal to the mass of bulk material divided by volume
containing the mass. To study the effects of the moisture
content on bulk density, bulk of seeds was obtained using
a container with 550 cm3 volume and seeds were poured
into the containers at the height of 150 mm.
The true density (ρt) is defined as the mass of sample
(Ms) divided by the volume of the sample (Vs). It was
determined using the water displacement method.
Toluene (C7H8) was used instead of water because it is
absorbed by seeds to a lesser extent, density of toluene is
less than the water and its surface tension is low, so it
even fills shallow dips in a seed and its dissolution power
is low (Milani et al. 2007; Garnayak et al. 2008). The
volume of each sample was determined by weighing
displacement volume of toluene:
where, MTD is the mass of displacement volume of
toluene in kg, is the density of toluene (870 kg m-3),
MT is the mass of filled pycnometer with toluene in kg,
MP is the mass of pycnometer kg, MPTS is the mass of
pycnometer with toluene and the seeds in kg, and MPS is
the mass of pycnometer and seeds in kg.
Porosity defined as the ratio of the volume of pores to
the total volume. Porosity or void fraction is a measure of
the void spaces or empty spaces in a material, expressed
in number between 0 to1, or in a percentage. The porosity
of bulk seeds was calculated from bulk and true densities
using the Equation 23 (Sharma et al. 2011):
( )
2.4 Frictional properties
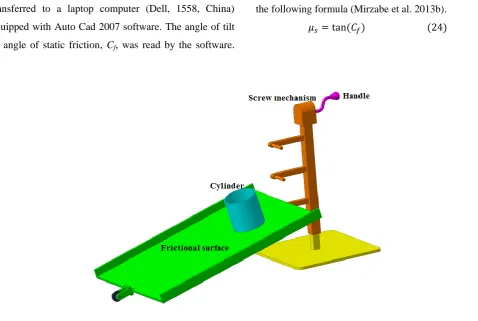
2.4.1 Coefficients of static friction
The effects of the moisture content on coefficients of
external static friction of the radish seeds were examined
using sloped plane method on surfaces of galvanized, iron,
plywood and rubber. A topless and bottomless cylinder of
100 mm diameter and 50 mm height was filled with the
sample of seeds. The cylinder was raised slightly so as
not to touch the surfaces (Figure 2). The structural surface
with the cylinder resting on it was inclined gradually with
a screw device until the cylinder just started to slide down
over the surface. The angle of tilt at this juncture was
megapixels, USB connection, Japan) and photos were
transferred to a laptop computer (Dell, 1558, China)
equipped with Auto Cad 2007 software. The angle of tilt
or angle of static friction, Cf, was read by the software.
The coefficient of static friction, , was calculated from
the following formula (Mirzabe et al. 2013b).
2.4.2 Angle of repose
When bulk granular materials are poured onto a
horizontal surface, a conical pile will form. The internal
angle between the surface of the pile and the horizontal
surface is known as the angle of repose. Materials with a
low angle of repose form flatter piles than materials with
a high angle of repose. Angle of repose of the agricultural
materials is dependent on the density, surface area and
shape of the particles (seeds, grains, nuts, kernels, fruits,
etc.), the coefficient of friction of the material and
gravity-dependence (Kleinhans et al. 2011). There are
different methods of measuring the angle of repose,
including pouring, filling (charging), empting
(discharging), Hele-Shaw, submerging, and rotating
drums. In the present study, to study the effects of the
moisture content on angle of repose of the radish seeds,
pouring, filling, empting and Hele-Shaw methods were
used.
2.4.2.1 Pouring angle of repose
Static angle of repose was measured using pouring
method. The angle of repose of seeds sample was
determined using a topless and bottomless metallic
cylinder of 200 mm height and 150 mm diameter
(Mirzabe et al. 2013b). The cylinder was placed on
horizontal surface and was filled with seeds (seeds were
poured into the cylinder at the height of 150 mm), then,
the cylinder was raised very slowly (rotational velocity of
electromotor was equal 1400 rpm and linear velocity of
chord was equal to 5 mm/sec, Figure 3). The camera
(Canon, IXY 600F, 12.1 megapixels, USB connection,
Japan) was placed at the opposite of the front view of the
bulk seeds. The bulk seeds were photographed. The
pouring angle of repose was calculated using image
processing technique by Auto Cad 2007 software package.
In order to study the effects of the material of the contact
surface, galvanized, iron, plywood and rubber plates were
placed on the frame of the set up (beneath of the cylinder)
and pouring angle of repose was measured on these
surfaces.
Although measuring pouring of the agricultural seeds
has a standard method (height of fall equal to 150 mm), in
practice, when filling large reservoirs and silos, we do not
normally use standard parameters, so the effect of height
fall is of importance parameters on pouring angle of
repose. Therefore the effects of the height of fall (50, 100,
150, 200 and 250 mm) on pouring angle of repose, when
the moisture content was equal to 5.65 % (d.b), were
investigated.
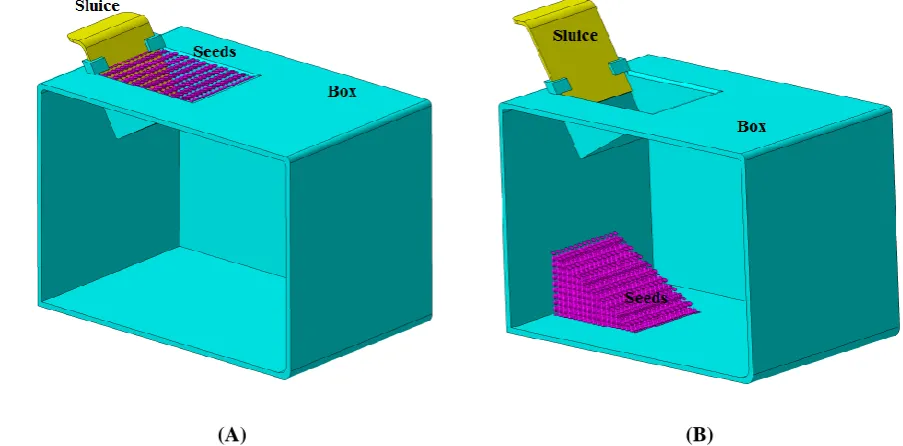
2.4.2.2 Filling and empting angle of repose
The filling and empting angle of repose of the seeds
were measured. The device used in this study was a box
made from two smaller, upper and lower boxes. The
dimensions of the box were 120 mm length, 120 mm
height, and 60 mm width (Figure 4). The upper box was
filled with the sample seeds. The material of upper box
could flow down through a removable port. The filling or
static angle of repose is the angle of surface with the
horizon at which the seeds will stand when piled on the
ground. The empting or dynamic angle of repose is the
angle of surface of residual with horizon in the upper box.
The filling and empting angle of repose were calculated
using the same technique mentioned for pouring angle of
repose.
Figure 4 Experimental set up used to measure filling and
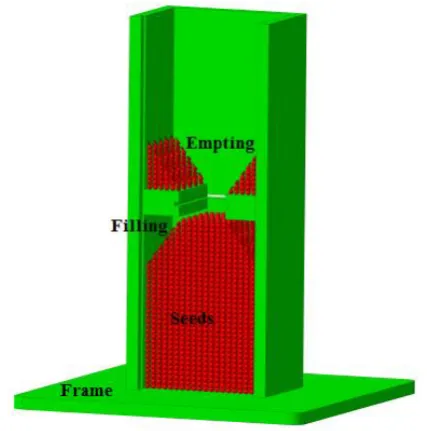
2.4.2.2 Hele-Shaw angle of repose
The Hele-Shaw angle of repose of the radish seeds was
measured. The device used in this study was a box of
dimensions of 300 mm length, 200 mm height, and 200
mm width (Figure 5). There was a small box above the
main box. Bottom surface of the small box was sloped.
The small box was filled with the sample seeds. The
material of upper box can flow down through a
removable port. The Hele-Shaw is the angle of surface
with the horizon at which the seeds will stand when piled
on the bottom of the main box. The camera was placed at
the opposite of the front view of the box, then the bulk
seeds were photographed (the front side of the main box
was made of glass). The Hele-Shaw angle of repose was
calculated using image processing technique by Auto Cad
2007 software package. In order to study the effects of
the material of the contact surface, galvanized, iron,
plywood and rubber plates were placed at the bottom of
the main box and the Hele-Shaw angle of repose was
measured on these surfaces.
2.6 Data analysis
Based on the measurements and calculations made
above, for calculating statistical indices including
maximum, minimum, average, standard deviation,
skewness, and kurtosis for measured and calculated
dimensions and dimensional properties, Microsoft Office
Excel 2010 was used. Also in order to calculating the
average of the repetitions of all gravimetrical properties
and frictional properties, Microsoft Office Excel 2010 was
used. Numbers of repetitions of the tests are shown in
Table 1.
(A) (B)
Figure 5 Experimental set up used to measure Hele-Shaw angle of repose of radish seeds. (A) is the
3 Results and discussion
3.1 Dimensional properties
Length, width, thickness and dimensional properties of
the radish seeds are shown in Table 2. The length, width,
and thickness of the seeds ranged from 0.660 mm to
0.990 mm, 0.524 mm to 0.763 mm and 0.490 mm to
0.759 mm, respectively. Average of the geometric mean
diameter, arithmetic mean diameter, equivalent diameter,
sphericity, surface area, volume, projected area, flakiness
ratio and elongation ratio of the seeds were found to be
0.656 mm, 0.660 mm, 0.613 mm, 87.987%, 1.372 mm2,
0.150 mm3, 0.377 mm2, 0.932 and 1.169, respectively
(Table 2).
Skewness and kurtosis are two statistical indices
calculated so that the reader would better understand the
probability density distribution data. The first thing
usually noticed about a distribution’s shape is whether it
has one mode (peak) or more than one. If it is unimodal
(has just one peak), like most data sets, the next thing
noticed is whether it issymmetric or skewed to one side.
Kurtosis is a measure of whether the data are peaked or
flat relative to a normal distribution, that is data sets with
high kurtosis tend to have a distinct peak near the mean, Table 1 Number of repetitions of the all tests including dimensions, dimensional, gravimetrical and
frictional properties of red radish seeds
Property Measured or calculated parameter Number of repetitions
Dimensions
Length 100
Width 100
Thickness 100
Dimensional properties Diameters, Sphericity, Surface area, Volume, Projected area,
Flakiness ratio, Elongation ratio 100
Gravimetrical properties
Mass of single seed 100
1000-unit mass 5
Bulk density 5
True density 3
porosity 5
Frictional properties
Coefficient of friction 5
Pouring angle of repose 5
Hele-Shaw angle of repose 5
Filling and empting angle of repose 5
Table 2 Calculated statistical indices of three principle dimensions and dimensional parameters of red
radish seeds when moisture content equals to 5.65 % (d.b)
Parameter Units Max Min Mean Standard
Deviation Skewness Kurtosis
Length mm 0.900 0.660 0.746 0.049 0.871 0.772
Width mm 0.763 0.524 0.641 0.057 0.237 -0.840
Thickness mm 0.759 0.490 0.594 0.057 0.579 0.120
Dg mm 0.770 0.572 0.656 0.044 0.423 -0.251
DA mm 0.775 0.575 0.660 0.044 0.432 -0.223
DE mm 0.684 0.560 0.613 0.027 0.461 -0.073
Sphericity % 93.650 83.448 87.987 2.534 0.309 -0.694
Surface area mm2 1.879 1.038 1.372 0.185 0.581 -0.040
Volume mm3 0.239 0.098 0.150 0.031 0.732 0.193
Projected area mm2 0.520 0.271 0.377 0.055 0.686 -0.056
Flakiness ratio - 1.199 0.748 0.932 0.108 0.641 0.110
decline rather rapidly, and have heavy tails. Data sets
with low kurtosis tend to have a flat top near the mean
rather than a sharp peak. A uniform distribution would be
the extreme case. Results of statistical analysis of
dimensional properties of the radish seeds indicated that
values of the skewness in all cases were positive and
values of the kurtosis in most cases were negative.
3.2 Gravimetrical properties
3.2.1 Mass and 1000-unit mass
Statistical indices including maximum, minimum,
average, standard deviation, skewness, and kurtosis for
single mass of seed in 5.65 % (d.b) moisture content
were found to be 0.015 g, 0.002 g, 0.0069 g, 0.003, 0.679
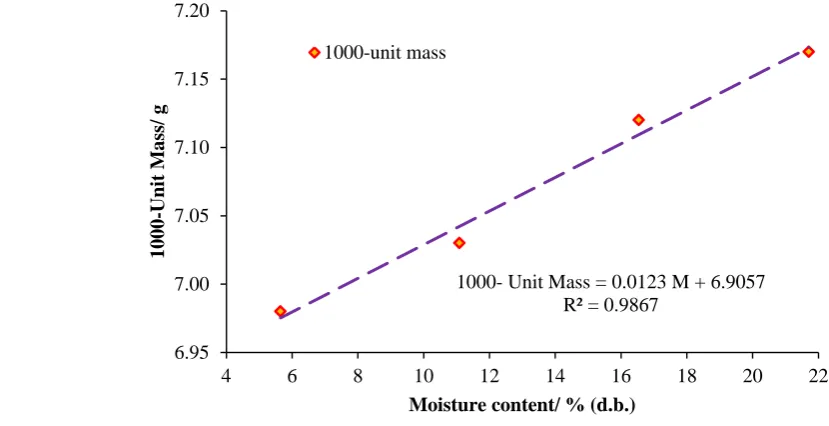
and 0.056, respectively. The 1000-unit mass of the radish
seeds was measured at different moisture levels. The
Figure 6 indicates that the 1000-unit mass increases linear
with increase in seed moisture content. It varies from 6.98
to 7.17 g when the moisture content increased from 5.65
to 21.71 % (d.b). There are many published literatures on
moisture dependency of 1000-unit mass; results indicated
that in most cases, with increasing moisture content,
1000-unit mass increased (Sacilik et al. 2003; Özarslan
2002).
Cetin et al. (2010) reported that when the moisture
content increased from 6.95 to 19.08 % (d.b), the
1000-unit mass of the radish seeds decreased from 11.9 to
13.85 g. A comparison between obtained results from the
present study and reported results by Cetin et al. (2010)
shows in all moisture levels values of the 1000-unit mass
of the radish seeds are less than the value of the 1000-unit
mass reported by Cetin et al. (2010).
3.2.2 Effect of volume of the container and height of fall
on bulk density and porosity
Results of the effects of volume of the container and
height of fall on bulk density of the seeds are illustrated
in Figures 7. Results showed that with increasing volume
of container from 150 mL to 550 mL, bulk density of the
seeds increased. But with increasing volume of container
from 550 mL to 750 mL, bulk density of the seeds
decreased. In all cases, with increasing height of fall of
the seeds to the container from 50 mm to 250 mm, value
of bulk density of the seeds increased. Figure 6 Variation of 1000-unit mass of red radish seeds with moisture content
1000- Unit Mass = 0.0123 M + 6.9057 R² = 0.9867
6.95 7.00 7.05 7.10 7.15 7.20
4 6 8 10 12 14 16 18 20 22
1000
-Uni
t M
ass/
g
Using the value of true density, values of bulk density
in different heights of fall, and volume of the container,
and Equation 23, values of porosity of the radish seeds
were calculated when moisture content was equal to 5.65%
(d.b) . Results of porosity of the seeds are illustrated in
Figure 8. Results showed that with increasing volume of
container from 150 mL to 550 mL, bulk density of the
seeds decreased. But with increasing volume of container
from 550 mL to 750 mL, bulk density of the seeds
increased. In all cases, with increasing height of fall of
the seeds to the container from 50 mm to 250 mm, value
of the porosity of the seeds decreased.
When the moisture content equals to 5.65% (d.b) , the
results of bulk density in different levels of volume of
container and different heights of fall of seeds to the
container indicated that value of bulk density of radish
seeds ranged from 637.460 kg/m3 (when volume of the
container was equal to 150 mL and height of fall was
equal to 50 mm) to 735.987 kg/m3 (when volume of the
container was equal to 550 mL and height of fall was Figure 7 Effects of volume of the container and height of fall on bulk density of red radish seeds when the
moisture content equals 5.65% (d.b)
620 640 660 680 700 720 740 760
100 200 300 400 500 600 700 800
Bulk
density/
k
g
m
-3
Volume of the container/ mL
50 mm 100 mm 150 mm 200 mm 250 mm
Figure 8 Effects of volume of the container and height of fall on porosity of red radish seeds when the moisture
content equals to 5.65 % (d.b)
35 37 39 41 43 45
100 200 300 400 500 600 700 800
Porosity/
%
Volume of the container/ mL
equal to 250 mm). The corresponding values for porosity
were equal to 35.542% (when volume of the container
was equal to 550 mL and height of fall was equal to 250
mm) to 44.171% (when volume of the container was equal
to 150 mL and height of fall was equal to 50 mm),
respectively.
Results of quadratic regression analysis of bulk density
and porosity of radish seeds related to the volume of the
container and height of fall are shown in Table 3. Results
showed that in all cases, r-square value was more than
0.90; it means that the quadratic regression has a good
performance in modeling the relationship between bulk
density and volume of the container and also relationship
between porosity and volume of the container.
3.2.1 Effects of moisture content on bulk and true density
and porosity
The bulk density of radish seeds decreased linearly
with moisture content from 694.807 to 654.889 kg/m3 in
the moisture ranges of 5.65% to 21.71% dry basis (Figure
9). The bulk density of seeds was significantly affected
by moisture content at 5% level of significance; a
relationship exists between bulk density and moisture
content. The negative relationship of bulk density with
moisture content is also observed by other researchers
(Garnayak et al. 2008; Pradhan et al. 2009;
Sánchez-Mendoza et al. 2008; Zewdu and Solomon 2007) Table 3 Constant coefficients of quadratic regression of bulk density and porosity of radish seeds
related to volume of the container, in different levels of height of fall of seeds to the containers (moisture content equal to 5.65 % (d.b) )
Parameter Height of fall
R2(r-square)
Bulk density (Kg m-3)
50 mm -0.0003 0.2649 602.3600 0.9202
100 mm -0.0003 0.2586 626.2300 0.9819
150 mm -0.0002 0.2042 644.7500 0.9938
200 mm -0.0002 0.9440 667.8700 0.9440
250 mm -0.0002 0.1907 685.3700 0.9137
Porosity (%)
50 mm 0.00002 -0.0232 47.2450 0.9202
100 mm 0.00002 -0.0226 45.1540 0.9820
150 mm 0.00002 -0.0179 43.5320 0.9938
200 mm 0.00002 -0.0173 41.5080 0.9440
250 mm 0.00002 -0.0167 39.9670 0.9138
Where: y is bulk density or porosity and x is volume of the container
Figure 9 Variation of bulk density of red radish seeds with moisture content Bulk Density = -2.5415 M + 710.62
R² = 0.9912
650 655 660 665 670 675 680 685 690 695 700
4 6 8 10 12 14 16 18 20 22
Bu
lk
De
n
si
ty/ k
g
m
-3
Cetin et al. (2010) reported that when the moisture
content increased from 6.95% to 19.08% (d.b), the bulk
density of the radish seeds decreased from 698.6 to 652.3
kg/m3. A comparison between obtained results from the
present study and reported results by Cetin et al. (2010)
shows in all moisture levels values of the bulk density of
the radish seeds are less than the value of the bulk density
reported by Cetin et al. (2010).
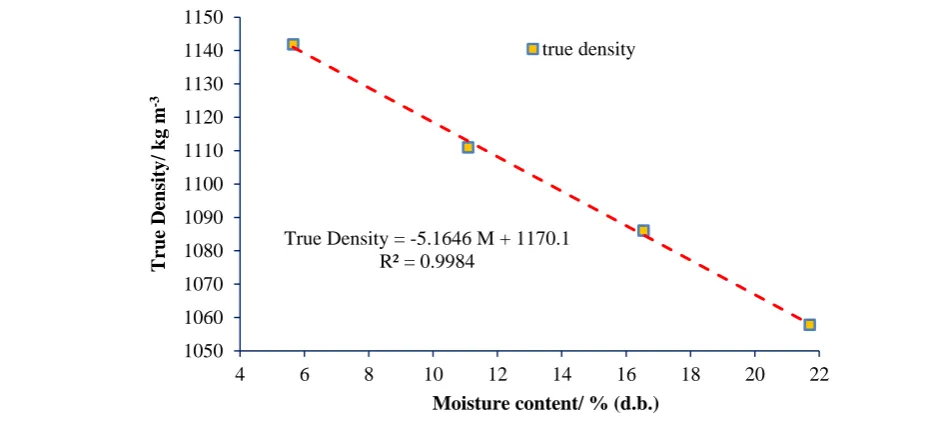
The true density of radish seeds decreased linearly
with moisture content from 1141.810 to 1057.79 6 kg/m3
in the moisture ranges of 5.65% to 21.71% dry basis
(Figure 10). The reported results of the relationship
between the true density and moisture content were often
contradictory; the results sometimes indicated an increase
of the true density with increase in moisture content
(Bart-Plange and Baryeh 2003; Aydin 2003; Garnayak et
al. 2008; Milani et al. 2007; Mirzabe et al. 2013b), but in
some cases with increasing moisture content, the true
density decreased (Deshpande et al. 1993; Sologubik et al.
2013; Zewdu and Solomon 2007; Pradhan et al. 2009).
Cetin et al. (2010) reported that when the moisture
content increased from 6.95% to 19.08% (d.b), the true
density of the radish seeds decreased from 1000.41 to
974.66 kg/m3. A comparison between obtained results
from the present study and reported results by Cetin et al.
(2010) shows in all moisture levels values of the true
density of the seeds are more than the value of the true
density reported by Cetin et al. (2010).
The porosity was calculated using the average values
of bulk density and true density of each batch by
Equation 23. It was observed that when the moisture
content increased from 5.65% to 11.09% (d.b), the
porosity decreased from 39.149% to 38.358%. Also it
was observed that when moisture content increased from
11.09%to 16.54% (d.b), porosity increased from 38.358%
to 38.470%, while when moisture content increased from
16.54% to 21.71% (d.b), porosity decreased from 38.470%
to 38.089% as shown in Figure 11. For a given mass of
seeds, an increase in the moisture contentleads to higher
bulk volume and the addition of water to the seeds
structure affects principle dimensions of seed differently,
altering mainly the thickness and width, it influences are
more on the bulk density than on the true density of seeds,
resulting in a rise in porosity (Sologubik et al. 2013).
Pradhan et al. (2009) for jatropha fruit and Mwithiga and
Sifuna (2006) for sorghum seeds reported a decreasing
trend of porosity with increasing moisture content. Figure 10 Variation of true density of red radish seeds with moisture content
True Density = -5.1646 M + 1170.1 R² = 0.9984
1050 1060 1070 1080 1090 1100 1110 1120 1130 1140 1150
4 6 8 10 12 14 16 18 20 22
True D
en
si
ty/ k
g m
-3
Cetin et al. (2010) reported that when the moisture
content increased from 6.95% to 19.08% (d.b), the
porosity of the radish seeds increased from 30.17% to
33.07%; while results of present study showed that
porosity of the seeds decreased from 38.470% to
38.089%, when the moisture content increased from 5.65%
to 21.71% (d.b). A comparison between obtained results
from the present study and reported results by Cetin et al.
(2010) shows in all moisture levels, values of the porosity
of the radish seeds are more than the values of the
porosity reported by Cetin et al. (2010).
3.3 Frictional properties
3.3.1 Angle of friction
The static angle of friction of radish seeds on
galvanized, iron, plywood and rubber surfaces when
moisture content increased from 5.65% to 21.71% (d.b)
was measured. It is observed that the static coefficient of
friction of the radish seeds increased linearly with
increase in moisture content for all contact surfaces as
shown in Figure 12. When moisture content equals to
5.65% and 11.09% (d.b) the maximum and minimum
friction is offered by rubber and galvanized surfaces,
respectively, while when moisture content equals to 16.54%
and 21.7% (d.b) the maximum and minimum friction is
offered by plywood and galvanized surfaces, respectively.
The least static coefficient of friction may be owing to the
smoother and more polished surface of the galvanized
sheet than the other materials used. Wood also offered the
maximum friction for tef seed (Zewdu and Solomon
2007), jatrofa fruit (Pradhan et al. 2009) and for almond
(Mirzabe et al. 2013b), but the galvanized iron had higher
coefficient of friction than plywood for Roselle seeds
(Sánchez-Mendoza et al. 2008) and lentil seeds (Amin et
al. 2004).
Figure 11 Variation of porosity of red radish seeds with moisture content 38.00
38.30 38.60 38.90 39.20 39.50
4 6 8 10 12 14 16 18 20 22
P
or
osity/
%
Cetin et al. (2010) reported that when the moisture
content increased from 6.95% to 19.08 % (d.b), the static
coefficient of friction of radish seed increased linearly
against surfaces of four structural materials, namely,
rubber (0.354–0.410), aluminum (0.295–0.346), stainless
steel (0.245–0.306) and galvanized iron (0.308–0.368). A
comparison between obtained results from the present
study and reported results by Cetin et al. (2010) shows in
all moisture levels, values of the static coefficient of the
seeds on rubber and galvanized iron surface are more and
less than the results of the Cetin et al. (2010),
respectively.
3.3.2 Angle of repose
The angle of repose is sometimes used in the design of
equipment for the processing of particulate solids. For
example, it may be used to design an appropriate hopper
or silo to store the material, or to size a conveyor belt for
transporting the material. It can also be used in
determining whether or not a slope will likely collapse;
the talus slope is derived from angle of repose and
represents the steepest slope a pile of granular material
will take. Also the angle of repose is an indicator of the
product’s flow ability. The effect of moisture content on
pouring angle of repose (PAR) on galvanized, iron,
plywood and rubber surface are shown in Figure 13. It is
observed that the pouring angle of repose of the radish
seeds increased linearly with increase in moisture content
for all contact surfaces. The maximum and minimum
pouring angle of repose (PAR) is offered by rubber and
galvanized surfaces, respectively. Figure 12 Variation of static angle of friction of red radish seeds with moisture content
AFPlywood = 0.3765 M + 17.498
R² = 0.9887
AFRubber = 0.2485 M + 19.406
R² = 0.9922
AFIron = 0.1583 M + 16.567
R² = 0.9745
AFGalvanized = 0.1558 M + 11.741
R² = 0.9886
12 14 16 18 20 22 24 26
4 6 8 10 12 14 16 18 20 22
Angl
e of
f
rict
ion
/ De
gr
ee
Moiture content/ % (d.b.)
The effect of height of fall on pouring angle of repose
on galvanized, iron, plywood and rubber surface are
shown in Figure 14. It is observed that, for all contact
surfaces, the pouring angle of repose of the radish seeds
increased linearly with increase in height of fall from 50
to 150 mm. Also, on the rubber and plywood surfaces
with increasing height of fall from 150 mm to 250 mm,
pouring angle of repose of the radish seeds increased. But,
on the iron and galvanized surfaces with increasing height
of fall from 150 mm to 250 mm, pouring angle of repose
of the radish seeds decreased.
The effect of moisture content on filling and empting
angle of repose are shown in Figure 15. It is observed that
the filling and empting angle of repose of the radish seeds
increased linearly with increase in moisture content; also,
in all moisture content levels, empting angle of repose
was more than the filling angle of repose. Different Figure 13 Variation of pouring angle of repose of red radish seeds with moisture content
PARPlywood = 0.7669 M + 24.064
R² = 0.9824
PARRubber = 0.7413 M + 25.179
R² = 0.9762
PARIron = 0.5181 M + 23.094
R² = 0.9795 PARGalvanized = 0.518 M + 22.433
R² = 0.9718 25
28 31 34 37 40 43
4 6 8 10 12 14 16 18 20 22
P
ou
rin
g
Angl
e of
Re
p
ose/ D
egr
ee
Moisture content/ % (d.b.)
Plywood Rubber Iron Galvanized
Figure 14 Variation of pouring angle of repose of red radish seeds with height of fall when the moisture
content equals to 5.65% (d.b) 23
24 25 26 27 28 29 30 31
30 70 110 150 190 230 270
P
ou
rin
g
an
gle
of
r
ep
ose/ D
egr
ee
behaviors for empting and filling angle of repose have
been reported for other agricultural materials, the angle of
repose was obtained from empting method was greater
than that of filling method for wild pistachio (Fadavi et al.
2013), but the reverse results were shown for jatropha
(Sirisomboon et al. 2007).
The effect of moisture content on Hele-Shaw angle of
repose (HAR) is shown in Figure 16. It is observed that
the Hele-Shaw angle of repose (HAR) of the radish seeds
increased linearly with increase in moisture content in all
surfaces. The maximum and minimum Hele-Shaw angle
of repose is offered by rubber and galvanized surfaces,
respectively. The least angle of repose may be owing to
the smoother and more polished surface of the galvanized
sheet than the other materials used.
Figure 15 Variation of filling and empting angle of repose of red radish seeds with moisture content Filling Angle of Repose = 0.3697 M + 22.918
R² = 0.9845 Empting Angle of Repose = 0.2867 M + 25.285
R² = 0.9861
25 26 27 28 29 30 31 32
4 6 8 10 12 14 16 18 20 22
Angl
e of
r
ep
ose/
De
gr
ee
Moiture content/ % (d.b.)
Filling Empting
Figure 16 Variation of Hele-shaw angle of repose of red radish seeds with moisture content HARPlywood = 0.6051 M + 20.849
R² = 0.9841
HARRubber = 0.5974 M + 22.074
R² = 0.9922
HARIron = 0.4535 M + 20.797
R² = 0.9891 HARGalvanized = 0.385 M + 18.59
R² = 0.9841 20
24 28 32 36
4 6 8 10 12 14 16 18 20 22
Hele
-sh
aw
Angl
e of
Re
p
ose/ D
egr
ee
Moisture content/ % (d.b.)
A comparison between different methods used to
measure angle of repose of radish seeds showed that
when the Hele-Shaw methods was used to measure angle
of repose, minimum values were found, while pouring
method had maximum values.
3.4 Modeling of dimensions and mass
Distributions of the length, width, thickness and single
mass of the radish seeds were modeled using the
tree-parameter Gamma, Generalized Extreme Value (G. E.
V) and three-parameter Weibull probability density
functions (PDF) distribution; the results of modeling are
shown in Table 3. Results showed that to model length,
thickness and mass of the seeds, G. E. V distribution had
the best performance, while Weibull distribution had the
worst performance. Also to model the width of the seeds,
G. E. V distribution had the best performance, while
Gamma distribution had the worst performance (Table 4).
Results of modeling showed that whenever skewness
and kurtosis had positive values, Generalized Extreme
Value distribution had good performance, while Weibull
distribution had poor performance for modeling the data.
Also whenever skewness had positive value and kurtosis
a negative value, G.E.V distribution showed good
performance, while Gamma distribution had poor
performance for modeling the data.
Khazaei et al. (2008) modeled mass and size
distributions of two varieties of sunflower seeds and
kernels using the Log-normal, normal and Weibull
distributions. They cited that when skewness had a
positive value, Log-normal distribution was the best and
normal distribution was the worst model for data
prediction. Mirzabe et al. (2012) modeled distance
between adjacent sunflower seeds on sunflower head of
three varieties using the Log-normal, normal and Weibull
distributions. They cited that whenever skewness and
kurtosis had negative value, Weibull distribution was the
best fit.
For an easy comparison between dimensions of radish
seeds together, probability density functions (PDF) are
shown in Figure 16. For all modeling in Figure 16,
Generalized Extreme Value was used, because it had the
best prediction of probability density functions (PDF) of
length, width and thickness of seeds. For length and
thickness of seeds, skewness and kurtosis had positive
value and for width, skewness had positive value and
kurtosis had negative value; which is shown in Figure 16.
This figure shows that there is little overlap between the
PDF of length and width, and even less overlap between
the PDF of length and thickness. There is no overlap
between length and thickness. It means that the greatest
measured thickness of seeds is more than the lowest Table 4 Calculated parameter values of the Gamma, Generalized Extreme Value (G. E. V) and Weibull
probability density function for length, width, thickness and mass of radish seeds
Parameter Distribution name
Shape parameter
Scale parameter
Location parameter
Kolmogorov-Smirnov
index Rank
Length
Gamma 4.778 0.022 0.639 0.0381 2
G. E. V -0.018 0.040 0.724 0.0340 1
Weibull 1.931 0.102 0.656 0.0534 3
Width
Gamma 16.305 0.014 0.411 0.0804 3
G. E. V -0.155 0.053 0.617 0.0741 1
Weibull 2.538 0.150 0.508 0.0768 2
Thickness
Gamma 6.080 0.023 0.451 0.0876 2
G. E. V -0.099 0.050 0.569 0.0864 1
Weibull 2.052 0.125 0.482 0.0943 3
Mass
Gamma 5.351 0.001 0.000 0.1055 2
G. E. V -0.029 0.002 0.006 0.1021 1
measured length. Also there is great overlap between the
PDF of width and thickness; it means that the difference
between measured thickness of the seeds and measured
width of seeds is very low; also in several cases value of
thickness of seeds is more than the value of width of the
seeds.
4 Conclusions
Dimensional properties of radish seeds were measured
using image processing technique and length, width,
thickness and mass distributions of radish seeds were
modeled using Gamma, Generalized Extreme Value and
Weibull distributions. Also effects of the moisture content
on mass of single seed, 1000-unit seed, bulk density, true
density, porosity, static angle of friction and angle of
repose were studied. Effects of volume of the container
and height of fall on bulk density and porosity when the
moisture content equaled to 5.65% (d.b) were studied.
Also pouring angle of repose and Hele-Shaw angle of
repose on galvanized, iron, plywood and rubber surfaces
were measured.
Results showed that with increasing volume of the
container from 150 mL to 550 mL, bulk density of the
seeds increased; but with increasing volume of the
container from 550 mL to 750 mL, bulk density of the
seeds decreased. In all cases with increasing height of fall
of the seeds to the container from 50 mm to 250 mm,
value of the porosity of the seeds decreased. The results
of bulk density in different levels of volume of container
and different heights of fall of seeds to the container
indicated that value of bulk density of radish seeds ranged
from 637.460 kg/m3 (when volume of the container was
equal to 150 mL and height of fall was equal to 50 mm)
to 735.987 kg m-3 (when volume of the container was
equal to 550 mL and height of fall was equal to 250 mm).
Results of the effect of the moisture content on
gravimetrical properties showed that the bulk density of
radish seeds decreased linearly with moisture content
from 694.807 to 654.889 kg/m3 and the true density of
radish seeds decreased linearly with moisture content
from 1141.810 to 1057.796 kg/m3 in the moisture ranges
of 5.65% to 21.71% (d.b); while, 1000-unit mass
increases linear with increase in seed moisture content.
Results of the effect of the moisture content on
frictional properties showed that with increasing moisture
content, angle of friction (on all surfaces) and angle of
repose based on different methods and different surfaces
decreased. A comparison between different methods used
to measure angle of repose of radish seeds shows when
the Hele-Shaw methods was used to measure angle of
repose, minimum values were found, while pouring
for seeds to move (in planter machines, for instance), the
designation of the machines and silos has to be based on
the pouring angle of repose. But when seeds do not need
to move (transfer conveyors, for instance), Hele-Shaw
angle of repose needs to be considered.
Although the seed dimensions and seeds mass
measured by Cetin et al. (2010) were greater than those
obtained in the present study, the bulk density of both
samples was in the same range. More interesting, the true
density of our sample was more than theirs. So, this claim
can be made that in general, the differences between
Cetin et al. (2010) and our results can be due to the
difference in the variety of the plant and also in the
conditions in which the plants are cultivated. In cases
where the values do not show considerable differences,
these results can be of a great help to those agricultural
equipment producers who need to use these results in
designing their machines. Take, for example, a person
who aims to design a planter machine for radish seeds.
Similar results obtained in different studies can ensure the
designer that his machine can be used for different
varieties grown in different places.
Acknowledgement
The authors would like to thank the University of
Tehran for providing technical support for this work. The
authors would also like to thank Mr. Mohammad Hassan
Torabi for his support in editing the language of the
paper.
References
Alqasoumi, S., M. Al-Yahya, T. Al-Howiriny, and S. Rafatullah. 2008. Gastroprotective effect of radish ―Raphanus sativus‖ L. on experimental gastric ulcer models in rats. Farmacia Lvi (2): 204-214.
Altuntaş, E., E. Özgöz, and Ö. F. Taşer. 2005. Some physical properties of fenugreek (Trigonella foenum-graceum L.) seeds. Journal of Food Engineering 71 (1):37-43. Amin, M., M. Hossain, and K. Roy. 2004. Effects of moisture
content on some physical properties of lentil seeds. Journal of Food Engineering 65 (1):83-87.
Anuradha, S., and S. Rao. 2007. The effect of brassinosteroids on radish (Raphanus sativus L.) seedlings growing under cadmium stress. Plant Soil and Environment 53 (11):465.
Aviara, N. A., P. P. Power, and T. Abbas. 2013. Moisture-dependent physical properties of moringa oleifera seed relevant in bulk handling and mechanical processing. Industrial Crops and Products 42(1):96-104. Aydin, C. 2003. Physical properties of almond nut and kernel.
Journal of Food Engineering 60 (3):315-320.
Bart-Plange, A., and E. A. Baryeh. 2003. The physical properties of Category B cocoa beans. Journal of Food Engineering 60 (3):219-227.
Bhunya, P., R. Berndtsson, C. Ojha, and S. Mishra. 2007. Suitability of Gamma, Chi-square, Weibull, and Beta distributions as synthetic unit hydrographs. Journal of Hydrology 334 (1):28-38.
Burubai, W., A. Akor, A. Igoni, and Y. Puyate. 2007. Some physical properties of African nutmeg (Monodora myristica). International Agrophysics 21 (2):123. Cetin, M., E. Şimşek, T. Akbaş, and C. Özarslan. 2010. Physical
Properties of Radish (Raphanus sativus L.) Seed as a Function of Moisture Content. The Philippine Agricultural Scientist 93 (3): 1.
Deshpande, S., S. Bal, and T. Ojha. 1993. Physical properties of soybean. Journal of Agricultural Engineering Research 56 (2):89-98.
Ersoy, O. 2010. Surface area and volume measurements of volcanic ash particles by SEM stereoscopic imaging. Journal of Volcanology and Geothermal Research 190 (3):290-296.
Fadavi, A., S. R. Hassan-Beygi, and F. Karimi. 2013. Moisture dependent physical and mechanical properties of Syrjan region wild pistachio nut. Agricultural Engineering International: CIGR Journal 15 (2):221-230.
Garnayak, D., R. Pradhan, S. Naik, and N. Bhatnagar. 2008. Moisture-dependent physical properties of jatropha seed (Jatropha curcas L.). Industrial Crops and Products 27 (1):123-129.
Gorgoso, J., J. Á. González, A. Rojo, and J. Grandas-Arias. 2007. Modelling diameter distributions of Betula alba L. stands in northwest Spain with the two-parameter Weibull function. Forest Systems 16 (2):113-123.
Gupta, R., and S. Das. 1997. Physical properties of sunflower seeds. Journal of Agricultural Engineering Research 66 (1):1-8. He, L.-L., L.-W. Liu, Y.-Q. Gong, X.-L. Hou, X.-W. Zhu, J.-L.
Yang, and B. Wu. 2008. Physiological responses of radish (Raphanus Sativus L.) to lead stress. Paper read at Bioinformatics and Biomedical Engineering, 2008. ICBBE 2008. The 2nd International Conference on. Heidarbeigi, K., H. Ahmadi, K. Khaeiralipour, and A.
Tabatabaeefar. 2009. Some physical and mechanical properties of khinjuk. Pakistan Journal of Nutrition 8 (1):74-77.
Hwang, C. W. 2009. Antifungal and Plant Growth Promotion Activities of Recombinant Defensin Proteins from the Seed of Korean Radish (Raphanus sativus L.).
Inoue, H., D. Fukuoka, Y. Tatai, H. Kamachi, M. Hayatsu, M. Ono, and S. Suzuki. 2013. Properties of lead deposits in cell walls of radish (Raphanus sativus) roots. Journal of plant research 126 (1):51-61.
Kabas, O., E. Yilmaz, A. Ozmerzi, and İ. Akinci. 2007. Some physical and nutritional properties of cowpea seed (Vigna sinensis L.). Journal of Food Engineering 79 (4):1405-1409.
Khan, D., and B. Frankland. 1983. Effects of cadmium and lead on radish plants with particular reference to movement of metals through soil profile and plant. Plant and soil 70 (3):335-345.
Khazaei, J., S. Jafari, and S. Noorolah. 2008. Lognormal vs. Normal and Weibull distributions for modeling the mass and size distributions of sunflower seeds and kernels. Paper read at World conference on agricultural information and IT.
Kleinhans, M., H. Markies, S. De Vet, and F. Postema. 2011. Static and dynamic angles of repose in loose granular materials under reduced gravity. Journal of Geophysical Research: Planets (1991–2012) 116 (E11).
Koc, A. B. 2007. Determination of watermelon volume using ellipsoid approximation and image processing. Postharvest Biology and Technology 45 (3):366-371. Kostka-Rick, R., and W. J. Manning. 1993. Radish (Raphanus
sativus L.): a model for studying plant responses to air pollutants and other environmental stresses. Environmental pollution 82 (2):107-138.
Lane, S., and E. Martin. 1977. A histochemical investigation of lead uptake in Raphanus sativus. New Phytologist 79 (2):281-286.
Lewis‐Jones, L., J. Thorpe, and G. Wallis. 1982. Genetic divergence in four species of the genus Raphanus: implications for the ancestry of the domestic radish R. sativus. Biological Journal of the Linnean Society 18 (1):35-48.
Lugasi, A., A. Blázovics, K. Hagymási, I. Kocsis, and Á. Kéry. 2005. Antioxidant effect of squeezed juice from black radish (Raphanus sativus L. var niger) in alimentary hyperlipidaemia in rats. Phytotherapy research 19 (7):587-591.
Mathe-Gaspar, G., and A. Anton. 2002. Heavy metal uptake by two radish varieties. Acta Biologica Szegediensis 46 (3-4):113-114.
McGahon, M. K., J. M. Dawicki, A. Arora, D. A. Simpson, T. A. Gardiner, A. Stitt, C. N. Scholfield, J. G. McGeown, and T. M. Curtis. 2007. Kv1. 5 is a major component underlying the A-type potassium current in retinal arteriolar smooth muscle. American Journal of Physiology-Heart and Circulatory Physiology 292 (2):H1001-H1008.
Milani, E., M. Seyed, A. Razavi, A. Koocheki, V. Nikzadeh, N. Vahedi, M. MoeinFard, and A. GholamhosseinPour.
2007. Moisture dependent physical properties of cucurbit seeds. International Agrophysics 21 (2):157.
Mirzabe, A. H., J. Khazaei, and G. R. Chegini. 2012. Physical properties and modeling for sunflower seeds. Agricultural Engineering International: CIGR Journal 14
(3):190-202.
Mirzabe, A. H., J. Khazaei, G. R. Chegini, and M. H. Amir Pour Rostami Nejad. 2013a. Determination of some physical properties of virgin olive fruits. Agricultural Engineering International: CIGR Journal 15 (1):201-210.
Mirzabe, A. H., J. Khazaei, G. R. Chegini, and O. Gholami. 2013b. Some physical properties of almond nut and kernel and modeling dimensional properties. Agricultural
Engineering International: CIGR Journal 15
(2):256-265.
Mora, C., and A. Kwan. 2000. Sphericity, shape factor, and convexity measurement of coarse aggregate for concrete using digital image processing. Cement and concrete research 30 (3):351-358.
Moreland, D. E., G. G. Hussey, C. R. Shriner, and F. S. Farmer. 1974. Adenosine phosphates in germinating radish (Raphanus sativus L.) seeds. Plant physiology 54 (4):560-563.
Mwithiga, G., and M. M. Sifuna. 2006. Effect of moisture content on the physical properties of three varieties of sorghum seeds. Journal of Food Engineering 75 (4):480-486. Özarslan, C. 2002. PH—postharvest technology: physical
properties of cotton seed. Biosystems engineering 83 (2):169-174.
Perez, E., G. Crapiste, and A. Carelli. 2007. Some physical and morphological properties of wild sunflower seeds. Biosystems engineering 96 (1):41-45.
Pradhan, R., S. Naik, N. Bhatnagar, and V. Vijay. 2009. Moisture-dependent physical properties of jatropha fruit. Industrial Crops and Products 29 (2):341-347.
Sacilik, K., R. Öztürk, and R. Keskin. 2003. Some physical properties of hemp seed. Biosystems engineering 86 (2):191-198.
Sánchez-Mendoza, J., A. Domínguez-López, S. Navarro-Galindo, and J. A. López-Sandoval. 2008. Some physical properties of Roselle (Hibiscus sabdariffa L.) seeds as a function of moisture content. Journal of Food Engineering 87 (3):391-397.
Sekimata, M., K. Ogura, Y. Tsumuraya, Y. Hashimoto, and S. Yamamoto. 1989. A β-galactosidase from radish (Raphanus sativus L.) seeds. Plant physiology 90 (2):567-574.
Sharma, V., L. Das, R. Pradhan, S. Naik, N. Bhatnagar, and R. Kureel. 2011. Physical properties of tung seed: An industrial oil yielding crop. Industrial Crops and Products 33 (2):440-444.