First steps in the grape mechanization process in Brazil:
quantitative features
Wilson Valente da Costa Neto
1*, Miguel Garrido-Izard
1, Pilar Barreiro Elorza
1,
Fabrí
cio Domingues
2(1. Department of Agroforestry Engineering, Laboratory of Physical Properties and Advanced Technologies in Agri-food (LPF_TAGRALIA) ETSI Agrónomos, Technical University of Madrid, Avda. Complutense, 3. Madrid, 28040 Spain;
2. Miolo Wine Group Vitivinicultura S.A, General Manager of Almaden, 97578-831Brazil.)
Abstract: Grape harvest is still fully manual in the majority of farms in Brazil (above 99%), yet the structure of the fields and
the vine trellis are already prepared for being mechanized in a 24% of the cases. Besides, only the large-size farms are prepared for performing a detailed analysis of working capacity, product quality and losses; data of great value when trying to quantitatively address the incorporation of machinery. The fact that grape harvest in South America (and South Africa) be complementary in season compared to Europe, or North America, makes this potential market of Brazil an interesting option for European manufacturers. In this work, we have supervised a whole grape harvest season, in a 552 ha farm, where both, mechanical (trailed) and manual harvest, are performed. Harvest performance is assessed by means of digital field notebooks and using georeferenced data, Differential Global Positioning System (DGPS). A large variety of incidences have been found for the mechanized procedure due mainly to a deficient maintenance of the equipment, being reflected in a clearly reduction of the work capacity. Also in this study an analysis of juice losses due to mechanized harvest is performed. The quantitative features are defined and have been compared to evaluate the difference among both procedures, together with a technical discussion in the prospective of the grape (harvest) mechanization in the near future in Brazil.
Keywords: farm management system, must, viticulture in Brazil, grape harvest, lost grape
Citation: Neto, W. V. D. C., M. Garrido-Izard, P. B. Elorza, and F. Domingues. 2017. First steps in the grape mechanization process in Brazil: quantitative features. Agricultural Engineering International: CIGR Journal, 19(2): 110–119.
1 Introduction
Grape harvest mechanization started in California in
the 1960s by designing trellis that would allow the
mechanized process. It continued in Europe, mainly in
France, in the 1970s fostered by the petrol crisis. Ever
since, France reflects a large manufacturing expertise in
the subject: Braud (first commercialized model in 1975,
currenlty CNH Industrial), Gregoire (first model in 1978)
and Pellenc (at the beginning of the 1990s). In general
terms, an hour of mechanized work equals to the labour
of a team of 10 people on a full-dedicated day (8 h)
Received date: 2016-09-14 Accepted date: 2017-04-26 * Corresponding author: Wilson Valente da Costa Neto, Departament Agroflorosty Engineering, Technical University of Madrid, Avda. Complutense, 3. Madrid, Spain. Email: [email protected]
(Barreiro, 2009).
In Spain it is by 1990 that grape mechanization starts
due to the need of adapting the vine into the new trellis
system (Barreiro, 2009). The latest data available
(December 2014) indicate that there are 1980 harvesters
in Spain (MAGRAMA, 2014), being an order of
magnitude lower than France.
The vast majority of marketed grape harvesters work
on the basis of horizontal vibration and are classified into:
trailed, self-propelled and multi-purpose machines.
Trailed harvesters represent the lowest cost of acquisition
and maintenance, requiring a tractor power take-off (PTO)
above 56 kW, while self-propelled machines (offered in a
range of 75-100 kW), have an acquisition cost
substantially higher than trailed ones (more than double).
Self-propelled machines are ideal for contractors while
Since South America (the South Hemisphere) has a
complementary harvest season compared to Europe (the
North Hemisphere), international transport of harvesters
has become a new active business, which allows
duplicating the available working time (from about 500 h
to nearly 1000 h per year). Chile is the main depositary of
this interchange due to cultural similarities (language
among all), and several Spanish contractors are placing a
significant effort to offer grape harvesters all along the
year.
In 2015, Brazil reported 79094 ha for wine growing
(Figure 1), distributed in 9 states with an overall
production of 1.5 Mt; 50% for table grapes consumption,
and the rest for processing wine, juice and derivatives.
Figure 1 Cultivated area of vineyard in Brazil
The area planted with vineyards in Brazil (Figure 1)
has shown a steady increase from 1995 to 2008, and a
plain situation until 2013, while decreasing from 2013
until 2015. In 2015 an overall reduction of 1.83% has
been found, affecting most of the nine producing states;
only two showed a small increase in area, while the rest
had a reduction of 0.1% to 12.79%. This reduction may
be due to weather issues, poor hand availability and high
valuation on the land.
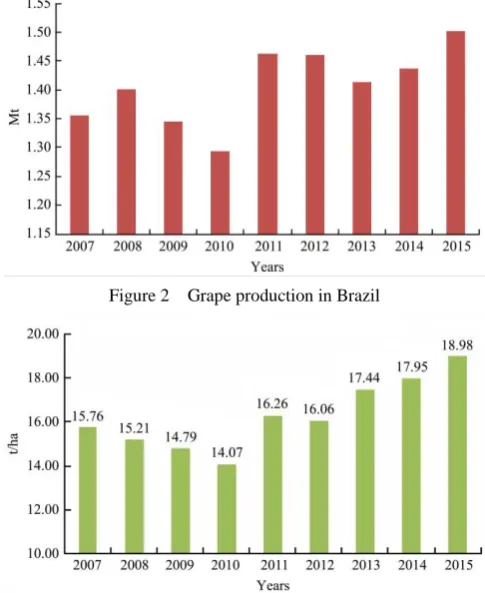
In 2015, 1.5 Mt of grapes were produced in Brazil
(Figure 2), which represents an increase of 4.41%
compared to 2014. Production decreased in 2015 in Bahia
(0.13%), São Paulo (3.22%) and Paraná (1.12%). These
states represent 22% of national production (Mello,
2015).
The production of grapes for wine, juice and
derivatives was 781 kt in 2015, accounting for 52.12% of
national production. The remaining production (47.88%)
was destined for fresh consumption in table grapes.
Figure 2 Grape production in Brazil
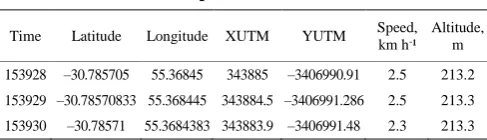
Figure 3 Mean production of grapes per ha in Brazil
It is estimated that among the total area of vineyard in
Brazil, a 24% is conducted in trellis system. Trellis
system has shown an increasing tendency due to the
lower cost of implementation and its suitability for
mechanization. Still, in 2015 only three grape harvesters
were available in Brazil: 2 trailed machines and one
self-propelled device.
Recently, precision agriculture techniques have been
adopted by few winegrowers in Brazil by considering the
correlation between the soil and the production and
quality of the grapes. On the other hand, researchers as
Sarri et al. (2016), go beyond this precision agriculture
concept, analysing parameters related with the vegetative
vigour by the use of specific technology (infrared sensors,
ultrasound, georeference, etc.)
There are a limited number of scientific papers related
to the evaluation of grape harvester performance. Pezzi
and Caprara (2009) presented a study on the transmission
of vibrations in vines of the variety Lambrusco
Grasparossa collected with a Braud VL6060. They
performed an analysis of losses (unharvested berries,
must release and must retain in vegetation, or expelled by
the cleaning system) as a matter of the setting parameters
460 min-1). The main results indicate that the
transmission of vibration to the plant only reaches 100%
for the higher frequencies (460 min-1); the losses of
berries on the ground are not influenced by the frequency
of vibration but by the characteristics of the constitution
of the machine and the vineyard. A higher frequency of
vibration decreases the number of uncollected berries
while increasing the liberated must losses, as well as the
number of detached leaves. Therefore better regulation is
one in which both aspects are minimized, in this study
corresponded to 440 min-1. The authors warn that losses
due to uncollected fruit easily visualized, and tend to
favour the use of excessive frequency since the must
losses are not obvious.
In 2011, Caprara and Pezzi (2011) performed a
similar analysis comparing two Gregoire grape harvesters:
trailed versus self-propelled. According to this study,
there is a significant reduction of unharvested berries, and
berries in the ground in the self-propelled (1.06% and
2.7%) compared to the trailed machine (1.7% and 3.9%),
that is to say a 33% reduction is obtained in self-propelled
compared to trailed machines, with similar must release
values (26.5% in self-propelled compared to 28.2% in
trailed machines). In spite of previous results, defoliation
index was lower for trailed than for self-propelled (17.8%
compared to 20.8%). These authors also performed
vibration analysis with both types of machines with
results pointing to a lower energy requirement for
detachment in self-propelled compared to trailed
machines, probably due to a lower transversal component
(of little detaching effect).
Nowadays there is a growing interest in carrying out
selective harvesting (Bramley, 2005; and Bramley, 2009).
In the case of side discharge harvesters (no hoper), the
unloading conveyor has a bidirectional movement that
sends the grapes towards two different trailers depending
on the quality (Báguena, 2011). In the case of rear
discharge harvesters (with hoper), there is a patent
(Berthet et al., 2010) by CNH Industrial that redirects the
flow to either hoper (left or right depending on the
quality). Báguena (2011) provides a large review of
precision viticulture evolution. The incorporation speed
of such innovations may be much faster than the previous
ones since they do not require further adaption of the
vines.
The objective of this work was to evaluate the
possibility of implementing mechanized operations in
Brazilian vineyards, identifying the agricultural units that
own grape harvesters and evaluating their field capacity,
yield, grape production and grape losses. Moreover, some
field manual data were analysed, obtained from the field
notebooks, as structure and cultivated varieties, area of
cultivation, losses, and the way of harvesting used
(manual or mechanical).
2 Materials and Methods
In Brazil, agricultural machinery is exempted from
licensing for circulation (Brasil, 2015), then from a study
carried out by Costa Neto et al. (2014), contacted the
owner of the only grape harvester in Brazil until then, to
carry out this work. Thus, the methodology adopted
consisted in: a field performance assessment by the
installation of a centralized DGPS antenna on the
machine; an evaluation of the field notebooks data and an
estimation of grape and must losses.
2.1 Field performance assessment with Diferencial
Global Positioning System (DGPS)
For the evaluation of the performance of the grape
harvester (Pellenc model 3052/Smart ystème), operating
with frequency of the shaker from 500 beats min-1 and
amplitude 850 mm, a DGPS antenna (Garmin modelo
H-17) was installed and configured at 1 Hz. Data were
recorded during a single day of harvest in a property
location in Santana do Livramento municipality in the
state of Rio Grande do Sul, Brazil (latitude 30°47′00′′S
and longitude 55°22′09′′W), in an area of 4.5 ha (Alma3
and Alma4), cultivation density 2.777 plants per hectare
(3.0 m × 1.2 m), estimated yield 11100 kg ha-¹
corresponding to Alicante Bouchet.
The tractor trailing the harvester was Massey
Ferguson model 291 with a nominal power of 72.2 kW.
National Marine Electronics Association (NMEA) codes
were recorded by means of free-code software (Visual
GPS Application®). Later, the data were processed in
Matlab® with dedicated routines for extracting: time,
coordinates X and Y (XUTM, YUTM), global
positioning system fix data ‘$GPGGA’ and track made
good and ground speed ‘$GPVTG’ messages. Data were
organized as exemplified in Table 1. The methodology
used for the processing was similar to that used in
Báguena et al. (2009).
Table 1 Transformation of NMEA codes for dimensional
parameters
Time Latitude Longitude XUTM YUTM Speed, km h-¹
Altitude, m 153928 –30.785705 55.36845 343885 –3406990.91 2.5 213.2 153929 –30.78570833 55.368445 343884.5 –3406991.286 2.5 213.3 153930 –30.78571 55.3684383 343883.9 –3406991.48 2.3 213.3
The routines developed considering the Bodria et al.
(2006) formulas allowed the identification of crop rows,
headlines, and stops, in other words, the determination of
the total working and effective time was made possible
for the first time in Brazil; evitable dead time is computed
as stops inside rows. The main parameters and formulas
used are explained below:
In-row time (In_row), in seconds (s), is duration while
the machine was inside the row.
Evitable dead time (TME), in seconds (s), is the
identification and sum of the times in which the machine
stops inside the row.
Accessory time (TA), in seconds (s), is the sum of all
the unavoidable times spent on the evaluated portion,
such as manoeuvring on the headland, unloading and fuel
replenishment.
Effective time (TE), in seconds (s), is considered
operating time, when the machine is not stopped inside
the row.
TE = In_row – TME (1)
Effective Capacity (WCe), in hours per hectare (h/ha)
was calculated by:
WCe (h/ha) = 1/Te (2)
Theoretical capacity (WCt) was calculated using the
following formula:
WCt (ha h-1) = b*v*10-1 (3)
where, b – distance between lines (m); v – theoretical
forward speed (km h-1).
Actual field efficiency (Act_FE):
( )
_ 100
( )
TE
Act FE
TME TA TE
(4)Actual work capacity (WCa):
_ _
100
a
WC t Act FE
WC (5)
Optimal field efficiency (Opt _FE):
( ) _ 100 ( ) TE Opt FE TA TE
(6)2.2 Field notebook
Field notebook has been organized with respect to the
following items: plot, variety, surface, plant density,
production, harvest losses (grapes on ground), mold
losses and type of harvest (manual or mechanized).
From this information it is possible to extract a series
of data, as follows, such as the use of the machine and its
performance against manual harvesting.
2.3 Loss grapes and must release
Besides, an additional determination of grape losses
was performed whenever mechanized harvesting took
place. It was defined an area of 18 m² centred in the
production line before harvest, where grapes on the soil
were removed (not performed in the standard notebook
data) shows sampling rectangle, in this case with 6.0 m ×
3.0 m. After harvesting, grapes on the soil were counted
and weighed.
To evaluate the occurrence of mold, a number of
plants growing in the contiguous line (not yet harvested),
was evaluated. The number and weight of rotten grapes
were then evaluated. Therefore, grape loss evaluation
consisted of in two parameters (losses in the soil and
rotten grapes). Evaluation was performed by three
replicates per plot.
As a qualitative test, water sensitive papers were used
for evaluating must release during the harvest, since
beaters remove the fruits from the wood, which is
markedly different from manual harvest. The papers were
arranged as shown in Figure 4, two being positioned on
the ground away from 60-80 cm stem on the planting row
(A-B); stem with a height of 40 cm (C); two in the
production string (D-F); and two more in the canopy area,
height 1.30-1.50 m (E-E1), as exemplified in Figure 4.
After the mechanical harvest, the papers were
immediately collected and catalogued for further image
acquisition and analysis by MatLab®, which allowed the
to moisture) in a similar way as Salem et al. (2014):
2B – R – G > 15 (7)
where, B – blue channel; R – red channel; G – green channel, and the constant –15.
Figure 4 Positioning the hydro sensitive papers
3 Results and Discussion
3.1 Field performance assessment with GPS
Table 2 shows the time records and work speeds in
each crop row for Alma 3 plot, according to DGPS.
According to time records, the WCt in Alma 3 was 0.695
ha h-1, the Opt _FE was 90.6%, while the Act_FE was
39.7%. On the other hand, average work speed was rather
low (2.32 km h-¹) with coefficients of variation (CV)
nearly always above 20%.
Table 2 Time records and work speeds per crop row in
Alma 3 according to DGPS
In-row,
s
TME,
s
TA,
s
TE,
s
Speed, km h-1
CV of speed, %
491 341 23 150 2.39 20.6 442 339 33 103 2.35 11.1 708 335 27 373 2.37 19.9 446 337 26 109 2.42 13.6 610 349 28 261 2.34 23.8 512 348 26 164 2.32 19.0 693 361 26 332 2.32 28.0 896 789 39 107 2.29 23.2 528 351 33 177 2.32 20.5 883 381 24 502 2.23 23.3 952 373 31 579 2.25 28.0 838 381 29 457 2.18 24.2
Figure 5a shows the work pattern in Alma 3 plot
according to GPS records. Duration of every TME in a
row is identified by a corresponding stop duration colour.
The large spread in TME corresponds to several needs:
adapting the work speed with the conveyor speed
(synchronization did not work) few seconds, removing
leaves whenever system was blocked 10 s, and replacing
the conveyor into the carrier platform above 40 s (Figure
5b). All of this clearly indicates the lack of proper
maintenance of the machine.
Figure 5a Work pattern in Alma 3 field according to GPS records
Figure 5b Histogram of in-row TME
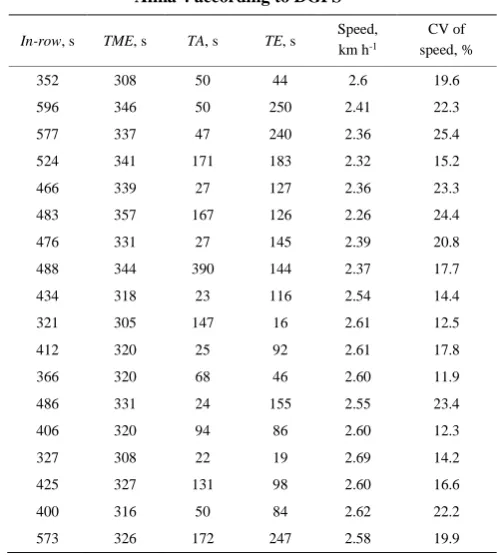
Table 3 shows the time records and work speeds per
crop row in Alma 4 plot according to DGPS. As before,
TME is identified as time with null speed inside the row
and it is labelled as evitable since this fact is totally
abnormal. According to time records in Table 4, the WCt
in Alma 4 was 0.738 ha h-1, the Opt _FE (miss regarding
the TME) was 56.8%, while the Act_FE was 22.6%, that
is to say considering the TME. On the other hand, average
work speed was rather low (2.46 km h-¹ on average) with
CV in above 20% (very high).
Table 4 compares the machine performance in both
fields Alma 3 and Alma 4. In both cases the speed was
similar (2.32 and 2.46 km h-1). The Act_FE was
extremely poor in both cases (39.7% and 22.6%). In case
of Alma 4 many of the TME occurred at the headlines and
drastically reducing the Opt_FE (from 90.6% in Alma 3
to 56.8% in Alma 4). The WCt in Alma 3 and Alma 4
were 0.695 and 0.738 ha h-1 respectively. Field efficiency,
computed as described in material and methods, indicates
a very poor field performance due to the existence of very
long dead time (93.1% and 77.7% out of whole
ineffective time).
Figure 6a shows the work pattern in Alma 4 field
according to GPS records. Duration of every TME in a
row is identified by corresponding stop duration colour,
not being represented the TME occurred at the headlines.
As before, the large spread in TME corresponds to
several needs: adapting the work speed with the conveyor
speed (synchronization did not work) few seconds,
removing leaves whenever system was blocked 10 s, and
replacing the conveyor into the carrier platform above 40
s (Figure 6b). As before, this clearly indicates the lack of
proper maintenance of the machine.
Table 3 Time records and work speeds per crop row in
Alma 4 according to DGPS
In-row, s TME, s TA, s TE, s Speed,
km h-1
CV of speed, %
352 308 50 44 2.6 19.6 596 346 50 250 2.41 22.3 577 337 47 240 2.36 25.4 524 341 171 183 2.32 15.2 466 339 27 127 2.36 23.3 483 357 167 126 2.26 24.4 476 331 27 145 2.39 20.8 488 344 390 144 2.37 17.7 434 318 23 116 2.54 14.4 321 305 147 16 2.61 12.5 412 320 25 92 2.61 17.8 366 320 68 46 2.60 11.9 486 331 24 155 2.55 23.4 406 320 94 86 2.60 12.3 327 308 22 19 2.69 14.2 425 327 131 98 2.60 16.6 400 316 50 84 2.62 22.2 573 326 172 247 2.58 19.9
Table 4 Machine performance and field efficiency in both fields Alma 3 and Alma 4
Name Speed, km h-1 Au, m Sum (TME) Sum (TA) Sum (TE) WC
t, ha h-1 WCe, ha h-1 WCa, ha h-1 Opt_FE, % Act_FE, %
Alma 3 2.32 3 4685 345 3314 0.695 0.629 0.276 90.6 39.7 Alma 4 2.46 3 5894 1685 2218 0.738 0.419 0.167 56.8 22.6
Figure 6a Work pattern in Alma 4 field according to GPS records Figure 6b Histogram of in-row TME
Another interesting feature from DGPS is the
possibility of addressing the work sequence, and thus the
steering radius selected by the operator. In Alma 3 the
typical steering diameter was 4 rows (ranging from 1 to
6). In Alma 4 the steering diameter was equally
distributed between 4 and 5 rows (ranging from 1 to 8).
3.2 Digital field notebooks outcomes
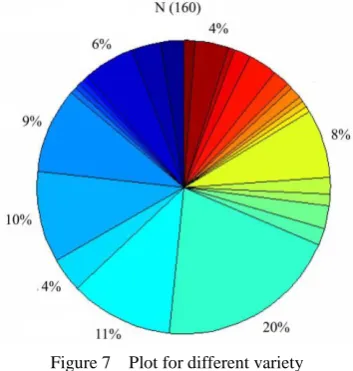
Figure 7 presents the amount of vine varieties grown
in the farm under study (552 ha, 160 fields), all in trellis,
that is to say harvest mechanization is feasible for the
whole farm. According to the field notebook, 28 varieties
were grown in 2015 which is a huge variety compared to
standard production in Europe (approximately 20
varieties per farm). Among the varieties in use, the most
relevant ones (as a matter of ha) gather 40% of red grapes:
and Moscato (4%); 20% of white grapes: Riesling Italico
(8%) and Sauvignon Blanc (6%), Chardonnay (4%); and
10% of surface without indication of variety in the
notebook; the remaining 30% corresponds to varieties
with field area below 3%.
Figure 7 Plot for different variety
According to the field notebook, 77.3% of the field
(115 plots) are harvested manually at current stage, while
a 27.7% (44 plots) are harvested with mechanical
harvesters, among them the main mechanized varieties
are: Cabernet Sauvignon (14/32 plots), Riesling Italico
(6/12 plots), Merlot (5/15 plots), Tannat (4/18 plots), and
Pinnot Noir (3/5 plots).
Figure 8 presents the proportion of the use of
mechanical harvest in 28 most representative parcels of
the property. In 10 cases there is no variability since a
single field grows the corresponding variety. For the rest,
we appreciate production rates for a single variety that
range from 4 to 11 t ha-1 (Semillon Blanc) will others
are less variable (3 to 7 t ha-1). It should also be
highlighted that outlier fields (Red Crosses) appear for
varieties (Cabernet Sauvignon and Chardonnay). In the
case of Cabernet Sauvignon there are 2 plots that had
nearly no production at all, while in the case of
Chardonnay we find a field which doubles the
production of the rest of fields.
Figure 9 shows a scatter plot of field production
(t ha-1) and grape losses (%) for the 160 plots harvested in
2015 as referred by the field notebook. Manual harvest is
shown as squares (116) while mechanized harvested
fields are shown as filled circles (44). Most of fields show
losses below 2% (152/160), corresponding all of them to
manually harvested fields.
Figure 8 Mechanized plots and total
The Figure 10 shows the amounts of grape harvest
losses during three different portions for the variety
Alicante Bouchet.
Figure 10 Third party versus property assesment
In Figure 10, the first column refers to the losses of
grapes by the author after the mechanical harvesting.
The other two columns were extracted from the notebook,
in which records all uncollected grapes, already on the
ground, after harvest not being cleaned the soil
previously as in the case of the authors measurements.
Thus, a loss grape percentage of 1.24% was obtained
for the author while by the notebook it was obtained a
percentages of 2% and 6%.
The value found (119.7 kg ha-1) only refer to losses in
mechanical harvesting of grapes in the soil is below the
values found by Pezzi and Caprara (2009).
The high quality of the notebook data constitutes a
major tool for the design of a mechanization strategy
which will be further discussed.
3.3 Must release
Five analyses were performed at the following times:
09:00, 10:30, 11:30, 12:30 and 13:00. The results are
shown in Table 5. It can be seen that, in general, paper
reaction decreased with time, due to the presence of early
moisture in the morning; relative humidity in the zone
decays over 40% from 8:00 to 12:00, while thermal
amplitude exceeds 12°C. The areas with highest paper
reaction were “C” with an average of 77.7% followed by “D-F” (average of 44%), and “A-B” (41%), and finally “E-E1” (34.5%).
These values are higher than those disclosed by
Barreiro et al. (2016), with values in the order of 22% and
34% for a similar “D-F” and “C” position.
Table 5 Recoating percentage of paper-water sensitive
Time A-B, % C, % D-F, % E-E1, %
09:00 98.85 N/C 12.81 98.83 10:30 42.57 96.95 97.18 68.57 11:30 9.49 77.81 44.88 1.31 12:30 2.40 48.23 47.18 1.69 13:30 50.55 87.91 17.85 2.07 Note: N/C – Not Calculated.
Figures 11 and 12 are the sets of papers-water
collected in 09:00 and 13:30. It can be visually perceived
the difference in coverage between the two samples
(98.85% and 50.55%). However, it has to be emphasized
that some of the reaction of the water sensitive papers,
could be due to the movement of the branches and leaves
system sack (exhaust) of grape harvester and not to the
direct impact of must drops. Still, it is noticed that the
stem region, as well as the area corresponding to the first
wire (location of bunches of grapes) are the ones that
stood out by coverage.
Note: Reaction of the papers practically in all the points of the plant.
Figure 11 Sets of papers-water collected in 09:00.
Note: Reaction due to contact with must, stem (C), soil (A-B) and buches (D-F).
Figure 12 Sets of papers-water collected in 13:30.
4 Conclusions
Grape mechanization in Brazil is just about to start
with few machines while 24% of the surface is already
in Brazil makes extremely difficult the maintenance of
the machines in a proper status as verified in this study,
and thus it is not easy to foresee the speed of
mechanization in the following years.
The technical staffs of the farms use digital field
notebooks in which detailed information per plot is
included: production, type of harvest, grape losses and
mold effects. The analysis of notebook data (160 plot,
552 ha) has shown that in all plots mechanically
harvested (44) there was no significant increase in losses
compared to manual harvesting (around 2%).
The analysis of grape harvesters requires the
definition of a new concept (must release) that has never
been used in manual harvesting. Must release may be
important since fruits are detached from the wood which
constitutes a totally new approach compared to manual
harvesting, in an effect that will for sure be variety
dependant. In this study a large variability in must release
is found using water sensitive paper. Interestingly, this
method also allows addressing water deposition in the
early hours of the day since there is thermal amplitude of
12°C and air relative humidity ranging from 22% to 90%
in 4 hours.
In this study only 2 plots (4.5 ha) have been analysed
with DGPS, as the first approximation for upcoming
years. Machine performance was very poor due to
evitable dead times. The trailed machine was not in
proper status. As a consequence three types of dead times
occurred inside the crop row: adapting the work speed
with the conveyor speed (synchronization did not work)
few seconds, removing leaves whenever system was
blocked 10 s, and replacing the conveyor into the carrier
platform above 40 s. Theoretical field efficiency could
reach 89% which means that with proper maintenance,
mechanization could be properly attained. However,
actual field efficiency ranged from 22.6% to 39.7% due
to in-row stops. Theoretical machine performance (ha h-1)
was also low compared to previous studies, as due to the
low ground speed (below 2.5 km h-1).
As a general remark, there is a need of an engineering
profile to support farmers in this mechanization process
with institutional (public or private) support and local
technical consultancy from grape harvest manufacturers.
Works similar to this will be carried out with the other
existing machines, which will allow the monitoring of the
evolution of the mechanization of viticulture in Brazil, an
area of importance for the agricultural engineering.
Acknowledgements
The author gratefully acknowledges the financial
support of CNPq.
References
Báguena, E. M., P. Barreiro, C. Valero, X. Sort, M. Torres, and J. M. Ubalde. 2009. On-the-go yield and sugar sensing in grape harvester. In Proc. 7th European conference on Precision Agriculture Precision agriculture 273-278. Wageningen, Netherlands, 6-8 July.
Báguena, E. M. 2011. On-board system for yield and quality determination in grape harvesters: development and field validation. Ph.D. diss. Madrid, España: Escuela Técnica Superior de Ingenieros Agrónomos, Universidad Politécnica de Madrid.
Barreiro, P. 2009. De la vendimia mecanizada a la mecanización total del viñedo. Vida Rural,vol. (297): 66–72.
Barreiro, P., B. Diezma, M. Garrido-lzard, A. Moya, and C. Valero. 2016. Vendimiadora New Holland Braud 8030L, caminho de la perfección. Vida Rural, (404): 12–21.
Berther, J. P., T. Le Briquer, and J. Berthet. 2010. Selective harvesting method for e.g. grapes, in agricultural plot, involves automatically activating supply system based on determined zone for storing harvest flows from zone into corresponding container. Patent FR2936682– A1 (in French) Bramley, R. G. V. 2005. Understanding variability in winegrape
production systems 2. within vineyard variation in quality over several vintages. Australian Journal of Grape and Wine Research, 11(1): 33–42.
Bramley, R. G. V. 2009. Lessons from nearly 20 years of Precision Agriculture research, development, and adoption as a guide to its appropriate application. Crop and Pasture Science, 60(3): 197–217.
Brasil. National Congress. Brazilian. 2015. Traffic Code. Law 13.154, July 30th, n° 145. Brazilia. Official Diary of the
Union.
Bodria, L., G. Pellizzi, and P. Piccarolo. 2006. Meccanica Agraria, vol. 2: La meccanizzazione. Bologna, Italy: Edagricole. Caprara, C., and F. Pezzi. 2011. Measuring the stresses transmitted
during mechanical grape harvesting. Biosystems Engineering, 110(2): 97–105.
the campaign of RS-Brazil. In Proc. 37th World Congress of vine and wine, 323-324 Mendoza, Argentina, 9-14 November. MAGRAMA (Ministerio de agricultura, alimentación y Medio
Ambiente). 2015. Anuario de estadística 2014. Available at: http://www.magrama.gob.es/es/estadistica/temas/publicacione s/anuario-de-estadistica/2014/default.aspx?parte=3&capitulo= 15&grupo=6. Accessed 18 April, 2016.
Mello, L. M. R. 2016. Desempenho da viticultura brasileira em 2015. Available at: https://www.embrapa.br/busca-de- noticias/-/noticia/9952204/artigo-desempenho-da-vitivinicultu ra-brasileira-em-2015. Accessed 16 April, 2016.
Pezzi, F., and C. Caprara. 2009. Mechanical grape harvesting: investigation on the transmission of vibrations. Biosystems Engineering, 103(3): 281–286.
Salem, H. M., C. Valero, M. Á. Muñoz, M. Gil-Rodríguez, and P. Barreiro. 2014. Effect of reservoir tillage on rainwater harvesting and soil erosion control under a developed rainfall simulator. Catena, 113(1): 353–362.