Telephone: 020 7944 4400 Website: www.communities.gov.uk
© Crown Copyright, 2009
Copyright in the typographical arrangement rests with the Crown.
This publication, excluding logos, may be reproduced free of charge in any format or medium for research, private study or for internal circulation within an organisation. This is subject to it being reproduced accurately and not used in a misleading context. The material must be acknowledged as Crown copyright and the title of the publication specified.
Any other use of the contents of this publication would require a copyright licence. Please apply for a Click-Use Licence for core material at www.opsi.gov.uk/click-use/system/online/pLogin.asp, or by writing to the Office of Public Sector Information, Information Policy Team, Kew, Richmond, Surrey TW9 4DU
e-mail: [email protected]
If you require this publication in an alternative format please email [email protected]
Communities and Local Government Publications Tel: 0300 123 1124
Fax: 0300 123 1125
Email: [email protected]
Online via the Communities and Local Government website: www.communities.gov.uk
75%
August 2009
Product Code: 09CFD06052
Introduction
For some, building cohesion is worthy or morally justified for its own sake. For others, it can appear woolly, lacking in real world impact or at worst social engineering. However, the evidence suggests that cohesion can have real costable benefits in a number of different areas, both to communities and to the individuals living within these communities, and therefore there is a strong economic case for pursuing policies that look to improve cohesion.
This section looks at what the existing research has found about the benefits of improving cohesion. The area where there has been more work carried out has been on the impacts on crime, however this section also looks at other impacts of improved community cohesion and social networks such as the health benefits, education, and employment. It should be noted from the outset that the estimates in this paper are potential cost savings based on the estimated relationships, rather than cost savings that have actually been observed from cohesion policies.
Crime
Most of the studies which have looked at the relationship between cohesion and crime have suggested that more cohesive areas have lower crime levels. The theory behind this is that higher levels of social integration can lead to the community sharing the same values and goals, and these include keeping the neighbourhood safe and free from crime.
For example, one early study by Shaw and McKay (1942) found that the geographic variations in crime were due to variations in cohesion. Sampson and Groves (1989)
found that areas which are socially disorganised and lack cohesion have disproportionately high rates of crime and delinquency. Hirschfield and Bowers (1997) found that levels of crime are significantly lower than expected in areas that are disadvantaged but have high levels of social cohesion. Therefore, the more that an area that is at a disadvantage economically pulls together as a community, the greater its capacity to combat crime.
Sampson and Raudenbush (1999) stated that social control takes the form of people in cohesive areas being prepared to pull together and intervene in deviant and criminal activities for the public good. This collective efficacy,as they referred to it, was found to be associated with lower rates of crime and social disorder even after controlling for structural characteristics of the neighbourhood.
BVPI data found medium correlation between burglary, violent crime and robberies and cohesion. Furthermore, Laurence and Heath (2008) found that increasing levels of crime and fear of crime were both strong negative predictors of community cohesion.
These studies indicate that crime may therefore be a product of “weak” community
cohesion. Areas with a high sense of community are communities which share similar goals and values, the strongest of which is to keep neighbourhoods safe and free from crime.
Much of the research has looked at how community cohesion can influence crime levels by exerting a form of social control, providing a set of norms of behaviour which individuals in an area are expected to abide by. In Crime and Cohesive communities (Home Office, 2006) Wedlock used data from the Local Areas Boost of the 2003 Citizenship Survey to expand this definition of cohesion and identified five key factors of community cohesion, namely: sense of community; similar life opportunities; respect for diversity; political trust and sense of belonging, and looked at the influence of these factors on different types of crime. Wedlock’s study looked at community cohesion in 20 local areas, with each local area being made up of 2 contiguous wards making up a total of 10,138 respondents.
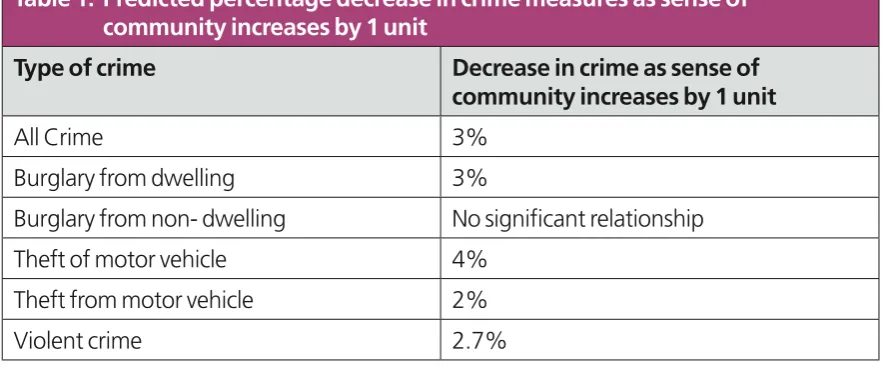
[image:5.595.70.512.532.715.2]The study found the strongest relationship to be between sense of community and different types of crime, the particular crimes which were looked at were violent crime, burglary from dwelling and non dwelling, theft of a motor vehicle and theft from a motor vehicle. The sense of community factor captured aspects of social control such as whether neighbours look out for each other and pull together to improve the community, as well as other measures of cohesion which are more to do with a sense of camaraderie such as whether people are proud of their neighbourhood and enjoy living there. The table below shows Wedlock’s findings:
Table 1: Predicted percentage decrease in crime measures as sense of community increases by 1 unit
Type of crime Decrease in crime as sense of community increases by 1 unit
All Crime 3%
Burglary from dwelling 3%
Burglary from non- dwelling No significant relationship Theft of motor vehicle 4%
Estimating the cost savings from reduced crime
Using the relationship estimated above, it is possible to estimate the potential cost savings from policies to improve community cohesion. The following applies these marginal impacts to the level of crime in each category to calculate the potential reduction in crime from improved cohesion, and then uses the Home Office’s economic cost of crime estimates to calculate the possible cost savings.
Potential cost saving = (Impact of cohesion on crime type * level of crime in 2007/08) * Cost of crime
Level of crime
Home Office uses two main data sources to measure crime in England and Wales:
• Police recorded crime– crimes reported to and recorded by the police
• British Crime Survey (BCS)– survey that measures the amount of crime in England and Wales by asking people about crimes they have experienced in the last year.
There are limitations with using both of these data sources. Police recorded crime only provides information on crimes which have been reported to and recorded by the police, and therefore do not include crimes which go unreported, which may be significant in some areas. The BCS on the other hand captures both reported and unreported crimes, therefore for the crimes that it covers it can provide a better reflection of household and personal crime. However, as a household survey, there are some crimes that it cannot cover effectively, where the victims can either not be interviewed or there is no obvious victim (murder is an obvious category, fraud and crimes against businesses are others). Furthermore, the survey only covers victims aged 16 years and over (although the survey does now cover under 16s but the results from this are not yet available). Another weakness of the BCS is the lack of robustness of the survey results at local levels.
Further adjustments
In addition to adjustments made for under 16s, further adjustments were made to the recorded crime levels for theft of a vehicle and theft from a vehicle (prior to uplifting) to account for commercial targets, and to account for ‘nil value’ offences (which represent attempts). The 2007/08 recorded crime figures for these crimes were reduced to account for attempts (by 25.8 per cent and 15.5 per cent respectively) and to account for thefts from commercial vehicles (by 8 per cent and 12 per cent respectively)1.
Cost of Crime estimates
Home Office has estimated the economic and social costs of different types of crimes. These estimates cover three main categories of costs, namely:
• Costs in anticipation of crime– eg insurance adminstration
• Costs as a consequence of crime– eg the physical and emotional impact on victims, value of property stolen or damaged
• Costs in response to crime– eg Criminal Justice System (CJS) costs such as police.
Unit costs were calculated for the main crime types, including the ones of interest to this work. The latest estimates were for the period 2003/042, these were uplifted to
2007/08 prices using the HM Treasury GDP deflator figures. The cost of crime programme is an ongoing stream of work for the Home Office and further updates are planned for the future.
Cost saving estimates
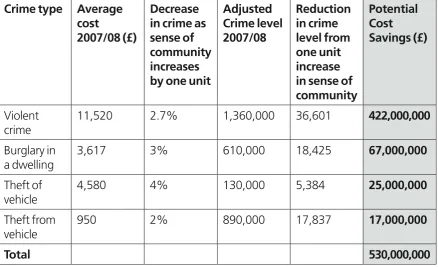
The table below shows the estimated potential cost savings for different types of crime from an increase in community cohesion. It should be emphasised that these are potential
cost savings based on the estimated relationship between community cohesion and crime, rather than cost savings that have actually been observed from cohesion policies.
1 See ‘Comparing BCS estimates and police counts of crime 2005/06’ Home Office.
Table 2: Estimated potential cost savings in England and Wales from increase in community cohesion
Crime type Average cost
2007/08 (£)
Decrease in crime as sense of community increases by one unit
Adjusted Crime level 2007/08 Reduction in crime level from one unit increase in sense of community Potential Cost Savings (£) Violent crime
11,520 2.7% 1,360,000 36,601 422,000,000
Burglary in a dwelling
3,617 3% 610,000 18,425 67,000,000
Theft of vehicle
4,580 4% 130,000 5,384 25,000,000
Theft from vehicle
950 2% 890,000 17,837 17,000,000
Total 530,000,000
Note: Figures may not sum due to rounding
As can be seen in the table, the greatest potential cost savings appear to be in terms of reducing the costs of violent crimes- these are the crimes which have the highest unit cost. This is consistent with much of the literature which has looked in particular at the relationship between violent crime and community cohesion, and is consistent with the theory that improving community cohesion acts as a form of social control which influences the behaviour of individuals within the community.
Sensitivity analysis
The potential cost savings shown above should be treated with some caution as they represent estimates which are very much dependent on the assumptions underlying them. There is a great deal of uncertainty around the magnitude of the relationship between cohesion and crime, and it is for this reason that sensitivity analysis was carried out which looks at the cost savings when we adjust the assumptions.
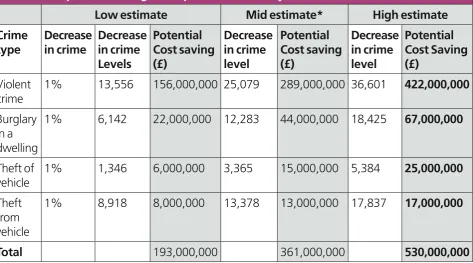
Table 3: Estimated potential cost savings in England and Wales after adjusting the as-sumptions on marginal impact of community cohesion on crime levels
Low estimate Mid estimate* High estimate
Crime type Decrease in crime Decrease in crime Levels Potential Cost saving (£) Decrease in crime level Potential Cost saving (£) Decrease in crime level Potential Cost Saving (£) Violent crime
1% 13,556 156,000,000 25,079 289,000,000 36,601 422,000,000
Burglary in a dwelling
1% 6,142 22,000,000 12,283 44,000,000 18,425 67,000,000
Theft of vehicle
1% 1,346 6,000,000 3,365 15,000,000 5,384 25,000,000
Theft from vehicle
1% 8,918 8,000,000 13,378 13,000,000 17,837 17,000,000
Total 193,000,000 361,000,000 530,000,000
* Mid estimate is calculated as the mid point between the original estimate and the low estimate Note: figures may not sum due to rounding
The low estimate in the table above shows the impact on cost savings of adjusting the assumptions on marginal impacts. It can be seen here that cost savings reduce by more than half when we adjust the assumptions. The Mid estimate shows the mid point between the original estimates of cost saving in table 2 and the low estimate in the table above. This gives an indication of the great uncertainty around potential cost savings of improving community cohesion.
Using the mid point estimate, the average potential cost savings per local authority in England and Wales would be £880,000 (the range is between £0.5m and £1.3m). This is likely to vary widely by different local authorities, depending on their relative size, the crime levels and how cohesive these areas are at the moment.
Caveats
As mentioned earlier, there is a great deal of uncertainty around these estimated cost savings. There are a number of caveats around this work that need to be highlighted:
• Issues of causality – Wedlock (2006) uses cross sectional data and therefore it can say nothing about the direction of causality. Although there have been a number of studies exploring the link between crime and cohesion it cannot be said with any certainty that all the potential cost savings here can be attributed to greater community cohesion. As mentioned earlier, high crime rates can also drive people’s opinions of community cohesion, so this may have a significant impact on the estimates in this paper.
• Use of Wedlock’s work – Wedlock’s work was based on a subset of 20 areas, and therefore there is a question mark over whether the relationship between crime and cohesion in these areas is the same as for the country as a whole. In particular, the wards looked at tended to be the most deprived wards so there may be an issue of whether the relationship between crime and cohesion differs between more and less deprived areas. Furthermore, Wedlock’s work looked at the relationship at a single point in time, and so therefore there is a question mark over whether the relationship between cohesion and crime has changed significantly since this paper was written.
• Crime levels – the multipliers used to estimate adjusted crime figures were taken from the last update of the economic cost of crime figures from 2003/04. There is a question over whether the multipliers would vary significantly if they were calculated using more recent data, and what impact this may have on the estimated crime levels and cost savings.
• Cost of crime – as with the multipliers, the most recent estimates of the cost of crime came from 2003/04 and for the purposes of this exercise they have been uplifted by inflation to put them into 2007/08 prices. Any future Home Office revisions of the methodology could potentially have a significant impact on the estimated cost savings.
• Opportunity cost – the costs of crime estimates are a measure of the
opportunity cost. Therefore, any potential cost savings should also be interpreted in terms of opportunity cost.
• Impacts of current cohesion policies – these estimated potential cost savings don’t say anything about the impact that the policies in place currently to
Other impacts
This section looks at the evidence of the links between community cohesion and impacts in other areas such as fear of crime, health, education and employment. It does not attempt to put a monetary value on the impacts in these different areas because there have not been any studies similar to the work carried out by Wedlock which can be used as a means of estimating cost savings.
Fear of crime
Wedlock’s original work did not look at the impact of cohesion on fear of crime but it is an area which is potentially of great interest. Laurence and Heath’s (2008) work looking at the drivers of social cohesion indicated that fear of crime and fear of a racist attack had a negative impact on people’s opinion of how cohesive the area in which they lived in was. However, various studies have suggested that fear of crime is uncorrelated with actual crime levels in areas, it has more to do with anti-social behaviour, behaviour which make people fearful, such as youths hanging around on street corners, or signs that people do not care about the area such as graffiti or litter. Fear of crime therefore seems to be different to actual crime.
The relationship between cohesion and fear of crime is likely to run in both directions with fear of crime being a product of uncohesive communities but also leading people to have low opinions of the level of cohesion within their locality. In areas where cohesion is low, people may not trust one another, may not feel others meet their responsibilities and may feel fearful and suspicious of others, all factors which may increase their fear of crime.
There has been little work done on the costs of fear of crime. Dolan and Peasgood (2007) looked at how the economic and social costs of fear of crime may be estimated. They defined fear of crime as all the tangible and intangible costs in anticipation of possible victimisation, ie the costs people incur in anticipation of being a victim of crime. Fear of crime can have both non health and health consequences. Non health consequences include costs incurred from people changing their behaviour to avoid being a victim of crime. For example, this may include additional transport expenditures such as taking taxis at night, or the loss of output resulting from people leaving work early to avoid walking home at night, or time spent locking car doors etc. Home Office work on cost of crime does cover the costs incurred in anticipation of crime, however these costs do not cover the costs of precautionary behaviour.
uncertainty concerning this estimate given the underlying assumptions behind them and that they should be treated as provisional only. Furthermore, this does not give an indication of the relationship between community cohesion and fear of crime, and the possible impact increased community cohesion may have on the costs of fear of crime. Therefore, it would be worth exploring further the relationship between these variables and looking in more detail at the potential cost savings which may arise from tackling cohesion in terms of reducing individuals’ fear of crime.
Health
On the face of it, it is not apparent that community cohesion would have an impact on the health and well being of individuals. However, a number of studies have shown that the environment in which a person lives in, such as how cohesive it is and the social networks a person keeps, can impact on the likelihood of them suffering certain types of health ailments, such as depression, loneliness, and the probability of committing suicide.
Kawachi et al(1999) stated that at the community level, social cohesion can influence health outcomes through several different channels. One way is through social control, whereby the community acts in response to deviant health related behaviour, for example it may intervene to prevent deviant youth behaviour such as underage smoking or drug taking. This crucially depends on the existence of mutual trust and solidarity amongst neighbours. Another way it can influence health outcomes is through promotion of healthy norms of behaviour, so for example promotion of physical activity. Finally it can influence behaviours through more rapid diffusion of health information. Therefore, this highlights that there are a number of different ways in which cohesive communities can influence an individual’s health outcomes.
In a very early study, Durkheim (1897) compared suicide statistics in European countries over time and space and concluded that the lowest rates of suicide occurred in countries with the highest degrees of social integration. Most importantly, whereas individuals at risk of committing suicide came and went, the social suicide rate in each society remained relatively constant, which the author suggested provided evidence of the power of social forces.
Bruhn and Wolf (1979) found that neighbourly behaviour in Roseto Pennsylvania helped to explain good health and lack of heart disease. They concluded that socially disconnected people were 2-5 times more likely to die from all causes compared with matched
individuals who have closer ties with family and friends.
There have also been a number of studies looking at the links between social capital and health outcomes. The literature suggests that social capital can be seen as an element of social cohesion. For example Putnam(2000) describes social capital as the features of social life, networks, norms and trust that enable participants to act together more effectively to pursue shared objectives. He also goes on to say that social capital is an element of cohesion in the sense of a just, equitable, tolerant and well integrated society, so it can be seen as an intermediate target that could help towards the broader objective of social cohesion. Also, Kawachi and Berkman (2000) defined a cohesive society as one which is richly endowed with social capital. Social capital therefore forms a subset of social cohesion, although it is just one element of social cohesion, with the other element being the absence of latent social conflict.
Evidence of the links between access to social capital and health outcomes was provided by Kawachi et al (1999), wholooked at the relationship between state level social capital and individual self rated health. They found that even after controlling for individual risk factors (eg income, smoking, obesity, access to health care) individuals in areas with low social capital were at increased risk of poor self rated health, thus suggesting that an individual’s social networks and their access to social capital can exert a strong influence over their health outcomes.
Kawachi et al (1997a) also compared social capital indicators across the US with state level mortality rates. They looked at the per capita group membership in organisations such as church, sports groups etc and found that a 1 unit increment in average per capita group membership was associated with lower average mortality rates of 66.8 deaths per 100,000 population. The study also looked at measures of civic trust compared to variance in mortality rates and found that variations in the level of trust explained 58 per cent of the variance in total mortality across states. It found that a 10 per cent increase in trust levels was associated with a 9 per cent lower level of mortality.
As well as social cohesion influencing the health outcomes of individuals, the relationship can also run in the other direction with individuals suffering from health ailments having low perceptions of cohesion in their community. For example, Laurence & Heath’s (2008)
The above all describe studies which have explored the relationship between indicators of social cohesion, social capital and health outcomes, at both the individual and community level. Most of these studies have looked at the US and there has not been much work looking at cohesion and health outcomes in the UK, where differences in the way in which health services are delivered may affect the relationship between cohesion and health outcomes. There has been no work done similar to Wedlock’s work on crime which attempts to quantify the impact of improvements in cohesion on health outcomes of individuals.
As an indication of the possible costs, Thomas and Morris (2003) estimated the
economic cost of depression in England in 2000, taking account of the cost of treatment and the loss of output and mortality costs. They estimated the total cost of depression in England among adults over 15 years old in 2000 as £9 billion, and that there were an estimated 2.6 million cases of depression, giving a unit cost of nearly £3500 per case. The authors however acknowledge that this is likely to represent an underestimate of the total cost of depression, due to some elements of cost not being included due to lack of reliable data. If we had an indication of what the impact of cohesion is on the incidence of depression then these figures could be used to estimate the potential cost savings from reduced incidence of depression cases as a result of improving social cohesion. This would of course assume that people who suffer from depression as a result of living in uncohesive areas incur the same costs in terms of treatment and loss of output as the average person suffering from depression in England. It should be noted that depression is just one possible health outcome from low cohesion and that to estimate the potential health cost savings it would be necessary to look at the costs of other possible health outcomes.
Employment
This evidence therefore suggests that social networks can make it easier for individuals to find a job. Social networks may also help people to find better jobs by connecting them to high status individuals. Various papers find that weak ties, ties with acquaintances or friends of friends with whom the individual has little contact with are especially important in facilitating occupational mobility by putting people in contact with individuals from a different background to themselves. This is known as a form of bridging social network. For example, Lin et al (1981) found that the vast majority of weak ties connected respondents to high status individuals (76.2 per cent of weak ties for the first job were to informants of higher occupational status).
Education
Many of the studies on the relationship between social capital or social cohesion and education have tended to look at how education influences cohesion. Putnam, however, suggested that the relationship ran in both directions- social capital impacts on educational outcomes and that in turn education impacts on social capital. One way in which social capital may impact on education outcomes is through so called peer networks amongst students which can have a powerful affect on both the aspiration levels and on the
educational process itself. Another way in which this can have an impact is through greater parental involvement in their child’s educational success, which the evidence suggests can have a significant impact on educational outcomes. Statistical evidence presented by Putnam, as well as a number of other studies most of which are American, indicate that the attitudes and behaviour that parents and children bring to the educational process are more deeply and directly affected by the strength of community and family bonds than by the general socioeconomic or racial character of their communities. For example, Putnam (2002) suggested that test scores or drop out rates were better predicted by measures of community-based social capital than by measures of teacher quality or class size or spending per pupil.
If we had an indication of the impact which greater cohesion in an area might have on the educational outcomes of people living in that area, then these figures could be used to look at the potential benefits of improving cohesion on individuals’ educational outcomes. This is a difficult exercise given that cohesion both impacts on and is impacted by
educational outcomes.
Economic investment
We have been told that companies are more likely to invest in cohesive areas or that businesses are easier to run in cohesive areas. The importance of transport in business’
location decisions (DOT, 2004) suggested that “a ‘culture’ supporting ‘civicness’” and
“image and crime rates” were among the factors that a company would consider.
Conclusions
References for economic case of cohesion work
Allen, J. and Ruparel, C.(2006). Comparing BCS estimates and police counts of crime
2005/06, London: Home Office.
Bruhn, J.G and Wolf, S. (1979) Roseto, Pennsylvania, 25 years later – highlights of a medical and sociological survey, Totts Gap Medical Research Laboratories, Bangor, Pennsylvania.
Buonfino, A. and Hilder, P. (2006) Neighbouring in contemporary Britain: A Think-piece for
the Joseph Rowntree Foundation Housing and Neighbourhoods Committee , York: Joseph
Rowntree Foundation.
Commission on Integration and Cohesion (2007), Our Shared Future.
Dolan, P. and Peasgood, T. (2007) Estimating the economic and social costs of the fear of crime, British Journal of Criminology, 47: 121 – 132.
Duborg, R., Hamed, J. and Thorns, J. (2005) The Economic and Social costs of crime
against individuals and households 2003/04, Home Office Online Report 30/05, London:
Home Office.
Durkheim, E. (1897,1997) Suicide: a study in sociology, ed. Simpson, G. (tr.Spaulding, JA., and Simpson, G., 1951) New York: Free Press.
Ericksen, E. and Yancey, W. (1980) Class, Sector and Income Determination.
Unpublished manuscript, Temple University.
Hirschfield, A. and Bowers, K. J. (1997) The Effect of Social Cohesion on Levels of Recorded Crime in Disadvantaged Areas. Urban Studies. 34: 1275 – 1295.
Hunt, E. and McIntosh, S. (2007) Raising the Participation Age: An assessment of the
economic benefits, DCSFResearch Report DCSF-RW026.
Granovetter, M. (1973) The strength of weak ties, American Journal of Sociology, 6: 1360-1380.
Granovetter, M. (1995) Getting a Job: A study of contracts and careers, Cambridge, MA: Harvard University Press.
Kawachi, I. & Berkman, L. (eds) (2000) Social Epidemiology, New York: Oxford University Press.
Kawachi I, Kennedy B.(1997). Health and social cohesion: why care about income inequality? British Medical Journal , 314:1037-1040.
Kawachi, I., Kennedy , B., and Glass, R. (1999a) Social Capital and self rated health: a contextual analysis. American Journal of Public Health, 89:1187-1193.
Kawachi I, Subramanian, S. and Kim, D. (eds). (1999) Social capital and health, New York: Springer.
Kershaw, C., Nicholas, S. & Walker, A. (2008), Crime in England and Wales 2007/08: Findings from the British Crime Survey and police recorded crime, Home Office Statistical Bulletin. London: Home Office.
Laurence, A. and Heath, J. (2008) Predictors of community cohesion: Multi level modelling
of the 2005 Citizenship survey, London: Department for Communities and Local
Government.
Lin, N., Ensel, W., and Vaugh, J. (1981), Social Resources, Strength of Ties and Occupational Status Attainment. American Sociological Review 46(4): 393-405.
Putnam, R. (2000) Bowling Alone: The collapse and revival of American community, New York: Simon & Schuster
Putnam, R. (2002), Community-Based Social Capital and Educational Performance, in Ravitch, D. and Viteritti, J. (eds), Making Good Citizens:Education and Civil Society, New Haven: Yale University Press.
Sampson, R. and Groves, W. (1989) Community Structure and Crime:
Testing Social-Disorganization Theory. American Journal of Sociology, 94:774 – 802.
Sampson, R. and Raudenbush, S. (1999) Systematic Social Observation of Public Spaces: A New Look at Disorder in Urban Neighbourhoods. American Journal of Sociology, 105: 603 – 651.
Shaw, C. and McKay, H. (1942). Juvenile Delinquency and Urban Areas. Chicago: Univ. Press.
Thomas, C. and Morris, S. (2003) Costs of depression among adults in England in 2000,
The British Journal of Psychiatry ,183: 514-519
Wedlock, E. (2006), Crime and Cohesive Communities. Home Office Online
9 781409 817314