www.biogeosciences.net/14/1305/2017/ doi:10.5194/bg-14-1305-2017
© Author(s) 2017. CC Attribution 3.0 License.
Technical note: Coupling infrared gas analysis and cavity ring
down spectroscopy for autonomous, high-temporal-resolution
measurements of DIC and
δ
13
C–DIC
Mitchell Call1,3, Kai G. Schulz2, Matheus C. Carvalho2, Isaac R. Santos3, and Damien T. Maher1,3
1School of Environment, Science and Engineering, Southern Cross University, Lismore, NSW, 2480, Australia 2Centre for Coastal Biogeochemistry, School of Environment, Science and Engineering, Southern Cross University, Lismore, NSW, 2480, Australia
3National Marine Science Centre, School of Environment, Science and Engineering, Southern Cross University, Coffs Harbour, NSW, 2450, Australia
Correspondence to:Mitchell Call ([email protected]) Received: 21 November 2016 – Discussion started: 22 November 2016
Revised: 8 February 2017 – Accepted: 13 February 2017 – Published: 15 March 2017
Abstract.A new approach to autonomously determine con-centrations of dissolved inorganic carbon (DIC) and its car-bon stable isotope ratio (δ13C–DIC) at high temporal res-olution is presented. The simple method requires no cus-tomised design. Instead it uses two commercially available instruments currently used in aquatic carbon research. An inorganic carbon analyser utilising non-dispersive infrared detection (NDIR) is coupled to a Cavity Ring-down Spec-trometer (CRDS) to determine DIC andδ13C–DIC based on the liberated CO2from acidified aliquots of water. Using a small sample volume of 2 mL, the precision and accuracy of the new method was comparable to standard isotope ratio mass spectrometry (IRMS) methods. The system achieved a sampling resolution of 16 min, with a DIC precision of ±1.5 to 2 µmol kg−1 andδ13C–DIC precision of ±0.14 ‰ for concentrations spanning 1000 to 3600 µmol kg−1. Accu-racy of 0.1±0.06 ‰ for δ13C–DIC based on DIC concen-trations ranging from 2000 to 2230 µmol kg−1was achieved during a laboratory-based algal bloom experiment. The high precision data that can be autonomously obtained by the sys-tem should enable complex carbonate syssys-tem questions to be explored in aquatic sciences using high-temporal-resolution observations.
1 Introduction
Dissolved inorganic carbon (DIC) is an important compo-nent of the evolving global carbon cycle, with ∼26 % of yearly anthropogenic carbon dioxide (CO2)emissions stored as DIC in the global ocean (Le Quéré et al., 2015). This in-flux of carbon to the oceans has resulted in increased field-monitoring (Sabine et al., 2010), laboratory-based experi-ments of how changing seawater carbonate chemistry af-fects biological processes (Gattuso and Hansson, 2011), and the development of new measurement technologies (Byrne, 2014; Martz et al., 2015). Currently, the spatial and tem-poral coverage of paired DIC and carbon stable isotope ra-tio (δ13C–DIC) measurements is poor (Becker et al., 2016). However, greater interest is being placed on the coupled high-resolution measurement of DIC andδ13C–DIC as it can provide insights into the processes controlling DIC concen-trations, helping elucidate flows of carbon within and be-tween reservoirs (Bass et al., 2014b).
accu-racy (Li and Liu, 2011; Taipale and Sonninen, 2009). Fur-thermore, the laborious process limits sampling frequency, often restricting temporal and spatial coverage of coupled DIC andδ13C–DIC measurements.
High-resolution, field-based measurement of CO2 and its carbon stable isotope value (δ13C-CO2) is now achiev-able via laser spectroscopy systems such as Cavity Ring-Down Spectrometers (CRDSs) (Crosson, 2008) and Off-Axis Integrated Cavity Output Spectroscopy (OA-ICOS) (Baer et al., 2002), with precision and accuracy comparable to laboratory-based IRMS (Vogel et al., 2013; Berryman et al., 2011; Midwood and Millard, 2011). The use of CRDSs in the aquatic environment is becoming more prevalent with CRDSs successfully coupled to air-water equilibrators for on-site, high-resolution measurement of dissolved CO2and its isotopic composition (Maher et al., 2013b; Becker et al., 2012). Recently, Bass et al. (2012) coupled a CRDS to a customised acidification interface utilising expanded polytetrafluoroethylene (ePTFE) tubing to measure in situ concentrations of DIC and its δ13C–DIC. The permeable-membrane-based equilibration system autonomously mea-sured DIC and δ13C–DIC at 15 min intervals to a precision of±10 µmol kg−1 and±0.2 ‰ respectively, and has been shown to be sufficient for identifying spatial and short-term temporal variability in DIC concentrations in a variety of aquatic systems (Bass et al., 2013, 2014a, b). However, a precision of ∼2 µmol kg−1or better is required in order to assess other processes such as long-term anthropogenically induced changes to oceanic carbon chemistry (Newton et al., 2014) or in laboratory-based experiments when trying to de-tect small changes in DIC.
This paper presents an alternative approach to au-tonomously determine concentrations of DIC andδ13C–DIC. The simple method does not require the need to design or replicate a customised system. Instead, it couples two com-mercially available instruments, an inorganic carbon anal-yser utilising non-dispersive infrared detection (NDIR) and a CRDS. The system can be automated, is low maintenance, and achieves a sampling resolution of∼16 min. Using only a small sample volume (2 mL), the method achieves high precision and accuracy comparable to traditional IRMS tech-niques.
2 Materials and procedures
2.1 Approach
Two commercially available instruments, an Autonomous Infra Red Inorganic Carbon Analyser (AIRICA, Marianda Company, Kiel, Germany) and a CRDS (Picarro G2201-i, Picarro Inc., Santa Clara, CA, USA), were coupled in or-der to autonomously measure concentrations of DIC and its
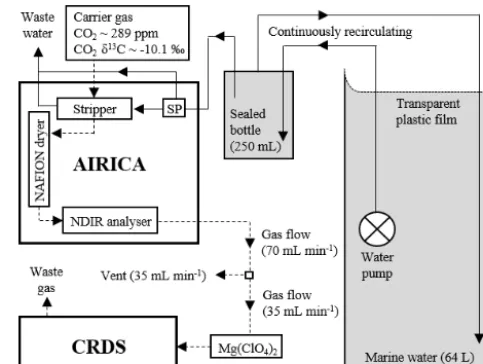
[image:2.612.307.549.66.248.2]δ13C–DIC ratio based on the CO2extracted from acidified samples (Fig. 1). These instruments offer high precision and
Figure 1.Schematic of the coupled Autonomous Infra Red Inor-ganic Carbon Analyser (AIRICA) and Cavity Ring Down Spec-trometer (CRDS) set up to autonomously and continuously measure DIC concentrations andδ13C-DIC values. Solid arrows indicate liq-uid flow and dashed arrows indicate gas flow. SP=syringe pump.
accuracy, and are currently used in aquatic carbon research. To test the response of the method, here-in termed AIRICA– CRDS, laboratory-based experiments on precision were con-ducted as well as a mesocosm experiment simulating an algal bloom in coastal waters.
2.2 Instrumentation
from the CO2 extracted from a small sample (2 mL), the background CO2enables accurate measurement of aδ13C– CO2over a greater proportion of the integration period (dis-cussed below).
The CRDS uses a laser-based spectroscopic technique that measures the individual carbon isotopologues (12C and13C) of CO2at∼1 Hz and converts to standard δ13C (‰) nota-tion (referenced to Vienna PeeDee Belemnite). When the in-strument is set in the CO2-isotope-only operating mode as used in this experiment (the CRDS can also simultaneously determine the carbon stable isotope ratio of methane), the guaranteed precision of the instrument by the manufacturer is 0.05 % for the CO2 concentration (ppm) and 0.12 ‰ for
δ13C (1σ, 5 min average) spanning 380 to 2000 ppm.δ13C– DIC was determined using theδ13C values of the extracted CO2measured during the integration period (see Sect. 2.4).
The coupling of the two instruments was achieved by sim-ply linking the outlet of the AIRICA’s NDIR analyser with the inlet of the CRDS using polyethylene lined Bev-A-Line® IV (1/800 ID, 1/400 OD) tubing (Fig. 1). A vent ensured no pressure build-up at the inlet of the CRDS or back pressure on the AIRICA as the gas flow rate for the AIRICA var-ied from 70 to 300 mL min−1(discussed below), while the CRDS has a flow rate of∼35 mL min−1. An additional dry-ing agent (magnesium perchlorate) was used to dry the gas stream prior to entering the CRDS to minimise any potential artefacts in isotope values introduced by uncertainties in the manufacturers’ in-built water-vapour corrections (Nara et al., 2012). Magnesium perchlorate was used as it does not induce a delay in CO2response time as is the case with some other desiccants (e.g. Drierite) (Webb et al., 2016).
To maximise precision and accuracy, DIC andδ13C–DIC were determined from separate injections. The measurement parameters were customised for each analysis such that the integration period for DIC andδ13C–DIC were 100 and 310 s respectively. Therefore, in order to achieve autonomous mea-surement of DIC andδ13C–DIC, a computer script using Au-toIt (Carvalho, 2017) was developed to autonomously mod-ify the AIRICA’s operating parameters at pre-determined time intervals without the need for an operator (the computer script is supplied as Supplement). The script was sequenced so that a single measurement cycle consisted of the AIRICA system acidifying three aliquots of sample. The first aliquot was used to flush the system, the second aliquot was to termine DIC concentration, and the third aliquot was to de-termineδ13C–DIC. The system was flushed with carrier gas between each aliquot to remove the excess CO2 and return to carrier gas concentrations. The cycle was then repeated, achieving a DIC andδ13C-DIC measurement, on average, ev-ery∼16 min (refer to Supplement Fig. S1 for a depiction of the typical CRDS output for a single measurement cycle).
2.3 Procedure
To determine DIC, the AIRICA’s syringe pump was rinsed twice with 2100 µL of sample (filled and emptied at 300 µL s−1), with the first rinse going directly to waste and the second rinse wasted via the stripper (Fig. 1). The syringe pump then drew 2000 µL of sample at 200 µL s−1which was then injected at 80 µL s−1 into the stripper, to which two drops of 10 % H3PO4 had been added. With a carrier gas flow rate through the stripper set a 300 mL min−1, DIC con-centrations were determined from integrating the CO2 mix-ing ratio signal in the LI-COR durmix-ing an integration period of 100 s. The system was then flushed with carrier gas at 150 mL min−1 to purge the liberated CO2 from the system and return to carrier gas values prior toδ13C–DIC sampling. Sampling volume forδ13C–DIC was the same as for DIC; however, to obtain a longer integration period the follow-ing AIRICA parameters were adjusted: the rate the sam-ple was injected from the syringe pump to the stripper (i.e. injection rate) was reduced to 15 µL s−1 (from 80 µL s−1), the carrier gas flow rate through the stripper was reduced to 70 mL min−1 (from 300 mL min−1), and the integration pe-riod was increased to 310 s (from 100 s).δ13C–DIC was de-termined from theδ13C–CO2data measured at∼1 Hz dur-ing the integration period (discussed below). After the sam-pling forδ13C–DIC was completed, the cycle was restarted autonomously using the custom AutoIt script.
2.4 Determination ofδ13C-DIC
Theδ13C–CO2of the gas stream is a function of the carrier gas and that of the liberated CO2from the acidified sample (Eq. 1):
δ13Ctotal=δ13Ccarrier×fCO2 carrier
+δ13Csample×fCO2 sample, (1) whereby
fCO2 carrier=CO2 carrier/CO2 total
fCO2 sample=CO2 sample/CO2 total CO2 sample=CO2 total−CO2 carrier,
whereδ13Ctotalis theδ13C–CO2of the measured gas stream CO2(‰),δ13Ccarrieris theδ13C–CO2of the carrier gas CO2 (‰), CO2 carrier is the 12+13CO2 concentration of the car-rier gas (ppm),δ13Csample is theδ13C–CO2of the acidified sample (‰), CO2 sampleis the12+13CO2concentration of the acidified sample (ppm), and CO2 total is the12+13CO2 con-centration of the measured gas stream (ppm).
sampleδ13C–CO2(i.e.δ13Csample)value based on each mea-sured CO2concentration (Eq. 2):
δ13Csample= h
δ13Ctotal×CO2 total
−δ13Ccarrier×CO2 carrier i
/
(CO2 total−CO2 carrier) , (2) Five iterations of outlier removal were conducted on the∼1 Hz δ13Csamplevalues, with removal of values with an abso-lute difference (versus the mean of allδ13Csamplevalues for the sample) greater than two times the standard deviation of the sample. The remaining δ13Csample values were then av-eraged to determine the finalδ13C–DIC value of the sample. All analysis was undertaken using Matlab (The Mathworks Inc., Natick, MA, USA) (see supplementary information for script).
2.5 Evaluation of precision and accuracy
δ13C–DIC standards were made using Na2CO3 for the iso-topically heavy standard (−3.2±0.1 ‰) and K2CO3for the depleted standard (−26.8±0.1 ‰), with both solids ver-ified by IRMS using the international reference materi-als NBS-19 and LSVEC. The Na2CO3 solid was used to make a set of five standard solutions ranging from ∼500 to ∼3600 µmol kg−1 and one standard solution was made using the K2CO3 solid (∼2000 µmol kg−1). All standards were made by dissolving carbonate solids in ultra-pure wa-ter (18.2 Milli-Q®). Precision was evaluated based on the standard deviation of at least six replicate measurements for each standard. Accuracy was tested by comparing AIRICA– CRDSδ13C–DIC values to IRMS-measured values from dis-crete samples collected during the bloom experiment (be-low). Both the precision measurements and bloom experi-ments were undertaken in a temperature-controlled labora-tory with temperature varying by < 2◦C over the course of the experiments.
2.6 Algal bloom experiment
An algal bloom experiment was conducted to test the re-sponse of the method (Fig. 1) over an∼8-day period. Sea-water (salinity 35.690) was collected from a nearby beach (28◦49022.0100S, 153◦36023.4800E) the morning the experi-ment commenced (9 January 2016). The water was enriched with 64 µmol L−1 each of nitrate (NO−
3) and orthosilicate (SiO44−), and 4 µmol L−1of orthophosphate (PO34−). In order to counteract the impact of the SiO44−addition on total alka-linity, 128 µmol L−1of hydrochloric acid (HCl) was added. The mesocosm was incubated under high-pressure sodium bulbs (400W Phillips Son T Agro) at ∼200 µmol m−2s−1 for 18 h per day (12:00 local time (LT) to 06:00 LT). The surface of the incubation vessel was covered with a trans-parent sheet of plastic film to inhibit evaporation and CO2
exchange with the atmosphere, allowing for an interpreta-tion of the results in terms of a closed system. Macroalgae (Ulvasp.) and an additional dose of nutrients were added to the sample water on the 25 January 2016 (10:00 LT) to fur-ther enhance biological activity. To achieve unattended sam-pling, incubated water was continuously recirculated through a sealed Schott bottle (250 mL) at∼1 L min−1, from where the AIRICA’s high-precision syringe pump drew the sample (Fig. 1). DIC andδ13C–DIC were sampled autonomously ac-cording to the procedure outlined above. In order to eval-uate the accuracy of the AIRICA–CRDS method, 19 dis-crete samples forδ13C–DIC were collected throughout the bloom experiment for IRMS analysis. The samples were gen-erally collected at the start and end of the light period from the return line of the recirculating system into 40 mL pre-combusted borosilicate vials, closed without headspace by Teflon-lined septa screw caps, poisoned with 50 µL of sat-urated HgCl2solution and stored at ∼4◦C in the dark un-til analysis (within 1 week). The samples were also anal-ysed forδ13C–DOC to determine the isotopic composition of the carbon pool available for microbial respiration. Sam-ples were analysed using an OI Aurora 1030W TOC analyser interfaced to a Thermo DeltaVPlusIsotope Ratio Mass Spec-trometer (Maher and Eyre, 2011). Precision ofδ13C–DIC and
δ13C–DOC IRMS measurements were±0.1 ‰ and±0.3 ‰ respectively. Samples for DOC concentration were analysed using a Shimadzu (TOC-VCPH) analyser. Particulate organic carbon (POC, mostly representing phytoplankton) was sam-pled at the end of the experiment by filtering 150 mL of the incubated water through pre-combusted Whatman (GF/F) fil-ters and dried (60◦C) before analysis. Macroalgae was sam-pled at the end of the experiment, dried (60◦C) and ground prior to analysis. Theδ13C values of the macroalgae and the POC were measured in triplicate samples using a Thermo Flash elemental analyser coupled to a Delta Vplus IRMS (±0.1 ‰). Allδ13C values are reported based on the VPDB scale.
3 Results and discussion
3.1 Precision
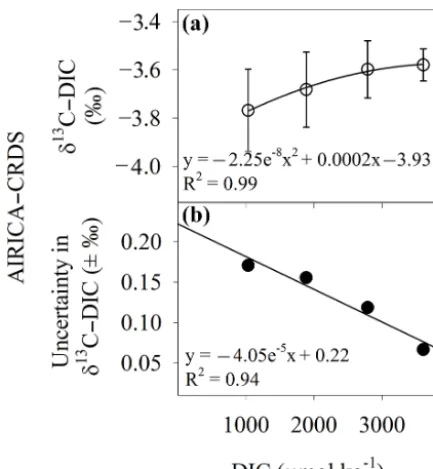
Figure 2. (a)Concentration effect onδ13C-DIC data produced by the AIRICA–CRDS.(b)Uncertainty inδ13C-DIC versus DIC con-centration.
to 2100 µmol kg−1and did not correctδ13C–DIC values as the observed effect was within the precision of internal cali-bration standards.
The AIRICA–CRDS method had decreasing δ13C–DIC uncertainty with higher DIC concentrations (Fig. 2b). Stan-dard deviations of the isotopically heavy stanStan-dards de-creased from ±0.17 ‰ at ∼1000 µmol kg−1 (n=6) to ±0.07 ‰ at ∼3600 µmol kg−1 (n=8); however, below 1000 µmol kg−1 standard deviations were relatively high (±0.63 ‰ at 500 µmol kg−1, n=6). For the isotopically lighter standard, the uncertainty was±0.17 ‰ at a DIC con-centration of∼2000 µmol kg−1(Supplement Table S1). Bass et al. (2012) also reported decreasing uncertainty with in-creasing concentrations of DIC. Their membrane-based equi-libration system attained standard deviations <±0.2 ‰ for concentrations above 360 µmol kg−1 using a sample vol-ume of 350 mL and an equilibration time of 720 s. In com-parison, AIRICA–CRDS achieved <±0.2 ‰ uncertainty at ∼1000 µmol kg−1on a sample volume of 2 mL and an inte-gration time of 310 s.
[image:5.612.316.535.62.233.2]To achieve the manufacturer-guaranteed specifications of ±0.12 ‰δ13C–CO2, CO2concentrations in the gas stream, which is a sum of the CO2in the carrier gas and the liber-ated CO2from the acidified sample, should be between 380 and 2000 ppm. The concentration of the liberated CO2is a function of the sample size, the injection rate, and the gas flow rate, each of which can be independently adjusted by the user through the AIRICA software. Forδ13C-DIC mea-surements, the 2 mL of sample was injected into the strip-per at 15 µL s−1 and extracted with a carrier gas flow rate
Figure 3.Comparison of AIRICA-CRDSδ13C-DIC versus IRMS δ13C-DIC.
of 70 mL min−1 (achieving a total measurement time of 310 s), resulting in the AIRICA–CRDS achieving an average precision of 0.14±0.04 ‰ (n=84) for all standards above 1000 µmol kg−1. While we optimised the system for coastal and oceanic DIC concentrations, if sampling low-DIC con-centrations (i.e. < 1000 µmol kg−1), similarly preciseδ13C– DIC values may be achievable if, for example, a larger sy-ringe volume is used to increase sample size. This ability for customisation adds to the functionality of the AIRICA– CRDS system. In comparison to the AIRICA–CRDS re-ported here, a worldwide proficiency test ofδ13C–DIC anal-ysis found laboratory precision ranged from 0.1 to 0.5 ‰ depending on different methodologies (Van Geldern et al., 2013). However, the inter-laboratory results revealed aver-age standard deviations of ±0.45 and ±0.47 ‰ for δ13C– DIC values for lake water and seawater measurements re-spectively.
3.2 Accuracy
Accuracy of the AIRICA–CRDSδ13C–DIC was determined by direct comparison with IRMS measurements collected si-multaneously during the algal bloom experiment (Fig. 3). The average difference in measured δ13C values between methods was 0.1±0.06 ‰, which is similar to the accuracy of the IRMS (0.1 ‰). This robust relationship was based on DIC concentrations ranging from 1986 to 2232 µmol kg−1 (average 2129 µmol kg−1)during the dynamic bloom experi-ment. This demonstrates that the automated AIRICA–CRDS system described here attains similar accuracy to IRMS
δ13C–DIC measurements at typical coastal and oceanic DIC concentrations.
3.3 Bloom experiment
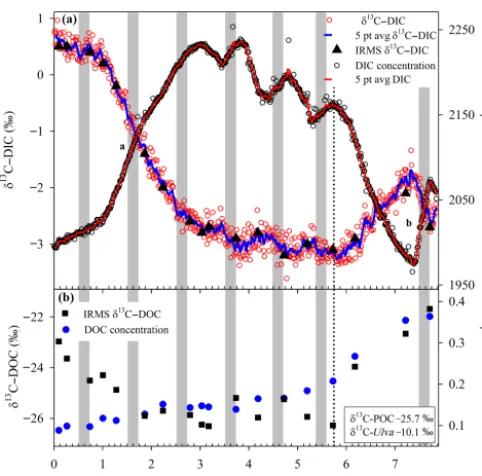
[image:5.612.59.276.64.299.2]Figure 4. (a)δ13C-DIC values and DIC concentrations measured by the AIRICA–CRDS system during the∼8-day laboratory bloom experiment. Blue and red lines are 5-point averages forδ13C-DIC and DIC respectively. Black triangles are discrete IRMSδ13C-DIC values plotted for comparison. Shaded areas indicate dark incuba-tions. Lower-case letters indicate the sections used for Keeling plots (see Fig. S2). Dotted line shows when macroalgae (Ulvasp.) and additional nutrients were added.(b)IRMSδ13C-DOC values and DOC concentrations for discrete samples. Inset box displays IRMS δ13C values for POC andUlvasp.
marine environment is demonstrated by the algal bloom ex-periment (Fig. 4a). A total of 664 DIC concentrations and 661 δ13C–DIC values were autonomously measured during the∼8-day incubation. Concentrations of DIC ranged from 1965 to 2253 µmol kg−1andδ13C–DIC ranged from 0.96 to −3.61 ‰.
The AIRICA–CRDS method captured a temporally in-verse relationship betweenδ13C–DIC values and DIC con-centrations throughout the algal bloom experiment. During the first 3 days, respiration was the dominant metabolic pro-cess releasing isotopically lighter DIC (originating from or-ganic matter). Respiration increased the pool of DIC from ∼1995 to ∼2230 µmol kg−1 and simultaneously lowered
[image:6.612.48.289.63.301.2]δ13C–DIC from∼0.7 to∼ −2.7 ‰. After 3 days, diel cy-cling (light–dark) of DIC andδ13C–DIC commenced, likely due to the time lag associated with primary producer biomass increase after the initial addition of nutrients. During day-light hours, photosynthetic production preferentially con-sumed the isotopically lighter12CO2component of the DIC pool, decreasing DIC concentrations and increasing δ13 C-DIC values. Conversely, during the dark hours, respiration in-creased DIC concentrations and dein-creasedδ13C–DIC values. Over the course of days 4, 5, and 6, overall net production
Figure 5.Relationship between Keeling intercept uncertainty and changes in DIC concentration. Higher changes in DIC resulted in lower uncertainties in Keeling plot interpretations.
drew down the DIC pool. On day 7 no dark incubation oc-curred resulting in a large photosynthetically driven decrease in the DIC concentration from 2164 to 1965 µmol kg−1and an increase ofδ13C-DIC from∼ −3.1 to∼ −1.7 ‰. Simi-lar diel variations were observed for DIC andδ13C–DIC in a mesocosm coral reef metabolism experiment (Bass et al., 2012).
3.4 Insights from high resolution DIC andδ13C-DIC
measurements
The AIRICA–CRDS’s high resolution measurements of
δ13C–DIC can provide insights into drivers of DIC in aquatic environments. To illustrate a potential application of the AIRICA–CRDS approach, Keeling plots are used to inter-pret carbon sources during a simulated algal bloom experi-ment. Keeling plots (Keeling, 1958) visualise a simple two-component mixing model and are commonly used to inter-pret sources of added carbon in aquatic, terrestrial, and at-mospheric sciences (see Pataki et al., 2003 for details on un-derlying assumptions and types of regression models avail-able). Using a Model II regression (which assumes errors in the measurement of both variables), the y-intercept of the re-gression between the inverse of DIC concentration (1/DIC) andδ13C–DIC estimates the isotopic composition of the car-bon source. The approach has been used to determine the isotopic composition of the DIC source in various settings including freshwater lakes (Karlsson et al., 2007), coral reefs (Carvalho et al., 2015), mangroves (Maher et al., 2013a), and groundwaters (Porowska, 2015).
[image:6.612.321.525.65.213.2]references therein for regression formulations). Uncertainty decreased as the absolute change in DIC increased, achieving < 2 ‰ uncertainty when the change in DIC was greater than ∼40 µmol kg−1(Fig. 5). It is noted that the intercept uncer-tainty is much higher than the unceruncer-tainty for eachδ13C-DIC and DIC value (±0.14 ‰ and ±1.5 to 2 µmol kg−1 respec-tively). A Keeling plot, based on DIC concentrations during dark incubation periods over the first 3 days (Fig. S2a), pro-duced aδ13C–DIC intercept value of−27.8±1.2 ‰, which is similar to that of terrestrial C3 vegetation (Smith and Ep-stein, 1971). In contrast, the δ13C–DIC intercept value for the final dark incubation of−17.4±0.9 ‰ (Fig. S2b) is sim-ilar to that of marine organic matter (OM). Thus, results sug-gest a distinct shift in the source of DIC during the course of the experiment, from terrestrially derived OM present in the sampled coastal seawater to marine-derived OM at the end. This is likely due to a shift towards a dominance of marine organic matter toward the end of the experiment as a result of the algal bloom and the added macroalgae (added on day 6, Fig. 4).
The DOC results support our interpretation of a shift in the DIC source. DOC concentrations increased from 88 µmol kg−1 at the beginning of the experiment to 364 µmol kg−1at the end.δ13C-DOC values decreased ing the first 3 days of the experiment before increasing dur-ing the final∼2 days. Keeling plot intercepts based on DOC concentrations for the initial∼3 day period (−31.8±1.5 ‰) and final ∼2-day period (−17.6±2 ‰) suggest a distinct shift in the carbon source contributing to the DOC pool from a terrestrially derived DOC source to a marine source. This is consistent with the shift observed in the DIC pool. The IRMSδ13C–POC results for phytoplankton (−25.7 ‰) and macroalgae (i.e.Ulvasp.,−10.1 ‰) suggests a similar con-tribution of both sources to the final δ13C–DOC intercept value of−17.6 ‰ and theδ13C–DIC value of−17.4 ‰. The AIRICA–CRDS system could similarly be used to charac-terise the importance of various other processes, such as the relative importance of organic matter respiration versus car-bonate dissolution as a source of DIC from coastal systems (Carvalho et al., 2015) and the importance of allochthonous versus autochthonous organic matter for supporting bacterial productivity (Guillemette et al., 2013).
4 Comments
The utility of the AIRICA–CRDS method for autonomous, high-resolution measurements of DIC and δ13C–DIC in a laboratory configuration has been demonstrated. Yet, the simple system also has the capacity for field deployment. Both of the commercially available instruments (coupled without any modifications to their hardware) have been used in field-based studies. CRDSs have been deployed in a range of environmental settings including large research vessels (Bass et al., 2014b; Becker et al., 2012), vehicles (Maher et
al., 2014), and small boats (Maher et al., 2015). Determi-nation of DIC based on the NDIR gas analysis method has been used to conduct continuous shipboard measurements (Friederich et al., 2002; Hiscock and Millero, 2005), and the AIRICA system has been deployed on research vessels to de-termine concentrations of DIC from discrete samples (Balch et al., 2016; Bates et al., 2013, 2014). Assuming access to an appropriate power source and suitable environmental condi-tions to house the instruments, the AIRICA–CRDS system has potential to be deployed in the field; however, further testing is required to test this capability.
The AIRICA–CRDS is an alternative system that en-ables autonomous, high-resolution measurements of DIC andδ13C–DIC with precision and accuracy comparable to traditional IRMS techniques. In the described configura-tion, the system achieved a sampling resolution of 16 mins, with a DIC precision of±1.5–2 µmol kg−1 andδ13C-DIC precision of ±0.14 ‰ for concentrations spanning 1000 to 3600 µmol kg−1. A change in DIC concentrations of ∼40 µmol kg−1was sufficient to obtain a precision of < 2 ‰ in source interpretations based on Keeling plots. Whilst we optimized the system for typical estuarine or marine DIC concentrations, the system has the potential to be optimised for other environments through changes to the syringe size, sample volume, and injection speed. This ability for customi-sation adds to the functionality of the AIRICA–CRDS tem, offering the potential to explore complex carbonate sys-tem questions across a range of aquatic settings.
Information about the Supplement
The Supplement includes the AutoIt script, Matlab script, and Supplement figures and tables.
The Supplement related to this article is available online at doi:10.5194/bg-14-1305-2017-supplement.
Author contributions. Damien T. Maher, Kai G. Schulz, and Isaac R. Santos designed the study. Damien T. Maher, Kai G. Schulz, and Mitchell Call conducted the experiments. Matheus C. Carvalho developed the Autolt script and analysed all discrete samples. Kai G. Schulz developed the Matlab Scripts. Mitchell Call prepared the manuscript with contributions from all authors.
Competing interests. The authors declare that they have no conflict of interest.
Edited by: J. Middelburg
Reviewed by: N. Munksgaard and one anonymous referee
References
Baer, D. S., Paul, J. B., Gupta, M., and O’Keefe, A.: Sensitive ab-sorption measurements in the near-infrared region using off-axis integrated-cavity-output spectroscopy, Appl. Phys. B, 75, 261– 265, doi:10.1007/s00340-002-0971-z, 2002.
Balch, W. M., Bates, N. R., Lam, P. J., Twining, B. S., Rosen-gard, S. Z., Bowler, B. C., Drapeau, D. T., Garley, R., Lubel-czyk, L. C., Mitchell, C., and Rauschenberg, S.: Factors regulat-ing the Great Calcite Belt in the Southern Ocean and its biogeo-chemical significance, Global Biogeochem. Cy., 30, 1124–1144, doi:10.1002/2016GB005414, 2016.
Bandstra, L., Hales, B., and Takahashi, T.: High-frequency measurements of total CO2: Method development and first oceanographic observations, Mar. Chem., 100, 24–38, doi:10.1016/j.marchem.2005.10.009, 2006.
Bass, A. M., Bird, M. I., Munksgaard, N. C., and Wurster, C. M.: ISO-CADICA: Isotopic – continuous, automated dissolved inor-ganic carbon analyser, Rapid Commun. Mass Sp., 26, 639–644, doi:10.1002/rcm.6143, 2012.
Bass, A. M., O’ Grady, D., Berkin, C., Leblanc, M., Tweed, S., Nelson, P. N., and Bird, M. I.: High diurnal variation in dis-solved inorganic C,δ13C values and surface efflux of CO2in a seasonal tropical floodplain, Environ. Chem. Lett., 11, 399–405, doi:10.1007/s10311-013-0421-7, 2013.
Bass, A. M., Munksgaard, N. C., Leblanc, M., Tweed, S., and Bird, M. I.: Contrasting carbon export dynamics of human impacted and pristine tropical catchments in response to a short-lived discharge event, Hydrol. Proc., 28, 1835–1843, doi:10.1002/hyp.9716, 2014a.
Bass, A. M., Munksgaard, N. C., O’Grady, D., Williams, M. J. M., Bostock, H. C., Rintoul, S. R., and Bird, M. I.: Continu-ous shipboard measurements of oceanicδ18O,δD andδ13CDIC along a transect from New Zealand to Antarctica using cav-ity ring-down isotope spectrometry, J. Mar. Syst., 137, 21–27, doi:10.1016/j.jmarsys.2014.04.003, 2014b.
Bates, N. R., Orchowska, M. I., Garley, R., and Mathis, J. T.: Sum-mertime calcium carbonate undersaturation in shelf waters of the western Arctic Ocean: how biological processes exacerbate the impact of ocean acidification, Biogeosciences, 10, 5281–5309, doi:10.5194/bg-10-5281-2013, 2013.
Bates, N. R., Garley, R., Frey, K. E., Shake, K. L., and Mathis, J. T.: Sea-ice melt CO2–carbonate chemistry in the western Arc-tic Ocean: meltwater contributions to air–sea CO2gas exchange, mixed-layer properties and rates of net community production under sea ice, Biogeosciences, 11, 6769–6789, doi:10.5194/bg-11-6769-2014, 2014.
Becker, M., Andersen, N., Fiedler, B., Fietzek, P., Körtzinger, A., Steinhoff, T., and Friedrichs, G.: Using cavity ringdown spec-troscopy for continuous monitoring of δ13C(CO2)and fCO2 in the surface ocean, Limnol. Oceanogr.-Meth., 10, 752–766, doi:10.4319/lom.2012.10.752, 2012.
Becker, M., Andersen, N., Erlenkeuser, H., Humphreys, M. P., Tan-hua, T., and Körtzinger, A.: An internally consistent dataset of
δ13C-DIC in the North Atlantic Ocean – NAC13v1, Earth Syst. Sci. Data, 8, 559–570, doi:10.5194/essd-8-559-2016, 2016. Berryman, E. M., Marshall, J. D., Rahn, T., Cook, S. P., and
Lit-vak, M.: Adaptation of continuous-flow cavity ring-down spec-troscopy for batch analysis ofδ13C of CO2and comparison with isotope ratio mass spectrometry, Rapid Commun. Mass Sp., 25, 2355–2360, 2011.
Byrne, R. H.: Measuring Ocean Acidification: New Technology for a New Era of Ocean Chemistry, Environ. Sci. Technol., 48, 5352– 5360, doi:10.1021/es405819p, 2014.
Carvalho, M. C., Santos, I. R., Maher, D. T., Cyronak, T., McMa-hon, A., Schulz, K. G., and Eyre, B. D.: Drivers of carbon iso-topic fractionation in a coral reef lagoon: Predominance of de-mand over supply, Geochim. Cosmochim. Ac., 153, 105–115, doi:10.1016/j.gca.2015.01.012, 2015.
Carvalho, M. C.: Practical Laboratory Automation Made Easy with AutoIt, Wiley-VCH, Weinheim, 290 pp., 2017.
Crosson, E. R.: A cavity ring-down analyzer for measuring atmo-spheric levels of methane, carbon dioxide, and water vapor, Appl. Phys. B, 92, 403–408, doi:10.1007/s00340-008-3135-y, 2008. Fassbender, A. J., Sabine, C. L., Lawrence-Slavas, N., De Carlo,
E. H., Meinig, C., and Maenner Jones, S.: Robust Sensor for Extended Autonomous Measurements of Surface Ocean Dis-solved Inorganic Carbon, Environ. Sci. Technol., 49, 3628–3635, doi:10.1021/es5047183, 2015.
Friederich, G. E., Walz, P. M., Burczynski, M. G., and Chavez, F. P.: Inorganic carbon in the central California upwelling system during the 1997–1999 El Niño–La Niña event, Prog. Oceanogr., 54, 185–203, doi:10.1016/S0079-6611(02)00049-6, 2002. Fry, B. and Sherr, E. B.: δ13C Measurements as Indicators of
Carbon Flow in Marine and Freshwater Ecosystems, in: Sta-ble Isotopes in Ecological Research, edited by: Rundel, P. W., Ehleringer, J. R., and Nagy, K. A., Springer New York, New York, NY, 196–229, 1989.
Gattuso, J.-P. and Hansson, L.: Ocean acidification: background and history, in: Ocean Acidification, edited by: Hansson, L. and Gat-tuso, J.-P., Oxford University Press, 1–20, 2011.
Goyet, C. and Snover, A. K.: High-accuracy measurements of total dissolved inorganic carbon in the ocean: comparison of alternate detection methods, Mar. Chem., 44, 235–242, doi:10.1016/0304-4203(93)90205-3, 1993.
Guillemette, F., McCallister, S. L., and del Giorgio, P. A.: Dif-ferentiating the degradation dynamics of algal and terres-trial carbon within complex natural dissolved organic carbon in temperate lakes, J. Geophys. Res.-Biogeo., 118, 963–973, doi:10.1002/jgrg.20077, 2013.
Hiscock, W. T. and Millero, F. J.: Nutrient and carbon parameters during the Southern Ocean iron experiment (SOFeX), Deep-Sea Res. Pt. I, 52, 2086–2108, doi:10.1016/j.dsr.2005.06.010, 2005. Huang, K., Cassar, N., Jonsson, B., Cai, W.-j., and Bender, M.
L.: An Ultrahigh Precision, High-Frequency Dissolved Inor-ganic Carbon Analyzer Based on Dual Isotope Dilution and Cav-ity Ring-Down Spectroscopy, Environ. Sci. Technol., 49, 8602– 8610, doi:10.1021/acs.est.5b01036, 2015.
Keeling, C. D.: The concentration and isotopic abundances of at-mospheric carbon dioxide in rural areas, Geochim. Cosmochim. Ac., 13, 322–334, doi:10.1016/0016-7037(58)90033-4, 1958. Le Quéré, C., Moriarty, R., Andrew, R. M., Canadell, J. G., Sitch, S.,
Korsbakken, J. I., Friedlingstein, P., Peters, G. P., Andres, R. J., Boden, T. A., Houghton, R. A., House, J. I., Keeling, R. F., Tans, P., Arneth, A., Bakker, D. C. E., Barbero, L., Bopp, L., Chang, J., Chevallier, F., Chini, L. P., Ciais, P., Fader, M., Feely, R. A., Gkritzalis, T., Harris, I., Hauck, J., Ilyina, T., Jain, A. K., Kato, E., Kitidis, V., Klein Goldewijk, K., Koven, C., Landschützer, P., Lauvset, S. K., Lefèvre, N., Lenton, A., Lima, I. D., Metzl, N., Millero, F., Munro, D. R., Murata, A., S. Nabel, J. E. M., Nakaoka, S., Nojiri, Y., O’Brien, K., Olsen, A., Ono, T., Pérez, F. F., Pfeil, B., Pierrot, D., Poulter, B., Rehder, G., Rödenbeck, C., Saito, S., Schuster, U., Schwinger, J., Séférian, R., Steinhoff, T., Stocker, B. D., Sutton, A. J., Takahashi, T., Tilbrook, B., Van Der Laan-Luijkx, I. T., Van Der Werf, G. R., Van Heuven, S., Vandemark, D., Viovy, N., Wiltshire, A., Zaehle, S., and Zeng, N.: Global Carbon Budget 2015, Earth Syst. Sci. Data, 7, 349– 396, doi:10.5194/essd-7-349-2015, 2015.
Li, X. and Liu, W.: Effect of preservation on the delta 13C value of dissolved inorganic carbon in different types of water samples, Isot. Environ. Healt. S., 47, 379–389, doi:10.1080/10256016.2011.598934, 2011.
Liu, X., Byrne, R. H., Adornato, L., Yates, K. K., Kaltenbacher, E., Ding, X., and Yang, B.: In Situ Spectrophotometric Measure-ment of Dissolved Inorganic Carbon in Seawater, Environ. Sci. Technol., 47, 11106–11114, doi:10.1021/es4014807, 2013. Maher, D. and Eyre, B. D.: Insights into estuarine benthic
dissolved organic carbon (DOC) dynamics using δ13C-DOC values, phospholipid fatty acids and dissolved organic nu-trient fluxes, Geochim. Cosmochim. Ac., 75, 1889–1902, doi:10.1016/j.gca.2011.01.007, 2011.
Maher, D. T., Santos, I. R., Golsby-Smith, L., Gleeson, J., and Eyre, B. D.: Groundwater-derived dissolved inorganic and or-ganic carbon exports from a mangrove tidal creek: The miss-ing mangrove carbon sink?, Limnol. Oceanogr., 58, 475–488, doi:10.4319/lo.2013.58.2.0475, 2013a.
Maher, D. T., Santos, I. R., Leuven, J. R. F. W., Oakes, J. M., Erler, D. V., Carvalho, M. C., and Eyre, B. D.: Novel Use of Cavity Ring-down Spectroscopy to Investigate Aquatic Carbon Cycling from Microbial to Ecosystem Scales, Environ. Sci. Technol., 47, 12938–12945, doi:10.1021/es4027776, 2013b.
Maher, D. T., Santos, I. R., and Tait, D. R.: Mapping Methane and Carbon Dioxide Concentrations andδ13C Values in the Atmo-sphere of Two Australian Coal Seam Gas Fields, Water Air Soil Poll., 225, 2216, doi:10.1007/s11270-014-2216-2, 2014. Maher, D. T., Cowley, K., Santos, I. R., Macklin, P., and Eyre, B.
D.: Methane and carbon dioxide dynamics in a subtropical es-tuary over a diel cycle: Insights from automated in situ radioac-tive and stable isotope measurements, Mar. Chem., 168, 69–79, doi:10.1016/j.marchem.2014.10.017, 2015.
Martz, T. R., Daly, K. L., Byrne, R. H., Stillman, J. H., and Turk, D.: Technology for ocean acidification research: Needs and avail-ability, Oceanography, 28, 40–47, doi:10.5670/oceanog.2015.30, 2015.
Midwood, A. J. and Millard, P.: Challenges in measuring theδ13C of the soil surface CO2efflux, Rapid Commun. Mass Sp., 25, 232–242, doi:10.1002/rcm.4857, 2011.
Nara, H., Tanimoto, H., Tohjima, Y., Mukai, H., Nojiri, Y., Katsumata, K., and Rella, C. W.: Effect of air composition (N2, O2, Ar, and H2O) on CO2 and CH4 measurement by wavelength-scanned cavity ring-down spectroscopy: calibration and measurement strategy, Atmos. Meas. Tech., 5, 2689–2701, doi:10.5194/amt-5-2689-2012, 2012.
Newton, J., Feely, R., Jewett, E., Williamson, P., and Mathis, J.: Global Ocean Acidification Observing Network: Require-ments and Governance Plan, 60 pp., http://www.goa-on.org/ docs/GOA-ON_plan_print.pdf, 2014.
O’Sullivan, D. W. and Millero, F. J.: Continual measurement of the total inorganic carbon in surface seawater, Mar. Chem., 60, 75– 83, doi:10.1016/S0304-4203(97)00079-0, 1998.
Pataki, D. E., Ehleringer, J. R., Flanagan, L. B., Yakir, D., Bowl-ing, D. R., Still, C. J., Buchmann, N., Kaplan, J. O., and Berry, J. A.: The application and interpretation of Keeling plots in terres-trial carbon cycle research, Global Biogeochem. Cy., 17, 1022, doi:10.1029/2001GB001850, 2003.
Porowska, D.: Determination of the origin of dissolved inorganic carbon in groundwater around a reclaimed landfill in Otwock using stable carbon isotopes, Waste Manage., 39, 216–225, doi:10.1016/j.wasman.2015.01.044, 2015.
Sabine, C. L., Ducklow, H., and Hood, M.: International carbon coordination: Roger revelle’s legacy in the intergovernmental oceanographic commission, Oceanography, 23, 48–61, 2010. Smith, B. N. and Epstein, S.: Two Categories of13C/12C Ratios
for Higher Plants, Plant Physiol., 47, 380–384, 1971.
Taipale, S. J. and Sonninen, E.: The influence of preservation method and time on theδ13C value of dissolved inorganic car-bon in water samples, Rapid Commun. Mass Sp., 23, 2507–2510, doi:10.1002/rcm.4072, 2009.
Van Geldern, R., Verma, M. P., Carvalho, M. C., Grassa, F., Delgado-Huertas, A., Monvoisin, G., and Barth, J. A. C.: Sta-ble carbon isotope analysis of dissolved inorganic carbon (DIC) and dissolved organic carbon (DOC) in natural waters – Results from a worldwide proficiency test, Rapid Commun. Mass Sp., 27, 2099–2107, doi:10.1002/rcm.6665, 2013.
Vogel, F. R., Huang, L., Ernst, D., Giroux, L., Racki, S., and Worthy, D. E. J.: Evaluation of a cavity ring-down spectrometer for in situ observations of13CO2, Atmos. Meas. Tech., 6, 301–308, doi:10.5194/amt-6-301-2013, 2013.