© Author(s) 2009. This work is distributed under the Creative Commons Attribution 3.0 License.
Geophysicae
Cluster and Double Star multipoint observations of a plasma bubble
A. P. Walsh1, A. N. Fazakerley1, A. D. Lahiff1, M. Volwerk2, A. Grocott3, M. W. Dunlop4, A. T. Y. Lui5, L. M. Kistler6, M. Lester3, C. Mouikis6, Z. Pu7, C. Shen8, J. Shi8, M. G. G. T. Taylor9, E. Lucek10, T. L. Zhang2, and I. Dandouras11
1Mullard Space Science Laboratory, University College London, Holmbury St. Mary, Dorking, Surrey, RH5 6NT, UK 2Space Research Institute, Austrian Academy of Sciences, Schmiedlstraße 6, 8042 Graz, Austria
3Department of Physics and Astronomy, University of Leicester, University Rd, Leicester, LE1 7RH, UK 4Rutherford Appleton Laboratory, Harwell Science and Innovation Campus, Didcot, Oxon, OX11 0QX, UK
5The Johns Hopkins University, Applied Physics Laboratory, 11100 Johns Hopkins Rd, Laurel MD, 20723-6099, USA 6Department of Physics, University of New Hampshire, Durham NH, 03824, USA
7Peking University, Beijing, China
8State Key Laboratory for Space Weather, CSSAR, Chinese Academy of Sciences, Beijing 100080, China 9European Space Technology Centre, Keplerlaan 1, Po Box 299, 2200 AG Noordwijk, The Netherlands 10Blackett Laboratory, Imperial College, London, UK
11Centre d’Etude Spatiale des Rayonnements, Toulouse, France
Received: 28 August 2008 – Revised: 19 January 2009 – Accepted: 22 January 2009 – Published: 16 February 2009
Abstract. Depleted flux tubes, or plasma bubbles, are one possible explanation of bursty bulk flows, which are transient high speed flows thought to be responsible for a large pro-portion of flux transport in the magnetotail. Here we report observations of one such plasma bubble, made by the four Cluster spacecraft and Double Star TC-2 around 14:00 UT on 21 September 2005, during a period of southward, but BY-dominated IMF. In particular the first direct observations
of return flows around the edges of a plasma bubble, and the first observations of plasma bubble features within 8RE
of the Earth, consistent with MHD simulations (Birn et al., 2004) are presented. The implications of the presence of a strongBY in the IMF and magnetotail on the propagation of
the plasma bubble and development of the associated current systems in the magnetotail and ionosphere are discussed. It is suggested that a strongBY can rotate the field aligned
cur-rent systems at the edges of the plasma bubble away from its duskward and dawnward flanks.
Keywords. Magnetospheric physics (Current systems; Magnetotail; Plasma sheet)
Correspondence to: A. P. Walsh
1 Introduction
The exact mechanism by which magnetic flux and plasma are transported sunward through the Earth’s magnetotail plasma sheet has been an active topic of research since the Dungey Cycle of magnetospheric convection (Dungey, 1961) was first proposed. In recent years much effort has been concen-trated on explaining the localised transient fast flows, called Bursty Bulk Flows (BBFs) by Angelopoulos et al. (1992), that have been observed in the tail and are thought to carry a significant proportion of mass and magnetic flux earthward during more geomagnetically active periods. The nature of the processes behind their creation and propagation, and their role in the development of substorms and other large-scale magnetotail phenomena, however, are still uncertain. One theoretical explanation that has been put forward for these BBFs is that they are depleted flux tubes, also called “plasma bubbles” (Chen and Wolf, 1993, 1999). Plasma bubbles were first suggested by Pontius and Wolf (1990) as a possible solution to the so-called “pressure balance inconsistency”, whereby the adiabatic transport of magnetic flux and plasma earthward from the mid- to near-tail was shown to result in plasma pressures in the near-tail which are far too high to be confined by magnetic field intensities that are consistent with observed values (Erickson and Wolf, 1980).
plasma pressure within the flux tube andV the volume per unit magnetic flux of the flux tube integrated over the flux tube’s length, given byR
B−1dS.Sis the length of the flux tube), than surrounding flux tubes, which convects earthward under the action of the interchange instability. Because of its lower entropy content, the depleted flux tube cannot support as much gradient-curvature-drift current as neighbouring flux tubes and excess current is diverted into field aligned cur-rent systems at the boundaries of the bubble, flowing into the ionosphere on the dawnward boundary and out of the iono-sphere on the duskward boundary, similar to the substorm current wedge concept. Recent simulations by Sitnov et al. (2005) have suggested that reconnection on closed field lines in the plasma sheet would eject a small plasmoid tailwards, and might also result in the formation of a plasma bubble.
Observations interpreted as plasma bubbles have been re-ported by Sergeev et al. (1996), for example, who, using ISEE 1 and 2 (then located atXGSM∼−20RE), identified
several bubbles by looking for a decrease in plasma pres-sure and a concurrent sharp, transient dipolarisation in the magnetic field. Magnetic shear regions just outside the bub-ble boundary were also identified. From the sense of mag-netic shear in these regions (i.e. the sign ofBX·δBY), it was
determined whether the spacecraft entered the bubble on its dawnward or duskward side (Sergeev et al., 1996, Fig. 2). If BX·δBY is positive the spacecraft entered the bubble on the
dawnward edge and vice versa. The presence of field-aligned currents at the edges of plasma bubbles were inferred from these magnetic shear observations. Additionally, the bubble boundaries were found to be, in almost all cases, tangential discontinuities and the cross-tail extent of the bubbles was es-timated to be between approximately 1REand 3RE,
consis-tent with later work on BBFs using the Cluster spacecraft by Nakamura et al. (2004). The expected field-aligned currents for the bubble model have also been detected at the bound-aries of BBFs (e.g. Nakamura et al., 2005), and the currents within a BBF as a whole have been quantitatively compared with the brightness of an auroral streamer and found to be similar (Forsyth et al., 2008), lending support to the idea that auroral streamers are the ionospheric manifestation of these tail phenomena (Amm and Kauristie, 2002, and references therein).
Using 3-D MHD simulations, Birn et al. (2004) deter-mined that the pressure along a depleted flux tube need not be constant or steady. Their simulations showed that a newly formed plasma bubble would quickly reach a total pressure balance with surrounding flux tubes. According to the sim-ulation, at the central plasma sheet this pressure balance would be achieved through the plasma pressure returning to its undisturbed value soon after its initial depletion; this is in-consistent with some observations (e.g. Sergeev et al., 1996), however. Further away from the equatorial plane, in lower density regions, the plasma pressure would remain low and pressure balance would be attained through an increase in the magnetic pressure. This would set up a plasma pressure
gradient within the flux tube, resulting in field aligned flows from the equatorial plane to the poles. Over time these flows would cause a build-up of plasma in the near-Earth “horns” of the flux tube, evidenced as an increase in plasma pressure and commensurate decrease in magnetic pressure within the flux tube.
In this paper we present observations from the four Cluster spacecraft and the Double Star TC-2 spacecraft of what we interpret to be a plasma bubble penetrating to within 8RE
of the Earth, provide direct evidence of the existence of the expected return flows around the flanks of the plasma bubble, report other features of the plasma bubble that are not present in simulations, and discuss the possible effects of a strong magnetotailBY on plasma bubbles.
2 Observations
2.1 Event context and overview
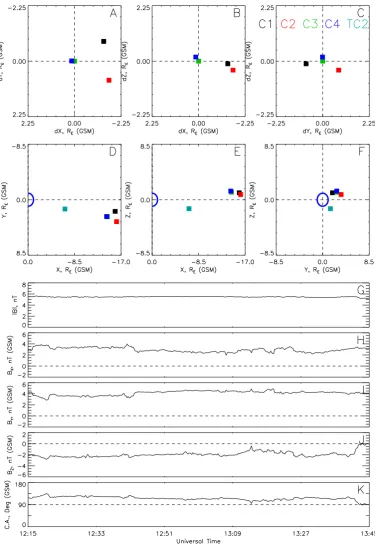
On 21 September 2005 between 13:45 UT and 14:15 UT the four Cluster spacecraft (hereafter referred to as C1, C2, C3 and C4) were operating in a high telemetry rate “burst” mode and located at GSM (−14.5, 2.6, 1.2)REnear midnight MLT
in the Earth’s magnetotail, while Double Star TC-2 was lo-cated at GSM (−6.74, 1.42,−1.39)RE(see Fig. 1, panels d–
f). In the 2005 tail season, the Cluster spacecraft were in a so-called “multiscale” configuration, with C1, C2 and C3 making a triangle of side∼10 000 km in the plane of a model neutral sheet while C4 was displaced∼1000 km in∼ZGSM
from C3, forming a flattened tetrahedron (see Fig. 1, pan-els a–c). This configuration allows for the study of current sheet thickness and motion with C3 and C4, while the large separation between C1, C2 and C3/C4 is designed to pro-vide contextual information and study the cross-tail extent of larger features such as BBFs. The large flattened tetrahedron, however, precludes the use of certain multi-spacecraft anal-ysis techniques, for example the curlometer (Dunlop et al., 2002), when studying features of a similar scale to BBFs.
Fig. 2. Auroral images of the South polar region, in AACGM Geomagnetic Latitude/Magnetic Local Time coordinates, taken by FUV-WIC on board the IMAGE spacecraft. The footprints of C3 and TC-2, as calculated from the T96 magnetic field model (Tsyganenko and Stern, 1996), are marked by black diamonds on each image.
of MLT of each other. Auroral activity is evident duskward of the spacecraft footpoints in the few minutes before sub-storm onset, however it appears to be dying down. A small, localised activation was observed close to midnight MLT, be-ginning at∼13:57 UT and lasting until the westward trav-elling surge of the substorm encompassed its location after onset. The onset itself (Fig. 2, lower middle image) was lo-cated significantly dawnward of the spacecraft footpoint, at
∼02:00 MLT.
Figure 3 shows the line of sight velocities from the two TIGER ionospheric radars, part of the Southern Hemisphere SuperDARN network (Greenwald et al., 1995; Chisham et al., 2007). The coloured squares show line of sight veloc-ity, positive towards the appropriate radar, the contours are equipotentials derived from the map-potential technique and the T96 Cluster footpoint is marked by the black circle. The ionospheric velocities detected by the TIGER radars are pre-dominantly duskward so despite the lack of backscatter at the footpoint itself, it is reasonable to assume that the velocity in the ionosphere at this point will have a significant duskward component. It should be noted that the equipotential contours are derived from an IMF-driven statistical model constrained by available data, so the contours by themselves cannot be
used to prove the presence of any flow as expected for a par-ticular IMF direction.
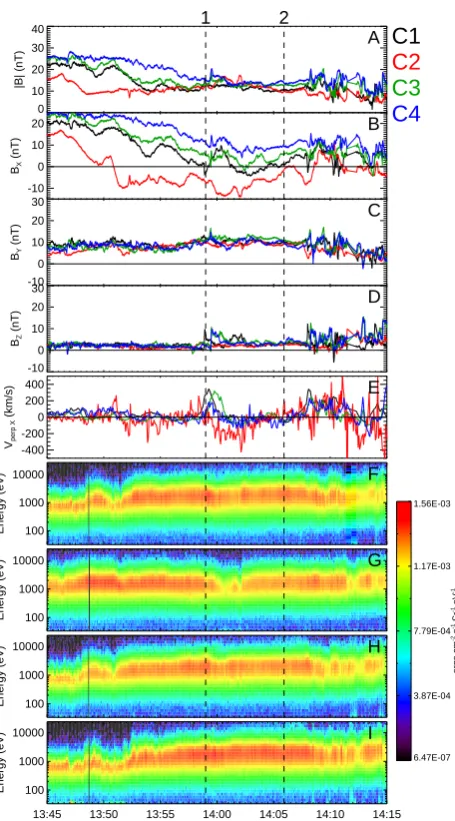
In Fig. 4 data from the four Cluster spacecraft, taken dur-ing the period of interest, are plotted. Panel (a) shows|B|
and panels (b–d) GSM BX, BY and BZ from the fluxgate
magnetometer (FGM) experiment on board all four Cluster spacecraft (Balogh et al., 2001). Panel (e) showsV⊥X, the
field-perpendicular velocity projected onto the GSMXaxis (i.e. theXcomponent ofV−(V·bˆ)bˆ, wherebˆis the unit vec-tor of magnetic field) which is a measure of flux transport, for ions, as measured by CIS-HIA (R`eme et al., 2001, C1 and C3); for protons as measured by CIS-CODIF (R`eme et al., 2001, C4) and for electrons as measured by PEACE (John-stone et al., 1997, C2). There is no working ion instrument on board C2. The electron velocities presented throughout this paper were calculated on the ground from three-dimensional distributions that have been corrected for spacecraft potential and had photoelectron contamination removed. Panels (f–i) are energy-time spectrograms plotting omnidirectional dif-ferential energy flux for electrons from the PEACE instru-ments on board C1, C2, C3 and C4, respectively.
TIGER (Bruny Island + Unwin): velocity
[image:5.595.314.542.60.471.2]TIG UNW
Fig. 3. A Line of sight velocity plot from the two TIGER South-ern Hemisphere SuperDARN radars in AACGM Geomagnetic Lat-itude/Magnetic Local Time coordinates. The coloured squares rep-resent plasma velocity, with positive velocity towards the radar and vice versa. Overlaid are equipotential contours showing the iono-spheric convection pattern, as predicted by the map-potential tech-nique. The T96 footpoint of the Cluster spacecraft is marked by the black circle.
neutral sheet (Fig. 4, panels b, f–i). Between 13:46 UT and 13:48 UT, C2, the southernmost spacecraft, measured a de-crease in|B|from 19 nT to 9 nT and an increase in electron fluxes consistent with the spacecraft moving closer to the neutral sheet. C2 then crossed the neutral sheet at 13:51 UT. A minimum variance analysis (Sonnerup and Scheible, 2000) on this crossing (not shown here) determined the neutral sheet normal to be almost perfectly aligned with GSMZ, and consequently to provide orientation with respect to the neutral sheet GSM coordinates will be used throughout this paper unless otherwise stated. C1, C3 and C4 also observed decreases in|B| of ∼10 nT as they approached the neutral sheet. C1 and C3 observed this decrease between 13:50 UT and 13:53 UT, accompanied by increases in electron flux. C4 observed the decrease over a much longer period (13:52 UT to 13:59 UT) but saw a similar increase in electron flux to the other spacecraft at 13:53 UT. Because C2 was the south-ernmost spacecraft and C4 the northsouth-ernmost, the timing of these decreases in|B| is consistent with the plasma sheet moving northward over the Cluster tetrahedron. While an expansion of a moving plasma sheet over the spacecraft can-not be ruled out, in this case it is unlikely that a static plasma sheet expanded over the spacecraft because relatively slow-moving spacecraft, such as Cluster near apogee, initially lo-cated as they were away from the neutral sheet, would not be expected to cross the neutral sheet during such an expan-sion. Note that although there is a strongY component of
100 1000 10000 Energy (eV) 100 1000 10000 Energy (eV) 100 1000 10000 Energy (eV)
13:45 13:50 13:55 14:00 14:05 14:10 14:15 Universal Time (hh:mm)
100 1000 10000 Energy (eV) 6.47E-07 3.87E-04 7.79E-04 1.17E-03 1.56E-03 ergs cm
-2 s -1 Sr -1 eV
-1 -400 -200 0 200 400
Vperp X
[image:5.595.64.280.63.262.2](km/s) 0 10 20 30 40 |B| (nT) -10 0 10 20 BX (nT) -10 0 10 20 30 BY (nT) -10 0 10 20 30 BZ (nT)
C1
C2
C3
C4
A B C D E F G H I 1 2Fig. 4. An overview of the interval of interest. Panel (A) shows the magnitude of the magnetic field as measured by FGM for C1, C2, C3 and C4 (black, red, green and blue traces, respectively); pan-els (B–D) show the three vector components of magnetic field in the GSM coordinate system; panel (E) shows theXcomponent of the field-perpendicular velocity projected onto GSM axes for ions, as measured by HIA (C1 and C3); protons as measured by CIS-CODIF (C4) and electrons as measured by PEACE (C2). Panels (F– I) show energy-time spectrograms of omnidirectional differential energy flux for electrons from PEACE for C1, C2, C3 and C4 re-spectively. The dashed black line labelled 1 marks the feature of interest, shown in more detail in Figs. 5, 6, 7 and 8. The dashed black line marked 2 shows the time of substorm onset in the image FUV observations.
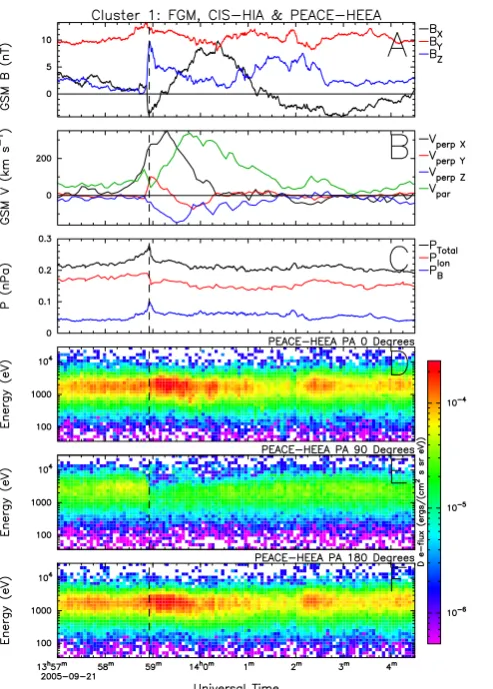
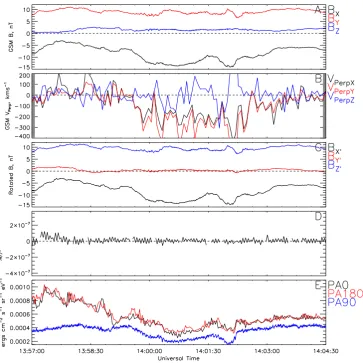
Fig. 5. C1 observations of the field dipolarisation and associated plasma features. Panel (A) shows GSMBX(black),BY (red) and BZ (blue) from FGM; panel (B) GSMV⊥X (black),V⊥Y (red), V⊥Z(blue) andV//(green) for ions from CIS-HIA; panel (C) total (i.e. magnetic + ion) pressure (black), ion pressure (red) and mag-netic pressure (blue) and panels (D–F) energy time spectrograms from PEACE-HEEA for pitch angles of 0◦, 90◦and 180◦, respec-tively. The vertical dashed line marks the entry of the spacecraft into the region of interest.
rather than a result of any tilt of the neutral sheet (Cowley, 1981), consistent with the results of the MVA.
Between∼13:58 UT and∼14:01 UT C1, C3 and C4 each observe a dipolarisation in the magnetic field (Fig. 4, panel d) accompanied by an earthward flow of∼300 km s−1. C2 ob-serves no change in magnetic field direction but does see a tailward flow of ∼300 km s−1 between ∼13:59 UT and
∼14:03 UT. All the spacecraft detect a change in electron fluxes around the time of the flows.
After the auroral substorm onset, which according to the IMAGE data (Fig. 2, middle bottom panel) occurred later, between 14:03:50 UT and 14:05:55 UT at least two hours in MLT away from the spacecraft footpoints, the magnetic field as measured by all of the Cluster spacecraft becomes much
Fig. 6. C2 observations of the field dipolarisation and associated plasma features. Panel (A) shows GSM BX (black), BY (red) and BZ (blue) from FGM, panel (B) GSM V⊥X (black), V⊥Y (red), V⊥Z (blue) and V// (green) for electrons from PEACE, panel (C) magnetic pressure (blue) and panels (D–F) energy time spectrograms from PEACE-HEEA for pitch angles of 0◦, 90◦and 180◦, respectively.
more disturbed. C2 recrosses the neutral sheet, subsequently remaining in the northern plasma sheet until the 14:12 UT. No successful MVA could be carried out on this cross-ing. Further transient dipolarisation signatures and earthward flows were seen at∼14:07 UT on all of the Cluster spacecraft and all spacecraft recorded a drop in electron fluxes. The magnetic field continued to evolve into a more dipolar con-figuration as the substorm progressed (not shown here). The time of substorm onset is marked by dashed line 2 on Fig. 4. 2.2 Cluster observations
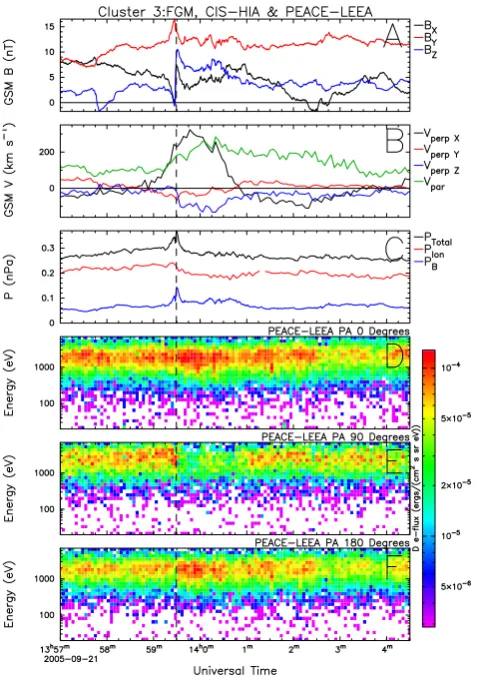
[image:6.595.310.547.65.406.2]Fig. 7. C3 observations of the field dipolarisation and associated plasma features. Panel (A) shows GSMBX(black),BY (red) and BZ (blue) from FGM, panel (B) GSMV⊥X(black), V⊥Y (red), V⊥Z(blue) andV//(green) for ions from CIS-HIA, panel (C) total (i.e. magnetic + ion) pressure (black), ion pressure (red) and mag-netic pressure (blue) and panels (D–F) energy time spectrograms from PEACE-LEEA for pitch angles of 0◦, 90◦and 180◦, respec-tively. Note that the energy range for these PEACE spectrograms is different from those in the The vertical dashed line marks the entry of the spacecraft into the region of interest.
[image:7.595.48.287.62.404.2]field components, panels (b)V// and GSM components of V⊥, panels (c) magnetic and (where available) ion contri-butions to total pressure; and panels (d–f) electron spectro-grams for pitch angles of 0, 90 and 180 degrees, respec-tively. As before, velocities are taken from CIS-HIA on C1 and C3, CIS-CODIF on C4 and PEACE on C2. It should be noted here that a one-to-one comparison between plasma mo-ments from different instrumo-ments is not always appropriate, although the PEACE and CIS instruments have been care-fully cross-calibrated andV⊥found to be comparable (Faza-kerley et al., 2009). Furthermore, in this case the direction of flow is more important than the magnitude so the difference in the top of the energy ranges of CIS-HIA and CIS-CODIF
Fig. 8. C4 observations of the field dipolarisation and associated plasma features. Panel (A) shows GSMBX(black),BY (red) and BZ (blue) from FGM, panel (B) GSMV⊥X (black),V⊥Y (red), V⊥Z(blue) andV//(green) for ions from CIS-CODIF, panel (C) to-tal (i.e. magnetic + ion) pressure (black), ion pressure (red) and magnetic pressure (blue) and panels (D–F) energy time spectro-grams from PEACE-HEEA for pitch angles of 0◦, 90◦and 180◦, respectively. The vertical dashed line marks the entry of the space-craft into the region of interest.
should not significantly alter our conclusions. The electron spectrograms are taken from PEACE-HEEA on all space-craft apart from C3 where a non-functioning anode makes comparison of fluxes at different pitch angles difficult. The energy range of the LEEA sensor still covers the majority of the electron distribution and as such data from that sensor are used for C3.
C1, C3 and C4 all observed similar features during this period, consistent with the passage of a plasma bubble over those spacecraft. All three spacecraft observed a sharp in-crease inBZ, marked by a vertical dashed line on each
C1 and C3 observed a negativeδBX while C4 observed a
positiveδBX. Contemporary with the dipolarisation the three
spacecraft detected a sharp drop in perpendicular electron fluxes (Figs. 5, 7 and 8, panels e) and an increase in paral-lel and anti-paralparal-lel electron fluxes (Figs. 5, 7 and 8, panels d and f). C1 and C3 detected a decrease in ion pressure at the time of dipolarisation that lasted for∼180 s at C1 and∼90 s at C3. These decreases were accompanied by increases in magnetic pressure which began just prior to dipolarisation and peaked at the time of the dipolarisation front arriving at each spacecraft. C4 observed a similar increase in magnetic pressure, although no decrease in proton pressure is evident in the somewhat noisy CODIF data (Figs. 5, 7 and 8, pan-els c).
The behaviour of velocity (Figs. 5, 7 and 8, panels b) is also similar on C1, C3 and C4. In all cases an earthward flow (i.e. V⊥X>0) was detected. The flow began just
be-fore the dipolarisation and, on C1 and C3, peaked∼15 s after dipolarisation. The dipolarisation observed by C4 was con-temporary with the approximate centre of the earthward flow period, which in this case peaked just prior to dipolarisation. The period of earthward flow continued for approximately one minute after dipolarisation in the case of both C1 and C3 while on C4 the earthward flow stopped∼40 s after dipolar-isation. The peak velocities recorded by the ion instruments were∼350 km s−1,∼320 km s−1 and∼180 km s−1for C1, C3 and C4, respectively. In all cases, the earthward flow was followed by a period of weaker (i.e.|V⊥X|<100 km s−1)
tail-ward flow, although while C3 and C4 observed this immedi-ately after the earthward flow, C1 observed a short stagnation period of duration∼90 s where no significant earthward or tailward flow was detected. Another enhancement in paral-lel and anti-paralparal-lel electron fluxes was detected by C1 at the same time as the tailward flow. In the case of C3 and C4, the earthward flow stopped at the end of the period of enhanced magnetic pressure/reduced ion pressure; while for C1, the enhanced magnetic pressure/reduced ion pressure continued until the short burst of tailward flow and (anti-)parallel elec-tron flux enhancement some time after the end of the earth-ward flow. Slower (i.e.|V⊥Y|.100 km s−1) dawnward and
duskward flows were detected by C3 and C4 contemporary with the earthward and tailward flows (i.e. V⊥Y and V⊥X
were in antiphase), again beginning just prior to dipolarisa-tion. No significantV⊥Y was detected by C1 prior to
dipo-larisation, instead a short interval of duskward flow was de-tected just after dipolarisation whileBXwas negative,
turn-ing dawnward whenBXbecame positive. In all cases, a
neg-ativeV⊥Zwas detected, beginning at the time of
dipolarisa-tion.
C1, C3 and C4 all detected enhanced positiveV//in the
region of enhanced magnetic pressure (Figs. 5, 7 and 8, pan-els b). In the case of C1 the increase inV//began just
af-ter the dipolarisation, when BX began to recover from its
sharp decrease in magnitude. V// reached a peak value of
∼340 km s−1 at 13:59:45 UT, 30 s after the peak in V⊥X
and then decreased gradually to its undisturbed value by 14:02 UT, when the spacecraft exited the region of enhanced magnetic pressure. C3 detected a slightly different signa-ture inV//:V//increased from a higher background level of
∼100 km s−1to a peak∼280 km s−1, again∼30 s after the peak inV⊥X. The increase began at the time of
dipolarisa-tion andV//return to its undisturbed value at the end of the
period of tailward flow,∼14:03:30 UT. C4 recorded similar features inV//to C3.
During the same interval C2 observed quite different fea-tures. No dipolarisation was evident, nor was there any pe-riod of earthward flow. Instead a prolonged pepe-riod of tail-ward and dawntail-ward flow was measured in the electron mo-ments at the same time as increases in magnetic pressure and
|BX|. In contrast to the other three spacecraft, no significant
V⊥Z was detected, nor any increase in parallel or
antipar-allel electron fluxes. Indeed these electron fluxes actually decreased, as did the perpendicular electron flux.
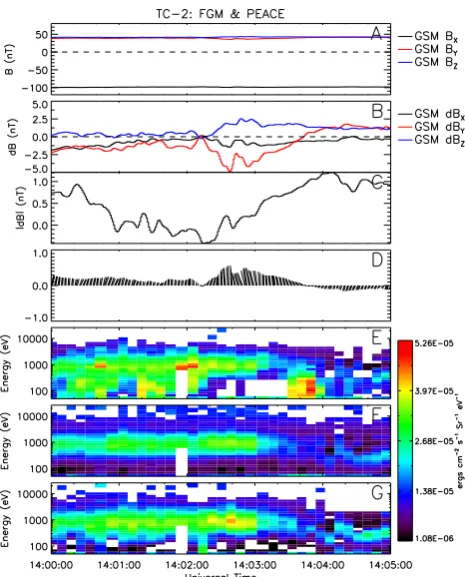
2.3 Double Star TC-2 observations
In Fig. 9 data from the Double Star TC-2 spacecraft, taken between 14:00 UT and 14:05 UT are plotted. Panel (a) shows the three GSM components of magnetic field from the FGM instrument on board TC-2 (Carr et al., 2005), panel (b) shows the three components of magnetic field with the mean field removed, panel (c) shows the magnitude of the field with the mean field removed and panel (d) is feather plot of magnetic field vectors (see Volwerk et al., 1996, for example) showing any rotations of the magnetic field in a mean-field-aligned coordinate system, whereby one of the axes is defined as the direction of the magnetic field when filtered to remove any oscillations with periods shorter than ten minutes, a second axis is defined as the cross product of the first axis and the GSM position vector of the spacecraft and the third com-pletes a right handed set. Here the mean field axis points out of the page, so an anticlockwise rotation of the field vectors with time on the plot represents the effect of a parallel current and vice versa. Panels (e–g) are energy-time spectrograms for electrons with pitch angles of 0◦, 90◦and 180◦, respec-tively, as measured by the PEACE instrument on board TC-2 (Fazakerley et al., 2005). It should be noted that because the Double Star PEACE instrument has one sensor, rather than the two that make up each Cluster instrument, a distribution covering the full energy range is accumulated every two spins (i.e. eight seconds) rather than every spin.
At 14:00 UT, the TC-2 spacecraft was located south of the tail neutral sheet (Fig. 9, panel a), some 7RE antisunward
of Earth, moving north towards the central plasma sheet. At
∼14:02 UT, the spacecraft detected a small clockwise rota-tion in the magnetic field (Fig. 9, panel d) and an enhance-ment in the flux of parallel electrons (Fig. 9, panel e). At the same time a transient peak inBYis observed (Fig. 9, panel b).
by a small increase in magnetic pressure (Fig. 9, panel c). An enhancement in antiparallel electron flux was detected, peaking at∼14:02:40 UT (Fig. 9, panel g), accompanied by a minor anticlockwise rotation in the field and a short dip in the upward trending magnetic pressure. After 14:03 UT the spacecraft entered a more lobe-like environment, as evi-denced by a drop in electron fluxes and increase in magnetic pressure, before detecting a low energy (i.e. with a peak flux at ∼200 eV) field-aligned electron beam at ∼14:03:40 UT accompanied by a much larger anticlockwise rotation in magnetic field. All of this occurred before the substorm onset a few hours dawnward in Magnetic Local Time.
3 Discussion 3.1 Cluster data
The magnetic field dipolarisations and associated plasma data observed by C1 (Fig. 5) C3 (Fig. 7) and C4 (Fig. 8) are consistent with signatures predicted by theory, simu-lation and previous near-equatorial observations of plasma bubbles; namely a transient dipolarisation and earthward flow, a reduction in plasma pressure and an increase in magnetic pressure (maintaining approximately constant to-tal pressure). Sergeev et al. (1996) interpreted regions of earthward-flowing plasma of lower pressure than their sur-roundings, accompanied by transient dipolarisations in the magnetic field as plasma bubbles; all of these features have been reported here. More recently Forsyth et al. (2008) re-ported enhancements in bidirectional electron fluxes inside a structure interpreted to be a plasma bubble, which were ex-plained as a product of reconnection. A similar pitch angle distribution has been observed here by C1, C3 and C4.
The entry of the Cluster spacecraft into the depleted flux tube (plasma bubble) can be identified from several features in the data, most obviously the increases in BZ and PB
(Figs. 5, 7 and 8, panels a and c) and decreases inPIon and
[image:9.595.311.544.60.349.2]perpendicular electron flux (Figs. 5, 7 and 8, panels c and e). The direction of any field-aligned currents detected at the edge of a plasma bubble can help determine where a space-craft entered the depleted flux tube, as can the magnetic shear just outside the boundary of the plasma bubble (Sergeev et al., 1996). In general there are several possible ways of determining if any field-aligned currents are present. The curlometer technique (Dunlop et al., 2002) has been used to study larger scale current systems within a bubble at a 300 km tetrahedron scale size (Forsyth et al., 2008) but can-not be applied here because the scale size of the Cluster tetra-hedron in our event is much larger, and is comparable to the scale size of previously observed BBFs and plasma bubbles . The curlometer is only accurate when used to study cur-rents much larger than the scale size of the Cluster tetrahe-dron. Furthermore, C2 is located South of the neutral sheet while the other spacecraft are located North of the neutral
Fig. 9. Data from the FGM and PEACE instruments on board Dou-ble Star TC-2. Panel (A) shows the 3 GSM components of magnetic field, panel (B) the 3 GSM components of magnetic field with the mean field subtracted and panel (C)|dB|. Panel (D) is a feather plot showing rotations in the magnetic field that indicate the pres-ence of field-aligned currents near the spacecraft, and panels (E), (F) and (G) electron energy time spectrograms for electrons with pitch angles of 0, 90 and 180 degrees, respectively.
sheet; this would render multispacecraft techniques like the curlometer ineffective since FACs in either hemisphere are expected to flow in different directions. Below we have at-tempted to identify any field aligned currents by looking for magnetic shear and also by seeking evidence in the electron data from the PEACE instruments.
Fig. 10. Data pertaining to the entry of C1 into the plasma bubble. Panel (A) shows GSM components and magnitude of magnetic field, panel (B) the GSM components ofV⊥, panel (C) the magnetic field rotated about GSMXinto a coordinate frame that eliminates anyY
component in the undisturbed magnetic field, in order to identify any draping in the field around the plasma bubble. Panel (D) is the parallel electron current calculated from 2-D pitch angle distributions in the energy range covered by both PEACE sensors. Panel (E) shows the electron differential energy fluxes separately for 0◦PA (pitch angle), 180◦PA and 90◦PA, taken from 3-D distributions returned by both the HEEA and LEEA sensors and summed over their common energy range. The vertical dashed line marks the entry of the spacecraft into the plasma bubble.
sensors’ common energy range. Fluxes at 0◦PA, 90◦PA and 180◦PA are plotted. Each of these methods can be used to detect the presence of FACs and they each have advantages and disadvantages as described below. On each plot the ver-tical dashed line marks the time of the spacecraft’s entry into the depleted flux tube, based on the time of dipolarisation and decrease in 90◦pitch angle electron flux.
2-D pitch angle distributions are returned from each PEACE sensor every spin and have a pitch angle resolution of 15◦. Pitch angle selection is carried out on-board using the inter-experiment link with the FGM instrument and is based on magnetic field data collected during the previous spin. As such, should the magnetic field direction change over the
Fig. 11. Data pertaining to the entry of C3 into the plasma bubble. Panel (A) shows GSM components and magnitude of magnetic field, panel (B) the GSM components ofV⊥, panel (C) the magnetic field rotated about GSMXinto a coordinate frame that eliminates anyY
component in the undisturbed magnetic field, in order to identify any draping in the field around the plasma bubble. Panel (D) is the parallel electron current calculated from 2-D pitch angle distributions in the energy range covered by both PEACE sensors. Panel (E) shows the electron differential energy fluxes separately for 0◦PA, 180◦PA and 90◦PA, taken from 3-D distributions returned by both the HEEA and LEEA sensors and summed over their common energy range. The vertical dashed line marks the entry of the spacecraft into the plasma bubble.
have reduced angular or energy resolution (depending on in-strument mode) when compared to the 2-D pitch angle dis-tributions. In both the 2-D and 3-D cases, because of the po-sition of the sensors on the spacecraft, when data from both sensors is combined a full pitch angle distribution (albeit a distribution restricted to the energy range covered by both of the sensors) can be collected every two seconds. When a 3-D LEEA distribution was unavailable from C1 or C3 for a given spin interpolation was used to create a consistent time series across all spacecraft. The majority of the electron dis-tribution lay within the energy range of LEEA (see Fig. 7, bottom 3 panels), so our assumption that most of the electron contribution to the current density is being measured using this method seems reasonable.
Any shear in the ambient plasma magnetic field caused by the passage of a moving flux tube should manifest itself in the field component perpendicular to both the direction
of motion of the flux tube and the flux tube “axis”. For a canonical magnetotail with no significantBY, the shear is in
the Y direction (Sergeev et al., 1996). In this case, because there is a strongBY in the tail, that effectively rotates the
flux tube axis out of theXZplane, any shear should be in the plane perpendicular to the axis. As such, the FGM data in panels (c) have been rotated about the GSMXaxis such that anyBY in the undisturbed tail tends to zero, thus any shear
in the magnetic field caused by the passage of the plasma bubble should only appear in the newY component,Y0.
Fig. 12. Data pertaining to the entry of C4 into the plasma bubble. Panel (A) shows GSM components and magnitude of magnetic field, panel (B) the GSM components ofV⊥, panel (C) the magnetic field rotated about GSMXinto a coordinate frame that eliminates anyY
component in the undisturbed magnetic field, in order to identify any draping in the field around the plasma bubble. Panel (D) is the parallel electron current calculated from 2-D pitch angle distributions in the energy range covered by both PEACE sensors. Panel (E) shows the electron differential energy fluxes separately for 0◦PA, 180◦PA and 90◦PA, taken from 3-D distributions returned by both the HEEA and LEEA sensors and summed over their common energy range. The vertical dashed line marks the entry of the spacecraft into the plasma bubble.
of dipolarisation, which could represent a parallel electron current, consistent with the magnetic field draping. This fea-ture, however, occurs over such a short period of time and consists of only two data points. Because of the rapidly varying magnetic field direction at this time, the pitch an-gle selection on board the spacecraft was imperfect. This resulted in a data gap in the 2-D distributions from which the partial current density (Fig. 10, panel d) was calculated, as described above. We cannot be sure, therefore, that the imbalance in electron flux was actually a real current. An attempt to calculate a “parallel current flux” from the 3-D distributions (not shown) did not reveal any currents larger than the background noise level, presumably because of the coarser angular resolution of the 3-D distributions. Just af-ter the dipolarisation there was a period of several spins where PEACE detected a greater flux of 0◦PA electrons than 180◦PA electrons. We suggest this feature is too far from
the bubble boundary to represent an FAC at its edge. The sharp (i.e. 1 data point) drops in the parallel electron fluxes at 13:59:40 UT, 14:00:46 UT and 14:01:25 UT are artefacts of the process used to combine data from the two PEACE sensors. The magnetic field data then, suggest that C1 en-tered the plasma bubble on its dawnward side and while the electron data do not contradict this interpretation, data gaps mean that they cannot confirm it either.
Fig. 13. A more detailed examination of the PEACE data for C2. Panel (A) shows GSM components and magnitude of magnetic field, panel (B) the GSM components ofV⊥, panel (C) the magnetic field rotated about GSMXinto a coordinate frame that eliminates anyY
component in the undisturbed magnetic field, included here for completeness. Panel (D) is the parallel electron current calculated from 2-D pitch angle distributions in the energy range covered by both PEACE sensors. Panel (E) shows the electron differential energy fluxes separately for 0◦PA, 180◦PA and 90◦PA, taken from 3-D distributions returned by both the HEEA and LEEA sensors and summed over their common energy range.
current density is above the background level for the 4 data points preceding the gap, making it more convincing evi-dence of a current. In this case the current is consistent with spacecraft entry through the duskward edge of the plasma bubble sinceBX>0. This contradictory electron and
mag-netic data may be a result of the spacecraft being located close to the centre line of the plasma bubble, although the im-perfect electron pitch angle selection and resulting data gap at the time of dipolarisation make it is impossible to tell for sure. The systematic imbalance between 0◦PA and 180◦PA electron fluxes, seen on the bottom panel of Fig. 11 but not reflected in the current moments, continues for the entire du-ration of the burst mode and is most probably a result of an imperfect instrument calibration on this particular day.
C4 seems to show a smaller degree of draping than C1 (Fig. 12, panel c) though the draping that is evident is con-sistent with an entry into the plasma bubble on the dawn-ward side. The PEACE moments, however, are inconclusive containing as they do numerous data gaps, again a result of imperfect pitch angle selection on board the spacecraft.
While C4 is the only spacecraft that detects a significant V⊥Y before entry into the flux tube (the flow shear layer
pre-dicted and observed by Sergeev et al., 1996), C1, C3 and C4 observe earthward flow before the entry into the plasma bubble. We suggest that this flow represents plasma being swept up in front of the earthward moving bubble. This sweep-up can be seen as a gradual increase in the perpendic-ular electron flux (Figs. 10, 11 and 12, panels e) beginning
Fig. 14. An illustration of the suggested formation mechanism of the depleted wake. The bubble is grey while the flux tubes that pile up in front of it are colour-coded red-orange-yellow with decreasing plasma content near the equatorial plane. Arrows of the correspond-ing colour represent the field-aligned plasma flow that “empties” the flux tube. Blue arrows mark the motion of the emptied flux tubes as they slip around the sides of the bubble forming the wake.
in magnetic pressure is also seen closer to the edge of the bubble as magnetic flux is also swept up in front of the de-pleted flux tube (Figs. 5, 7 and 8, panel c). Plasma sweep up has been previously observed by Slavin et al. (2003) in front of earthward-moving, BBF type flux ropes.
The exit from the plasma bubble is much less clear in the data, in fact different features are observed by the different spacecraft. In the case of C1, the earthward flow ended just after 14:00 UT (Fig. 5, panel b), some two minutes before the ion pressure returns to its undisturbed value (Fig. 5, panel c), at which time BZ also decreases to its undisturbed value
(Fig. 5, panel a). C3 on the other hand detected the end of the earthward flow (Fig. 7, panel b) at exactly the same time as the ion pressure (Fig. 7, panel c) returned to its undisturbed value andBZ(Fig. 7, panel a) decreased, although not all the
way to its undisturbed value. C4 also observed the end of the earthward flow (Fig. 8, panel b) and a decrease inBZ(Fig. 8,
panel a) at the same time. The examination of perpendicu-lar electron fluxes on all four Cluster spacecraft (Figs. 10-13, bottom panel, discussion below) will help to resolve this ap-parent inconsistency in the data.
Figure 13, following the same format as Figs. 10–12, ex-amines the PEACE data for C2 in more detail. Given that C2 did not observe the plasma bubble, but was instead lo-cated duskward of it, and in the Southern Hemisphere, it might be expected that during the tailward flow, depending
on the spatial extent of the field-aligned current system as-sociated with the bubble, weak parallel currents would be detected. No currents above the background level are seen in the PEACE data, however (Fig. 13, panel d). Unlike the other Cluster spacecraft, however, the 0◦PA and 180◦PA electron fluxes did not increase during the flow period, instead, on av-erage, they decreased as did the 90◦PA electron flux. The tailward flows detected by PEACE at this time are consistent with return flows that are expected to be found around the edges of a plasma bubble (Birn et al., 2004) which have not been directly measured in the past. What is not predicted by theory or simulation, though, is the decrease in elec-tron flux (i.e. plasma density) in the tailward flowing plasma around the edges of a BBF. This may be a situation analo-gous to plasma depletion layers at the magnetopause (Zwan and Wolf, 1976), whereby the flux tubes piled-up in front of the plasma bubble are compressed by its earthward mo-tion, squeezing the plasma contained within them away from the equatorial plane, before the newly-emptied flux tube slips around the sides of the plasma bubble through interchange motion, finally forming a depleted wake behind it. Figure 14 illustrates this. The increases inV//observed by C1, C3 and
C4 (Figs. 5,7 and 8, panels b) before entry into the plasma bubble then represent the plasma flowing along the field lines away from the equatorial plane, and the increase inPB
ob-served by C2 (Fig. 6, panel c) during the lower density tail-ward flows is the compressed flux tubes slipping around the sides of the bubble.
Fig. 15. An illustrated equatorial cut of the morphology of the plasma bubble, as seen by Cluster. The region of flux and plasma pileup in front of the bubble is in yellow, the bubble itself is grey, the stagnant and tailward flowing wakes lighter and darker blues respectively and the field-aligned current regions green. Flow velocity is marked by the red arrows.
The general morphology of this plasma bubble, as inferred from the Cluster data and described above, is illustrated in Fig. 15, where velocities are marked in red, the bubble itself in grey, regions of FAC in green, the region of plasma and magnetic flux pile-up in yellow and the stagnant and tailward flowing wakes in different shades of blue.
The cross-tail extent of the plasma bubble can be estimated because C1, according to the sense of field-aligned currents, entered the bubble dawnward of its centre while C2, which was duskward of C1, missed it entirely. This means that the entire duskward half of the bubble was bracketed between the two spacecraft, so an upper limit (i.e. theY separation of C1 and C2,∼10 000 km) can be placed on the cross-tail extent of the duskward half of the bubble. If approximate symme-try either side of the bubble’s centre line is assumed, then this particular bubble cannot extend more than∼20 000 km (∼3RE) across the tail, consistent with previous
observa-tions (Sergeev et al., 1996; Nakamura et al., 2004). The estimated size of the bubble along its direction of motion, assuming the bubble itself ends with the earthward flow, is defined here as the peak value of|V⊥|, measured after the dipolarisation but before the end of the earthward flow, mul-tiplied by the elapsed time between the dipolarisation and the end of the earthward flow. For C1 and C3 the size of the bub-ble along its direction of motion was∼4RE, while for C4
the size was only∼1RE.
3.2 TC-2 data
Tracking the propagation of features through the magneto-tail can be problematic (e.g. Walsh et al., 2007). In this case, however, there is evidence that the plasma and mag-netic signatures seen by Cluster (Fig. 4) and TC-2 (Fig. 9) are manifestations of the same feature. Figure 16 shows the
elevation angle of the magnetic field for C1-C4 (panels a– d) and the elevation angle of the magnetic field with the mean field subtracted for TC-2 (panel e). The disturbances in elevation are qualitatively the same (although it should be noted that the scales on the Y-axes for Cluster and TC-2 on Fig. 16 are different), and the time difference between them is consistent with the time taken for a feature to propagate from C1 to C3, C3 to TC-2 at the velocities measured by C1 and C3 to within 15 %. Specifically, the distance trav-elled by a flux tube moving Earthward at 350 km s−1, the
peak velocity measured by C1, in the 30 s that elapsed be-tween the bubble’s detection at C1 and C3 is 10 500 km. C3 was located approximately 9000 km Earthward of C1. In the
∼3 min that elapsed between the bubble’s detection at C3 and TC2, a flux tube moving Earthward at the peak veloc-ity detected by C3 would have travelled 57 600 km. TC-2 was located∼50 000 km Earthward of C3, so a reduction in average velocity of∼15% to 270 km s−1would result in the correct propagation time from C3 to TC-2. While a depleted flux tube has not been observed so close to the Earth be-fore, a recent study by Takada et al. (2006) determined that BBFs observed by Cluster did not always result in a dipo-larisation close to the Earth (at Double Star TC-1 in Takada et al., 2006), but were more likely to do so when the mag-netic field at TC-1 was more stretched. During the interval reported here,Xis still the dominant component of magnetic field and has a greater magnitude than theX component of the T96 model field at the location of TC-2. It is consistent with Takada et al. (2006), then, that a BBF could penetrate to within 7REof the Earth and cause a dipolarisation.
Fig. 16. The GSM elevation angle of magnetic field for the four Cluster spacecraft (panels A–D) and the latitude angle ofdBfor TC-2 (panel E).
Simulations have studied the features of a depleted flux tube that might be expected close to the Earth (Birn et al., 2004), and the effect the presence of a depleted flux tube might have on the inner magnetosphere (Zhang et al., 2008), although to date no plasma bubbles have been detected at XGSM>−8RE. Birn et al. (2004) predicted that, close to the
Earth, after sufficient time had passed since the creation of a depleted flux tube, the plasma depletion and commensurate increase in magnetic pressure that characterise a plasma bub-ble actually reverse – field-aligned flows from further down-tail transport plasma to the higher latitude, near-Earth region, increasing the local plasma pressure. This causes the flux tube to expand, decreasing the magnetic pressure to main-tain the pressure balance between the flux tube and its sur-roundings. Some of these features are evident in the TC-2 data, despite the latitude of its footpoint not being signifi-cantly higher than that of Cluster, though it should be noted here that the accuracy of T96 magnetic field mapping, par-ticularly during more geomagnetically disturbed periods, is not sufficient to precisely determine spacecraft footpoints. The depleted flux tube can be identified as a small, transient, dipolarisation in the field at 14:02:20 UT (Fig. 9, panel b), accompanied by an increase in antiparallel (i.e. earthward), electron flux (Fig. 9, panel g). This electron flux could either represent a field-aligned current or a simple parallel flow, depending on the motion of the ions relative to that of the electrons. There is very little rotation in the magnetic field (Fig. 9, panel d) when compared with the lower energy elec-tron beam detected at 14:03:40 UT so it can be assumed that the flux enhancement does not contribute significantly to any
field-aligned current. There is also an enhancement of per-pendicular electron flux (Fig. 9, panel f) during the transient dipolarisation, accompanied by a short dip in|dB|(Fig. 9, panel c) – consistent with the increase in plasma pressure and decrease in magnetic pressure expected from the simulations. Unfortunately no velocity data, which could strengthen the association between the features seen by Cluster and TC-2, is available from TC-2 during this event.
3.3 The effect ofBY>0
The presence of a positive BY in the magnetotail will
un-doubtedly have an effect on the properties and motion of a plasma bubble, for example the change in the direction of the magnetic field draping around its edges. The presence of a strongBY in the magnetosphere, and the IMF, will also have
[image:16.595.50.281.61.281.2]an effect on the convection in the ionosphere (Cowley and Lockwood, 1992), and therefore the motion of the footpoint of the depleted flux tube. The SuperDARN data described in Fig. 3 do indeed show a convection pattern consistent with those expected in aBY dominated magnetosphere (e.g.
Gro-cott et al., 2003). The footpoint of the depleted flux tube is expected to be moving equatorwards because of the earth-wards motion of the plasma bubble in the tail and, because of theBY-dominated magnetosphere, is also expected to have a
duskward component to its motion, consistent with the Su-perDARN data (Fig. 3). Figure 17 illustrates the expected current systems in the case of noBY and the case reported
here.
In the case ofBY=0 (Fig. 17a), the cross-tail current is
di-verted into the ionosphere via field-aligned currents at the edges of the depleted flux tube. The flux tube is moving earthward in the tail, so its footpoint is moving towards the equator. The direction of velocity is then consistent with the directions of the magnetic field, B; current, j and electric field,Ein both the ionosphere and magnetotail.
seen while C1 is located in the depleted flux tube andBX<0
(Fig. 5, panels b and a) is consistent with this simple model, as is the ionospheric velocity inferred from the radar data. Unfortunately without higher resolution current data, and a clear time of exit from the plasma bubble, it is difficult to determine whether the rotation in field-aligned current sys-tems suggested here is, in fact, observed. The apparent flow shear across the tail neutral sheet within the plasma bubble (V⊥Y>0 in the south,V⊥Y<0 in the north; Fig. 5, panels a
and b), and enhanced duskward convection in the southern ionosphere (Fig. 3) suggest a situation analogous to the so-called TRINNI events that have been observed in the Su-perDARN and Cluster data (e.g. Grocott et al., 2005, Gro-cott et al., 2007). During these events, which have been observed in periods ofBY-dominated, but northward IMF,
reconnection in a twisted tail and the subsequent untwist-ing of the newly reconnected flux tubes result in flow shears across the tail neutral sheet, and between the northern and southern ionospheres. This event occurred during a period of southward IMF, but the auroral data (Fig. 2) seem to in-dicate that the plasma bubble was unrelated to the substorm with onset at∼02:00 MLT and∼14:05 UT and instead asso-ciated with the more localised auroral activation in the mid-night MLT sector a few minutes earlier. In this case there is no SuperDARN coverage at relevant MLTs in the Northern Hemisphere, so analysis of further events is necessary to de-termine whether or not the flow shear observed in tail here is TRINNI-like, or if the directions ofV⊥Y observed by the
different spacecraft are related to flow patterns within a de-pleted flux tube and internal to it.
4 Summary and conclusions
Multipoint observations of a depleted flux tube have been made using the Cluster and Double Star TC-2 spacecraft that are broadly consistent with previous observations (Sergeev et al., 1996, Forsyth et al., 2008, and references therein) and MHD simulations (Birn et al., 2004). In particular the first direct observations of the expected return flows around the flanks of a plasma bubble, made simultaneously with the observations of the bubble itself, have been reported; as have the first observations of near-Earth (i.e. within 8RE)
plasma bubble features predicted by simulations (Birn et al., 2004), such as an increase in plasma pressure and decrease in magnetic pressure, accompanied by earthward, field-aligned, plasma flows detected by PEACE. Although no ion data are available from TC-2, ion flow in the same direction is ex-pected here because of the lack of rotation in the magnetic field when the electrons were detected, implying that these electrons were not carrying significant current. This particu-lar plasma bubble seemed to have associated with it a com-plex wake of lower plasma content than its surroundings, that was not predicted by simulations. The separation of the Clus-ter spacecraft allows us to estimate the cross-tail extent of the
[image:17.595.311.546.64.361.2]B V V B J// J// J J J J E E X Y MAGNETOTAIL SOUTHERN IONOSPHERE (a) B V V B J// J// J J J J E E X Y MAGNETOTAIL SOUTHERN IONOSPHERE (b)
Fig. 17. An illustration, looking down on the north pole, of the ex-pected plasma bubble current systems during (A) the simplest case and (B) when there is a positiveBY present. Currents are drawn in red, electric fields in blue and velocities in black. The black ellipses represent the boundaries of the depleted flux tube in the magnetotail just south of the neutral sheet (right) and the southern ionosphere (left).
bubble to be≤3RE, again consistent with previous
observa-tions (Sergeev et al., 1996; Nakamura et al., 2004), while along its direction of motion the bubble measured ∼4RE
based on the C1 and C3 data and∼1RE based the C4 data.
A model of how the field aligned currents at the edge of the plasma bubble might be shifted around its boundary by the presence of a strongBY in the magnetotail has also been
pre-sented. The analysis of further events, however, particularly when higher resolution current data are available, is neces-sary to better understand how changes in the magnetotail and in ionospheric conditions affect the development and propa-gation of plasma bubbles.
Acknowledgements. Portions of this work were carried out as part
H. U. Frey for access to IMAGE-FUV data and software; and the PIs of the SuperDARN radars for provision of the radar data em-ployed in this study. The data emem-ployed were from radars funded by the research funding agencies of France, Japan, South Africa, Aus-tralia, and the UK. The TIGER research program is supported by the Australian Research Council, the Australian Antarctic Science Program and the TIGER Consortium Partners (La Trobe University, Australian Antarctic Division, DSTO Intelligence Surveillance and Reconnaissance Division, IPS Radio and Space Services, Monash University, and University of Newcastle). Some data analysis was done with QSAS. APW is supported by a UK STFC PhD Stu-dentship. AG and ML are supported by STFC grant PP/E000983.
Topical Editor I. A. Daglis thanks O. Amm and another anony-mous referee for their help in evaluating this paper.
References
Amm, O. and Kauristie, K.: Ionospheric Signatures Of Bursty Bulk Flows, Surv. Geophys., 23, 1–32, 2002.
Angelopoulos, V., Baumjohann, W., Kennel, C. F., Coronti, F. V., Kivelson, M. G., Pellat, R., Walker, R. J., Luehr, H., and Paschmann, G.: Bursty bulk flows in the inner central plasma sheet, J. Geophys. Res., 97, 4027–4039, 1992.
Balogh, A., Carr, C. M., Acu˜na, M. H., Dunlop, M. W., Beek, T. J., Brown, P., Fornacon, H., Georgescu, E., Glassmeier, K.-H., Harris, J., Musmann, G., Oddy, T., and Schwingenschuh, K.: The Cluster Magnetic Field Investigation: overview of in-flight performance and initial results, Ann. Geophys., 19, 1207–1217, 2001, http://www.ann-geophys.net/19/1207/2001/.
Birn, J., Raeder, J., Wang, Y. L., Wolf, R. A., and Hesse, M.: On the propagation of bubbles in the geomagnetic tail, Ann. Geophys., 22, 1773–1786, 2004,
http://www.ann-geophys.net/22/1773/2004/.
Carr, C., Brown, P., Zhang, T. L., Gloag, J., Horbury, T., Lucek, E., Magnes, W., O’Brien, H., Oddy, T., Auster, U., Austin, P., Ay-dogar, O., Balogh, A., Baumjohann, W., Beek, T., Eichelberger, H., Fornacon, K.-H., Georgescu, E., Glassmeier, K.-H., Ludlam, M., Nakamura, R., and Richter, I.: The Double Star magnetic field investigation: instrument design, performance and high-lights of the first year’s observations, Ann. Geophys., 23, 2713– 2732, 2005, http://www.ann-geophys.net/23/2713/2005/. Chen, C. X. and Wolf, R. A.: Interpretation of high-speed flows in
the plasma sheet, J. Geophys. Res., 98, 21409–21419, 1993. Chen, C. X. and Wolf, R. A.: Theory of thin-filament motion in
Earth’s magnetotail and its application to bursty bulk flows, J. Geophys. Res., 104, 14613–14626, doi:10.1029/1999JA900005, 1999.
Chisham, G., Lester, M., Milan, S. E., Freeman, M. P., Bristow, W. A., Grocott, A., McWilliams, K. A., Ruohoniemi, J. M., Yeoman, T. K., Dyson, P. L., Greenwald, R. A., Kikuchi, T., Pinnock, M., Rash, J. P. S., Sato, N., Sofko, G. J., Villain, J.-P., and Walker, A. D. M.: A decade of the Super Dual Auro-ral Radar Network (SuperDARN): scientific achievements, new techniques and future directions, Surv. Geophys., 28, 33–109, doi:10.1007/s10712-007-9017-8, 2007.
Cowley, S. W. H.: Magnetospheric asymmetries associated with the y-component of the IMF, Planet. Space. Sci., 29, 79–96, doi: 10.1016/0032-0633(81)90141-0, 1981.
Cowley, S. W. H. and Lockwood, M.: Excitation and decay of so-lar wind-driven flows in the magnetosphere-ionosphere system, Ann. Geophys., 10, 103–115, 1992.
Dungey, J. W.: Interplanetary magnetic field and the auroral zones, Phys. Rev. Let., 6, 47–48, 1961.
Dunlop, M. W., Balogh, A., Glassmeier, K.-H., and Robert, P.: Four-point Cluster application of magnetic field analysis tools: The Curlometer, J. Geophys. Res., 107, 1384–1397, 2002. Erickson, G. M. and Wolf, R. A.: Is steady convection possible in
the earth’s magnetotail, Geophys. Res. Lett., 7, 897–900, 1980. Fazakerley, A. N., Carter, P. J., Watson, G., Spencer, A., Sun, Y.
Q., Coker, J., Coker, P., Kataria, D. O., Fontaine, D., Liu, Z. X., Gilbert, L., He, L., Lahiff, A. D., Mihalˇciˇc, B., Szita, S., Taylor, M. G. G. T., Wilson, R. J., Dedieu, M., and Schwartz, S. J.: The Double Star Plasma Electron and Current Experiment, Ann. Geophys., 23, 2733–2756, 2005,
http://www.ann-geophys.net/23/2733/2005/.
Fazakerley, A. N., Lahiff, A. D., Rozum, I., D., K., Bacai, H., Anekallu, C., West, M., and ˚Asnes, A.: Cluster PEACE In-Flight Calibration Status, in: Proceedings of the 15th Cluster Workshop and CAA School, edited by: Laakso, H. and Escoubet, C. P., ESA, Springer, in press, 2009.
Forsyth, C., Lester, M., Cowley, S. W. H., Dandouras, I., Fazaker-ley, A. N., Fear, R. C., Frey, H. U., Grocott, A., Kadokura, A., Lucek, E., R`eme, H., Milan, S. E., and Watermann, J.: Observed tail current systems associated with bursty bulk flows and auroral streamers during a period of multiple substorms, Ann. Geophys., 26, 167–184, 2008, http://www.ann-geophys.net/26/167/2008/. Frey, H. U. and Mende, S. B.: Substorm onsets as observed by
IMAGE-FUV, Proc. 8th Int. Conf. Substorms, pp. 71–75, 2006. Greenwald, R. A., Baker, K. B., Dudeney, J. R., Pinnock, M.,
Jones, T. B., Thomas, E. C., Villain, J.-P., Cerisier, J.-C., Se-nior, C., Hanuise, C., Hunsucker, R. D., Sofko, G., Koehler, J., Nielsen, E., Pellinen, R., Walker, A. D. M., Sato, N., and Yam-agishi, H.: Darn/Superdarn: A Global View of the Dynamics of High-Lattitude Convection, Space Sci. Rev., 71, 761–796, doi: 10.1007/BF00751350, 1995.
Grocott, A., Cowley, S. W. H., and Sigwarth, J. B.: Ionospheric flow during extended intervals of northward but By -dominated IMF, Ann. Geophys., 21, 509–538, 2003,
http://www.ann-geophys.net/21/509/2003/.
Grocott, A., Yeoman, T. K., Milan, S. E., and Cowley, S. W. H.: Interhemispheric observations of the ionospheric signature of tail reconnection during IMF-northward non-substorm intervals, Ann. Geophys., 23, 1763–1770, 2005,
http://www.ann-geophys.net/23/1763/2005/.
Grocott, A., Yeoman, T. K., Milan, S. E., Amm, O., Frey, H. U., Juusola, L., Nakamura, R., Owen, C. J., R`eme, H., and Takada, T.: Multi-scale observations of magnetotail flux transport dur-ing IMF-northward non-substorm intervals, Ann. Geophys., 25, 1709–1720, 2007, http://www.ann-geophys.net/25/1709/2007/. Johnstone, A. D., Alsop, C., Burge, S., Carter, P. J., Coates, A. J.,
Coker, A. J., Fazakerley, A. N., Grande, M., Gowen, R. A., Gur-giolo, C., Hancock, B. K., Narheim, B., Preece, A., Sheather, P. H., Winningham, J. D., and Woodliffe, R. D.: Peace: a Plasma Electron and Current Experiment, Space Sci. Rev., 79, 351–398, 1997.
Fuselier, S. A., Gerard, J.-C., Gladstone, R., Murphree, S., and Cogger, L.: Far ultraviolet imaging from the IMAGE spacecraft. 1. System design, Space Sci. Rev., 91, 243–270, 2000.
Nakamura, R., Baumjohann, W., Mouikis, C., Kistler, L. M., Runov, A., Volwerk, M., Asano, Y., V¨or¨os, Z., Zhang, T. L., Klecker, B., R`eme, H., and Balogh, A.: Spatial scale of high-speed flows in the plasma sheet observed by Cluster, Geophys. Res. Lett., 31, 9804, doi:10.1029/2004GL019558, 2004. Nakamura, R., Amm, O., Laakso, H., Draper, N. C., Lester, M.,
Grocott, A., Klecker, B., McCrea, I. W., Balogh, A., R`eme, H., and Andr´e, M.: Localized fast flow disturbance observed in the plasma sheet and in the ionosphere, Ann. Geophys., 23, 553–566, 2005, http://www.ann-geophys.net/23/553/2005/.
Pontius Jr., D. H. and Wolf, R. A.: Transient flux tubes in the ter-restrial magnetosphere, Geophys. Res. Lett., 17, 49–52, 1990. R`eme, H., Aoustin, C., Bosqued, J. M., Dandouras, I., Lavraud,
B., Sauvaud, J. A., Barthe, A., Bouyssou, J., Camus, Th., Coeur-Joly, O., Cros, A., Cuvilo, J., Ducay, F., Garbarowitz, Y., Medale, J. L., Penou, E., Perrier, H., Romefort, D., Rouzaud, J., Vallat, C., Alcayd´e, D., Jacquey, C., Mazelle, C., d’Uston, C., M¨obius, E., Kistler, L. M., Crocker, K., Granoff, M., Mouikis, C., Popecki, M., Vosbury, M., Klecker, B., Hovestadt, D., Kucharek, H., Kuenneth, E., Paschmann, G., Scholer, M., Sckopke, N., Seiden-schwang, E., Carlson, C. W., Curtis, D. W., Ingraham, C., Lin, R. P., McFadden, J. P., Parks, G. K., Phan, T., Formisano, V., Amata, E., Bavassano-Cattaneo, M. B., Baldetti, P., Bruno, R., Chionchio, G., Di Lellis, A., Marcucci, M. F., Pallocchia, G., Ko-rth, A., Daly, P. W., Graeve, B., Rosenbauer, H., Vasyliunas, V., McCarthy, M., Wilber, M., Eliasson, L., Lundin, R., Olsen, S., Shelley, E. G., Fuselier, S., Ghielmetti, A. G., Lennartsson, W., Escoubet, C. P., Balsiger, H., Friedel, R., Cao, J.-B., Kovrazhkin, R. A., Papamastorakis, I., Pellat, R., Scudder, J., and Sonnerup, B.: First multispacecraft ion measurements in and near the Earths magnetosphere with the identical Cluster ion spectrometry (CIS) experiment, Ann. Geophys., 19, 1303–1354, 2001,
http://www.ann-geophys.net/19/1303/2001/.
Sergeev, V. A., Angelopoulos, V., Gosling, J. T., Cattell, C. A., and Russell, C. T.: Detection of localized, plasma-depleted flux tubes or bubbles in the midtail plasma sheet, J. Geophys. Res., 101, 10817–10826, doi:10.1029/96JA00460, 1996.
Sitnov, M. I., Guzdar, P. N., and Swisdak, M.: On the formation of a plasma bubble, Geophys. Res. Lett., 32, 16103, doi:10.1029/ 2005GL023585, 2005.
Slavin, J. A., Lepping, R. P., Gjerloev, J., Fairfield, D. H., Hesse, M., Owen, C. J., Moldwin, M. B., Nagai, T., Ieda, A., and Mukai, T.: Geotail observations of magnetic flux ropes in the plasma sheet, J. Geophys. Res., 108, 1015–1032, 2003.
Smith, C. W., L’Heureux, J., Ness, N. F., Acu˜na, M. H., Burlaga, L. F., and Scheifele, J.: The ACE Magnetic Fields Experiment, Space Sci. Rev., 86, 613–632, doi:10.1023/A:1005092216668, 1998.
Sonnerup, B. U. O. and Scheible, M.: Minimum and Maximum Variance Analysis, in: Analysis Methods for Multi-Spacecraft Data, edited by Paschmann, G. and Daly, P. W., pp. 185–220, ISSI, 1.1 edn., 2000.
Takada, T., Nakamura, R., Baumjohann, W., Asano, Y., Volwerk, M., Zhang, T. L., Klecker, B., R`eme, H., Lucek, E. A., and Carr, C.: Do BBFs contribute to inner magnetosphere dipolarizations: Concurrent Cluster and Double Star observations, Geophys. Res. Lett., 33, 21109, doi:10.1029/2006GL027440, 2006.
Tsyganenko, N. A. and Stern, D. P.: Modeling the global magnetic field of the large-scale Birkeland current systems, J. Geophys. Res., 101, 27187–27198, doi:10.1029/96JA02735, 1996. Volwerk, M., Louarn, P., Chust, T., Roux, A., de Feraudy, H.,
and Holback, B.: Solitary kinetic Alfv´en waves: A study of the Poynting flux, J. Geophys. Res., 101, 13335–13344, doi: 10.1029/96JA00166, 1996.
Walsh, A. P., Fazakerley, A. N., Wilson, R. J., Alexeev, I. V., Hen-derson, P. D., Owen, C. J., Lucek, E., Carr, C., and Dandouras, I.: Near-simultaneous magnetotail flux rope observations with Cluster and Double Star, Ann. Geophys., 25, 1887–1897, 2007, http://www.ann-geophys.net/25/1887/2007/.
Zhang, J.-C., Wolf, R. A., Sazykin, S., and Toffoletto, F. R.: In-jection of a bubble into the inner magnetosphere, Geophys. Res. Lett., 35, L02110, doi:10.1029/2007GL032048, 2008.