https://doi.org/10.5194/ars-16-215-2019
© Author(s) 2019. This work is distributed under the Creative Commons Attribution 4.0 License.
Analysis of the coupling of electromagnetic pulses
into shielded enclosures of vulnerable systems
Sven Fisahn, Sebastian Koj, and Heyno Garbe
Department of Electromagnetic Compatibility, Institute of Electrical Engineering and Measurement Technology, Leibniz Universität Hannover, 30167 Hanover, Germany
Correspondence:Sven Fisahn ([email protected])
Received: 28 January 2018 – Revised: 14 December 2018 – Accepted: 8 January 2019 – Published: 31 July 2019
Abstract. In order to predict the immunity to electromag-netic interference of vulnerable systems, not only the elec-tronic system but also its enclosure has to be taken into con-sideration. In this work, the coupling behavior of electro-magnetic pulses (EMP) and continuous wave (CW) signals into the shielded enclosure of a generic system is investi-gated by metrological and numerical methods. Since this en-closure forms an unwanted or parasitic cavity resonator, the enclosure‘s resonance behavior as well as the characteristic quantities, i.e., the resonance frequencies and corresponding quality factors are of great interest, too. The usage of an opti-cal field sensor reduces the influence of the measuring setup on the investigated system and thus, enables the analysis of the enclosure’s resonance behavior, which delivers revealing information about the dependence of the quality factor on the aperture size of the enclosure.
1 Introduction
Modern electronic systems should be highly reliable against various types of electromagnetic interferences in order to avoid malfunctions, which could lead to unexpected conse-quences if the functionality of such a system is critical to security. Thus, the knowledge of the system’s immunity is of great interest. Due to the complexity of a modern electronic system with many individual components and interconnec-tions, it is almost impossible to provide the required infor-mation based on a single analytical model. The identification of a system’s immunity is further complicated, as the enclo-sure of the overall system and possibly existing encloenclo-sures or housings of individual subsystems and components have to be taken into account, too. Since these enclosures and
hous-ings can form unwanted or parasitic cavity resonators, espe-cially if they are surrounded by surfaces with a high electric shielding effectiveness, not only the analysis of the coupling of transient and continuous wave (CW) signals into these en-closures is of interest, but also the investigation of the reso-nance behavior of these enclosures. As shown in Gronwald et al. (2004, 2007), Gronwald (2006, 2012), Nitsch et al. (2010) and Tkachenko et al. (2011, 2013) the topic of field coupling in antenna structures housed in metallic rectangular enclo-sures has been analyzed analytically and numerically in the past. A setup for metrological investigation of interference in rectangular enclosure was presented in Vogt et al. (2015), where measurements were carried out in the frequency do-main (FD). A consideration of the coupled fields in the time domain was performed i.e. in Kotzev et al. (2016).
cav-chapter, since the enclosure of the investigated generic sys-tem is made of metallic material with a high electric shield-ing effectiveness and forms an unwanted or parasitic cavity resonator.
2.1 Excitation of cavity resonators
Electromagnetic fields can couple into the interior of a cavity in three different ways and excite a certain field distribution. Hill et al. (1994) classifies the coupling mechanism by three types of penetration, which are aperture penetration, antenna penetration and diffusive penetration. The first type of pene-tration is caused by apertures in the cavity walls. Antenna penetration, also known as wire penetration, comes about wires penetrating the cavity walls without being connected to them. The diffusive penetration is effected by the finite shielding effectiveness (SE) of the cavity walls. In case of proper surfaces in the sense of the EMT (Baum, 1981, 1985), this coupling path either attenuates the incident field strongly or can be completely neglected (good shielding approxima-tion). As a general rule of thumb the SE is sufficiently high, when the thicknessd of cavity walls is larger than the skin depthδ, which is given by Jackson (2002) for a certain fre-quencyf by
δ=√ 1
π·f·µ·κ, (1)
whereκ andµare the electrical conductivity and the mag-netic permeability of the wall material, respectively. Typi-cally, this assumption is satisfied in the higher frequency range for metallic walls, since the skin depth decreases with increasing frequencies and becomes smaller than the wall thickness, thus most of the incoming electromagnetic energy is shielded by reflection and attenuation losses due to the cavity walls. However, the SE can also be quite low in the lower frequency range and enables diffusive penetration. It should be mentioned that magnetic fields below 100 kHz can be shielded only by highly permeable wall materials.
fmnp= s
f2 c,mn+
c0 2√µrεr
·p l
2
, (2)
wherelis the hight or rather length of the cavity,pis a non-negative integer number andfc,mnis the cut-off frequency of a certain mode propagating in a cylindrical waveguide. These cut-off frequencies are given by
fcTE,mn= c0 π√µrεr
·x 0 mn
D (3)
in case of the transverse electric modes (TEmn-Mode,Hmn -Mode) and by
fcTM,mn= c0 π√µrεr
·xmn
D (4)
in case of the transverse magnetic modes (TMmn-Mode, Emn-Mode). In these equations,D is the interior diameter of the waveguide and m and n are non-negative integers. Further,xmn andxmn0 are thenth roots of the Bessel func-tionJmn(x)and its derivativeJmn0 (x). Furthermore,εr and
µrare the relative permittivity and permeability of the ma-terial inside the waveguide, respectively andc0is the speed of light in the vacuum. It is obvious, that the resonance fre-quencies equal the corresponding cut-off frefre-quencies in those cases withp=0. In general, the cut-off frequencies deter-mine the lower limit for all resonance frequencies that may occur independently of the quotientp/ l. The resonance fre-quencies of transverse electric and magnetic modes are given by
fmnpTE = c0 2√µrεr
· s
2x0 mn Dπ
2 +p
l 2
, (5)
fmnpTM = c0 2√µrεr
· s 2x mn Dπ 2 +p
l 2
. (6)
Table 1.Calculated resonance frequencies of a hollow cylinder tube withD=100 mm andl=1000 mm,fmnpin GHz.
Mode fmn p=0 p=1 p=2 p=3 p=4 p=5 p=6 p=7 p=8 p=9 p=10
TE11 1.757 1.757 1.763 1.782 1.814 1.856 1.910 1.974 2.046 2.127 2.215 2.310 TM01 2.295 2.295 2.300 2.314 2.338 2.372 2.414 2.465 2.523 2.589 2.662 2.741 TE21 2.915 2.915 2.918 2.930 2.949 2.976 3.009 3.050 3.098 3.152 3.212 3.277 TE01 3.656 3.656 3.660 3.669 3.684 3.705 3.732 3.765 3.804 3.848 3.897 3.952 TM11 3.656 3.656 3.660 3.669 3.684 3.705 3.733 3.765 3.804 3.848 3.897 3.952 TE31 4.009 4.009 4.012 4.020 4.034 4.054 4.079 4.109 4.144 4.185 4.230 4.280 TM21 4.901 4.901 4.903 4.910 4.921 4.937 4.958 4.983 5.012 5.045 5.083 5.125 TE41 5.074 5.074 5.077 5.083 5.094 5.110 5.129 5.153 5.182 5.214 5.251 5.291 TE12 5.088 5.088 5.090 5.096 5.107 5.123 5.143 5.167 5.195 5.227 5.263 5.304 TM02 5.268 5.268 5.270 5.276 5.287 5.302 5.321 5.344 5.371 5.402 5.438 5.477 TM31 6.088 6.088 6.090 6.096 6.105 6.118 6.134 6.154 6.178 6.205 6.236 6.270 TE51 6.122 6.122 6.124 6.130 6.139 6.152 6.168 6.188 6.211 6.239 6.269 6.303 TE22 6.399 6.399 6.401 6.406 6.415 6.427 6.443 6.462 6.485 6.511 6.540 6.573 TE02 6.695 6.695 6.696 6.701 6.710 6.722 6.737 6.755 6.776 6.801 6.829 6.861
of Table 1 labelled by Mode and fmn list the TEmn-Modes and TMmn-Modes, respectively, as well as their correspond-ing cut-off-frequencies, which underlie the resonances fre-quencies according to Eqs. (2), (5) and (6). The following columns contain the calculated frequencies forp=0 . . . 10. Consequently, to give an example,f214TE=2.976 GHz is listed as an example in the seventh column (labelled byp=4) of row beginning with TE21.
2.2.2 Quality factor
The second characteristic electric quantity of a resonator is the quality factorQ, which is defined by Jackson (2002) by the following Eq. (7) and includes the averaged steady-state energyWstored in the cavity and the dissipation lossesP:
Q=2π·fres·
W P =
fres
B3 dB
. (7)
In general, it is more reasonable to measure the resonance frequency and the corresponding 3 dB-bandwidth B3 dB in order to determine the quality factor. The quality factor is a combination of different individual contributions (e.g. Hill et al., 1994). It comprises four contributions:
1
Q=
1
Q1
+ 1
Q2 + 1
Q3
+ 1
Q4
. (8)
In Eq. (8), Q1 represents the losses of the cavity wall and
Q2the losses effected by the loading of the cavity (e.g. lossy dielectrics and other materials). The contributionQ3 consid-ers the losses because of aperture radiation from the cavity to the surroundings. Additional losses caused by field probes or antennas are represented byQ4. The total quality factor is dominated by the smallest individual quality factorQi, where
i= {1, . . . , 4}.
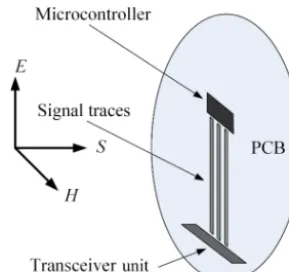
Figure 1.Principle built up of the generic system.
3 Investigated generic system
The coupling behavior of transient and CW signals into shielded enclosures of vulnerable systems is examined by means of a generic system described in this section. It con-sists of a metallic enclosure possessing the shape of a long cylinder, which is equipped with a microcontroller board and two wires serving as a model for cabling. The generic sys-tem is also illustrated by a topological description, i.e., by its electromagnetic topology (EMT) model. Since the coupling to the shielded enclosure is the main focus of this contribu-tion, the description of the microcontroller board as well as the essential findings concerning its susceptibility are pre-sented for information purposes mainly.
3.1 Description of the generic system
Figure 2. Principle built up of the generic microcontroller board (GMB).
and closed with a metallic end cap on the other. The apertures are realized by a metallic disk with a centric hole. In order to change the aperture size in a range fromDA=10 . . . 100 mm with an incremental step of 10 mm, different apertures can be mounted to the tube. Since the discs with the apertures as well as the end cap are manufactured of aluminum with a thicknessdd=10 mm, the walls of this enclosure have a high level of shielding effectiveness, such that this enclosure meets the criteria of a proper volume in the sense of EMT (Baum, 1981, 1985).
As electronic part of the vulnerable system serves a GMB that has been developed for the investigation of the cou-pling behavior of transient signals into signal traces (Fisahn and Garbe, 2009a, b). Typically, it is placed inside the alu-minum enclosure in a distance ofsGMB=250 mm from the aperture as shown in Fig. 1. Essentially, the GMB is a the battery powered printed circuit board (PCB) which contains the three functional groups microcontroller, transceiver unit for control purposes via a fiber optic link and signal traces, which represent the structure signals may couple into. A spe-cial test program is running on the microcontroller and pro-vides the determination of the breakdown failure rate (BFR) of the GMB. The principle buildup of the GMB is illustrated in Fig. 2. Since the coupling into the shielded enclosure as well as the resonance behavior are analyzed in this contribu-tion and not the immunity of the overall system, the GMB is replaced by an optical field probe during the measurements described in Sects. 4 and 5. Beside the aluminum enclosure and the GMB, the EUT consists of two wires, which serve as a model for cabling. Wire 1 is placed in longitudinal direc-tion inside the tube and connected via a 50resistor to the metallic end cap, whereas wire 2 penetrates the enclosure in vertical direction as shown in Fig. 1. Wire 2 is not electrically connected with the enclosure.
3.2 EMT model of the generic system
In order to illustrate the coupling paths into the generic sys-tem described in Sect. 3.1, the corresponding EMT model
Figure 3.Topological model of the generic system.
of this system is set up in this section. The principles of the EMT are described in Baum (1981, 1985). As usual in EMT models, the wire penetration is modeled by the conducted in-teraction graph, whereas both aperture penetration as well as diffusive penetration are modeled by the radiated interaction graph. Figure 3 shows a possible topological model of the generic system using the volume’s designations described in Fisahn et al. (2017), i.e., proper surfaces with a high level of shielding effectiveness (SE) are illustrated by solid lines, whereas elementary surfaces without or just a low level of SE are illustrated by dashed lines. Furthermore, conducted and radiated interactions are illustrated by red or blue lines, respectively.
Inserting the characteristic material parameter of alu-minum in Eq. (1) leads approximately to the skin depth
δAl=82 mm/ √
en-closure, i.e., the tube is terminated in V1,4with an end cap, where reflections may occur.
The interaction graph describes the possible conducted and radiated interactions. In Fig. 3, the red lines illustrate the conducted interactions due to the two wires. Wire 1 is placed completely inside the proper volume from subvol-ume V1,1 to V1,4 and interconnects them, whereas wire 2 passes the subvolumes V0,2, V1,3 and V0,3 and penetrates the proper surface. The radiated emissions are illustrated by blue lines interconnecting all subvolumes, which have the same shielding order. Since the enclosure is nearly com-pletely surrounded by proper surfaces, it forms a proper vol-ume. The radiated interactions can only overcome this barrier by coupling through the aperture. This aperture penetration betweenV0,1andV1,1is illustrated by the blue ellipse.
It has to be pointed out, that the electromagnetic climate in subvolumeV1,2is of significant importance with respect to the immunity of the complete system, because the GMB, i.e., the electronic part of the system is located here. Disturbing signals from the surroundingV0,1can reachV1,2on two dif-ferent paths. The first one is the direct path viaV1,1, whereas the disturbing signal penetrates the enclosure or rather the proper surface by aperture penetration. The second path pro-ceeds via the subvolumesV0,2andV0,3, where the signal cou-ples to wire 2, then, it is guided toV1,3by wire 2. From here, the signal can reachV1,2by coupling to wire 1 or by radia-tion.
3.3 Coupling effects of different signals to the GMB
Since the coupling effects and the susceptibility of the GMB in a non shielded environment are not the main focus of this contribution, the essential findings obtained in former investigation are summarized in this section for informa-tion purposes mainly. Nevertheless, they are useful in order to enable an estimation and prediction of the susceptibility of the overall system. As already published in Fisahn and Garbe (2009a, b, 2010), the applied electromagnetic pulses with double exponential unipolar shape, i.e., NEMP and UWB pulses show a completely different coupling behav-ior into the signal traces of the GMB. In case of the NEMP with a rise time and a pulse duration at half maximum of ap-prox. tr=1.5 ns andtf whm=80 ns, the coupling increases with an increasing length of the signal traces, whereas the coupling behavior of UWB pulses with tf whm=80 ns and tr=100 ps is opposite. The obvious reason for this is the spectral content of both pulses compared to the geometrical dimensions of the GMB. The signal traces of the GMB show a derivative action (gain of 20 dB per decade) in the sense of system theory in the frequency range below a certain cut-off-frequency and resonance behavior in the range above. Con-sidering signal trace lengths oflt=40 . . . 80 mm the lowest cut-off frequency is approx. 750 MHz and increases with a decreasing length of the signal traces. Since the NEMP cov-ers only a frequency range up to approx. 300 MHz (Giri
and Tesche, 2004), it couples into the GMB in the fre-quency range where the signal traces show a derivative ac-tion. In this range, the coupling efficiency increases with the length of the GMB traces. In contrast to this, an UWB pulse covers a larger frequency range up to several GHz, where the GMB shows resonant behavior and the coupling behav-ior is not linearly dependent on the GMB trace length any longer. Susceptibility investigations carried out in a GTEM cell show, that both, the NEMP pulse with an electric field strength amplitude of approx. EˆEMP≈35 kV m−1 and the UWB pulse with EˆUWB≈1.5 kV m−1 can cause perturba-tions and breakdowns of the GMB, or more precisely, the microcontroller. However, the NEMP can also effect physical damages (destructions) of the microcontroller forEˆEMP> 50 kV m−1.
4 Coupling behavior of transient signals into a shielded enclosure
The EMT model, which was set up in Sect. 3.2, illustrates, that there are two principle coupling paths from the surround-ingsV0,1to the most critical subvolumeV1,2, where the elec-tronic part of the system, i.e., the GMB is typically placed. Previous investigations by Fisahn and Garbe (2007a, b) and Fisahn et al. (2007) in the frequency domain (FD) already pointed out, that the contribution of the coupling path, which includes the conducted interaction graph of wire 2, is sev-eral times smaller than the direct coupling path via subvol-umeV1,1. Thus, wire 2 and the corresponding conducted in-teraction graph are not of interest in further considerations, which simplifies the analysis of the coupling into shielded enclosures. As a consequence of Eq. (8), the loading of the cavity due to lossy dielectrics and other materials decreases the partial quality factorQ2as well as the total quality fac-torQ, sinceQis dominated by the smallest individual qual-ity factorQi. To avoid a decrease ofQ, the GMB as well as wire 1 are also removed during the measurements of the resonance effects.
4.1 Measurement setup
The measurements of the coupling behavior of signals into shielded enclosures are carried out in a GTEM cell in the time domain (TD) and in the frequency domain (FD) by means of the EUT described in Sect. 3.1. To this end, the electric field strength is measured inside the metallic en-closure (proper volume) in subvolumeV1,2in a distance of 250 mm from the aperture.
Figure 4.Generic system (hollow cylinder) in the GTEM cell.
Figure 5.Measured time behaviour of NEMP and UWB pulse (time shiftts=100 ns andts=5 ns).
are carried out in TD and FD as well. In case of the TD mea-surements the cell port is fed by pulse sources, which provide NEMP and UWB pulses, whereas the internal signal ator of a vector network analyzer (VNA) or tracking gener-ator of an EMI receiver feeds the cell port with CW signals in case of the FD measurements. As a second consequence of Eq. (8), loading of the cavity by inserting a field sensor decreases the partial quality factor Q4 as well as the total quality factor Q. Thus, the electric field strength inside the EUT is measured with a very small active field probe, which is connected to its control via an optical link. The field probe is very well suited for the measurement of electric fields with a maximum amplitude ofEmax=50 V m−1in the frequency range from 250 kHz to 3 GHz, but also enable measurements beyond 3 GHz when accepting a small variation of the an-tenna factor. The field probe’s signal or rather the output sig-nal of its control unit is recorded by a digital sampling os-cilloscope (DSO) in case of TD measurements and with the VNA or the EMI receiver in case of FD measurements. Due to the choice of the active field probe and its optical control, it does not change the topological model illustrated in Fig. 3, whereas a typical field probe with an electric cable would form an additional coupling path to the interior of the cavity due to the cable.
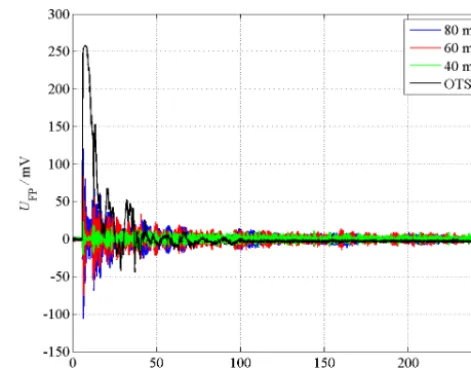
Figure 6. Output voltage of the field probe (measurement with UWP pulses).
4.2 Measurement results
4.2.1 Measurement results in time domain
Figure 5 shows the measured time behavior of the electro-magnetic pulses used for the measurements in the time do-main and which are fed into GTEM cell port. The charac-teristic time parameters of the NEMP are its rise time of approx. tr=1.5 ns, its pulse duration at half maximum of approx. tfwhm=80 ns and its amplitude of approx. UˆS= 20.5 V. The time behavior of the UWB pulse looks similar, whereas its characteristic parameters are approx.tr=100 ps,
Figure 7.Output voltage of the field probe in the time range below 30 ns (measurement with UWP pulses).
pulses into the EUT equipped with different aperture sizes are also shown Fig. 6. The shape of the sensor voltage is now completely changed, since multiple reflections between the ends of the tube occur. Figure 7 shows a zoomed view of the same measurements in the time range from 5 to 30 ns. While the maximum value of the sensor voltageUFP,maxis reduced to 23.0 mV for DA=40 mm, the total duration of the time response increases to more than 500 ns. Furthermore, a first reflection occurs after 5 ns. Further results are shown for an EUT equipped with an aperture size ofDA=60 and 80 mm. The maximum sensor voltages increase to 84.6 mV or rather 120.5 mV, while the total duration of the time response de-creases below 200 ns. In Fig. 8, the dependency of the mea-sured maximum sensor voltageUFP,maxon the apertureDA size is illustrated. It comes out, that the sensor voltage in-creases with the aperture size. The highest growth occurs for 40 mm≤DA≤70 mm. However, the total duration of the sensor signal decreases for increasing aperture sizes. In con-trast to the measurements with the UWB pulses, the mea-sured sensor voltage is several times smaller and near to the noise floor of the DSO, when performing the measurements with an EMP. Thus, it seems to be reasonable to carry out additional measurements in FD, since the dynamic range of a VNA or an EMI receiver is many times larger than the one of a DSO.
4.2.2 Measurement results in frequency domain FD measurements are carried out with a VNA in the fre-quency range up to 5 GHz. The upper frefre-quency is deter-mined by the limited frequency range of the field probe. The measured electric field strengthEEUTinside the EUT is normalized to the exciting electric fieldEOTSin logarithmic scale. Figure 9 shows the measured
Figure 8.Maximum output voltage of field probe placed in the en-closure with the aperture sizeDA.
Figure 9.Measured transfer function between cell port and field probe output in the frequency range up to 5 GHz.
Gain=20·log(EEUT/EOTS)dB (9)
Figure 10.Measured transfer function between cell port and field probe output in the frequency range 1.5 to 3 GHz.
shows a zoomed view of these measurement results from 1.5 to 3 GHz.
4.3 Verification of measurement results 4.3.1 Numerical field calculations
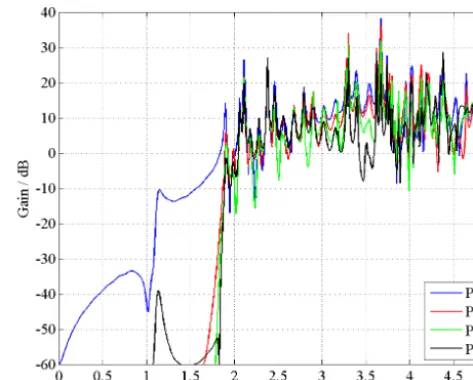
In order to validate the measurement results, the field distri-bution inside the EUT is simulated with the numerical field calculation program CONCEPT-II. The program is based on the method of moments (MoM) and works in FD. The hol-low cylinder is modeled as an enclosure with perfectly elec-trically conducting (PEC) walls with an aperture at one side and closed with an end cap on the other. The aperture di-ameter is DA=5 mm. The calculated values are also nor-malized to the exciting electric field in logarithmic scale in order to keep them comparable to the measurement re-sults. Figure 11 shows the numerical calculated electric field strength or, more precisely the gain in four different observa-tion points. While P2 is an observaobserva-tion point near to the aper-ture, which is located in subvolumeV1,1of the EMT model described in Sect. 3.2, the point P8 is located in the most crit-ical subvolumeV1,2in a distance of 250 mm to the aperture and complies with the position of the field probe. In obser-vation point P2 (blue line) significant electric field strength values occur for frequencies above 1.05 GHz, whereas the field strength values in point P8 (green line) as well as in the P14 and P20 are negligibly small below 1.75 GHz, but then arise abruptly at approximately 1.75 GHz. In the fre-quency range above 1.75 GHz resonances occur at certain frequencies. The simulation results agree very well with the FD measurements presented in Sect. 4.2.2. Additionally, sur-face plots of the field distribution inside and outside the hol-low cylinder are calculated for certain frequencies. Figure 12
Figure 11.Simulated electric field strength at different observation points inside the EUT.
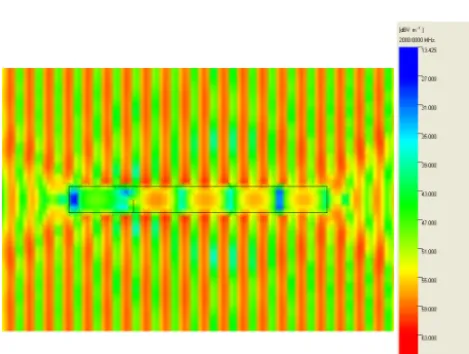
shows the field distribution for the frequency 1 GHz, where the incident TEM wave propagates from the left side to the right one. While the wave propagation outside the hollow cylinder is nearly unaffected due to its presence, the inte-rior is nearly field-free. In contrast, significant field strength values can be detected for the frequency 2 GHz inside the hollow cylinder as well as field disturbances in front of the aperture (see Fig. 13).
The presence of wire 1 is investigated also by simulation, since this aspect was neglected during the measurements. Therefore, the wiring in longitudinal direction is modeled, as already shown in Fig. 14. The simulations are carried out for 4 different distances dw between the beginning of the wire and the aperture. In comparison to the setup without the wire, the electric field strength values are several times higher in the frequency range below 1.75 GHz (see Fig. 14). The smaller the distancesdw, the higher are the electric field strength values.
4.3.2 Analytical considerations
The investigations of the coupling behavior of signals into proper volumes by metrological and numerical methods point out, that the metallic hollow cylinder behaves like a cylindrical waveguide. Below the first cut-off frequency
Figure 12.Simulated electric field distribution for 1 GHz.
Figure 13.Simulated electric field distribution for 2 GHz.
second possible mode (TM01-Mode). Thus, fields from the surrounding volumeV0,1can couple into the critical subvol-umeV1,2. While the enclosure wall consist of highly electri-cally conductive material, the hollow cylinder forms a cavity with high quality factorQ, and only losses due to aperture ra-diation to the surroundings effect a decrease ofQin the main, which are represented by the contributionQ3in Eq. (8). The simulated field distribution in Fig. 14 shows on the one hand, that aperture penetration occurs, because of the field distor-tion in front of the aperture due to the superposidistor-tion of the incident and the radiated field. On the other hand, standing waves appear inside the hollow cylinder due to multiple re-flections between both ends. The measurements in the time domain show the wave propagation inside the hollow cylin-der and the multiple reflections as well. The first reflection occurs after 5 ns (see Fig. 7). Since the distance between the field probe and the metallic end cap isdt=0.75 m, the prop-agating pulse needst=2·dt/c0=5 ns for the way to the end cap and back.
Figure 14.Simulated electric field strength at observation point P8, the enclosure is equipped with a wire in longitudinal direction.
5 Investigation of resonance effects
The FD measurements described in Sect. 4.2.2 already pointed out, that resonance effects occur at certain frequen-cies above 1.7 GHz. The resonance effects are investigated in more detail in this section. Therefore, additional FD mea-surements are carried out with an EMI receiver instead of the VNA, since the EMI receiver is equipped with many helpful marker functions, for instance the measurement of the 3 dB-bandwidthB3 dB.
Figure 15 shows an exemplary measurement performed in the frequency range from 1 up to 3 GHz for an aperture size ofDA=40 mm. Here, the power level LFP,EUT at the out-put of the optical field probe is measured. Taking the power level of a corresponding OTS measurementLFP,OTSinto ac-count, which is approx. −53 dBm±3 dB in the frequency range from 200 kHz to 4 GHz, delivers the
Gain= LFP,EUT/dBm−LFP,OTS/dBm
dB. (10)
mea-Figure 15.Measured field probe signal, the field probe is positioned inside the enclosure withDA=40 mm.
sured for the TE116-resonace, where the characteristic values aref116TE=1.956 GHz andQ=8554.5.
Lastly, the effect of the aperture size is investigated. In-creasingDAleads to a small decrease of the resonance fre-quency as well as to a significant decrease of the quality fac-tor. Table 3 includes the measurement results for the TE114-resonance. Whilef114TEdecreases only by 1.1 %, theQ-factor is reduced by the factor 40. This result seems to be sensi-ble, because the losses due to aperture radiation to the sur-roundings increase with an increasing aperture size, which leads to a decreasing contribution Q3in Eq. (8) and, con-sequently, to a decrease of the total quality factor Q. Fur-thermore, the highest gain and thus the highest field am-plitudes do not occur for the largest aperture size, but for
DA=50 mm. The corresponding gain is 26 dB higher than for the largest aperture size. The evaluation of all measure-ments points out, that the highest gain is detected for aper-ture sizes of DA=50 . . . 70 mm. Both essential results, the maximum for the gain in case of medium sized apertures (DA=50 . . . 70 mm) as well as the decreasingQ-factor for increasing apertures sizes can be also seen in Figs. 9 and 10, since higherQfactors are characterized by smaller resonance peaks.
70 1.834 1.856 0.022 720.1 22.09
80 1.834 1.856 0.022 275.5 19.10
90 1.834 1.856 0.022 183.7 17.48
Figure 16.Measurement of the quality factor, the field probe is po-sitioned inside the enclosure withDA=40 mm.
6 Conclusion
by an optical field sensor in this volume, since this pulse contains spectral components above the cut-off frequency. In this case, the maximum value of the sensor signal increases with the aperture size, whereas the total duration of this sig-nal becomes smaller. The findings are validated by additiosig-nal measurements in the frequency domain and numerical field calculations.
Additionally, the resonance behavior of the enclosure is characterized by the specific quantities resonance fre-quency fres and corresponding quality factor Qdepending on the aperture size. It can be shown, that the quality fac-tor decreases with an increasing aperture size. An interesting aspect is, that the highest field amplitudes at a certain reso-nance frequency occur neither for the smallest aperture size, which has the highest quality factor, nor for the largest aper-ture size, which has the highest field values in case of pulse excitation. However, the largest field amplitude at a certain resonance frequency is detected at medium size apertures of
DA=50 . . . 70 mm, thus critical aperture sizes can be de-fined. The presented method and results deliver revealing in-formation about the coupling behavior of transient signals into a proper volume and can be used for deriving appro-priate countermeasures in order the ensure the immunity of vulnerable systems.
Data availability. All data presented in this article are available from the corresponding author upon request.
Competing interests. The authors declare that they have no conflict of interest.
Special issue statement. This article is part of the special issue “Kleinheubacher Berichte 2017”. It is a result of the Klein-heubacher Tagung 2017, Miltenberg, Germany, 25–27 Septem-ber 2017.
The publication of this article was funded by the Open Access Fund of the Leibniz Association.
Edited by: Frank Gronwald
Reviewed by: two anonymous referees
References
Baum, C. E.: Electromagnetic topology: A formal approach to the analysis and design of complex electronic systems, in: Proceed-ings of the 4th International Zurich Symposium on Electromag-netic Compatibility, 10–12 March 1981, Zurich, Switzerland, 209–214, 1981.
Baum, C. E.: On the Use of Electromagnetic Topology for the Decomposition of Scattering Matrices for Complex Physical Structures, Interaction Note 454, 1 July 1985, SUMMA Foun-dation, available at: http://eceresearch.unm.edu/summa/notes/In/ 0454.pdf (last access: 29 January 2019), 1985.
Fisahn, S. and Garbe, H.: Protective properties of a missile enclo-sure against electromagnetic influences, Adv. Radio Sci., 5, 63– 67, https://doi.org/10.5194/ars-5-63-2007, 2007a.
Fisahn, S. and Garbe, H.: Coupling of transient electromagnetic fields to a generic missile enclosure via aperture and wire pen-etration, in: Proceedings of the EMC Europe, 13–15 June 2007, Paris, France, 2007b.
Fisahn, S. and Garbe, H.: Differences in the Coupling Behavior of Fast Transient Pulses to short PCB Traces, in: Proceedings of the 2009 International Symposium on Electromagnetic Compatibil-ity Kyoto (EMC 2009 Kyoto), 20–24 July 2009, Kyoto, Japan, 361–364, 2009a.
Fisahn, S. and Garbe, H.: Special Coupling Effects of UWB Pulses to Short Signal Traces, in: Proceedings of the IEEE Interna-tional Symposium on Electromagnetic Compatibility, 17–21 Au-gust 2009, Austin, Texas, USA, 231–236, 2009b.
Fisahn, S. and Garbe, H.: Unterschiedliches Einkoppelverhalten von (N)EMP- und UWB-Impulsen in kurze Leiterbahnen, in: Proceedings Internationale Fachmesse und Kongress für Elek-tromagnetische Verträglichkeit, 9.–11. März 2010, Düsseldorf, Germany, 63–70, 2010.
Fisahn, S., Sabath, F., and Garbe, H.: Protective Properties of a Generic Missile Enclosure to different Electromagnetic Influ-ences, in: Proceedings of the IEEE International Symposium on Electromagnetic Compatibility, 8–13 July 2007, Honolulu, Hawaii, USA, 1–6, 2007.
Fisahn, S., Koj, S., and Garbe, H.: Modelling of Multi-Megawatt Wind Turbines for EMI and EMS Investigations by a Topological Approach, in: Proceedings of the 2017 32nd General Assembly and Scientific Symposium of the International Union of Radio Science, 19–26 August 2017, Montreal, QC, Canada, 1–4, 2017. Giri, D. V. and Tesche, F. M.: Classification of Intentional Elec-tromagnetic Environments (IEME), IEEE T. Electromag. Com-patib., 46, 322–328, 2004.
Gronwald, F.: On the applicability of conventional transmis-sion line theory within cavities, Adv. Radio Sci., 4, 117–123, https://doi.org/10.5194/ars-4-117-2006, 2006.
Gronwald, F.: Iterative Solution of a Nonlinear Antenna Problem In-side a High-Quality Resonating Chamber, in: Proceedings IEEE EMC Europe Symposium, 17–21 September 2012, Rome, Italy, 2012.
Gronwald, F., Blume, E., and Nitsch, J.: Computation of the fre-quency response of a nonlinearly loaded antenna within a cav-ity, Adv. Radio Sci., 2, 57–62, https://doi.org/10.5194/ars-2-57-2004, 2004.
Kotzev, M., Kreitlow, M., and Gronwald, F.: Transient Excita-tion of Nonlinearly Loaded Resonators and ObservaExcita-tion of Sys-tem Responses in Time Domain, in: Proc. of the 2016 Inter-national Symposium on Electromagnetic Compatibility – EMC EUROPE 2016, 5–9 September 2016, Wroclaw, Poland, 2016.
Tkachenko, S., Rambousky, R., and Nitsch, J.: Electromagnetic field coupling to a thin wire located symmetrically inside a rect-angular enclosure, IEEE T. Electromag. Compatib., 55, 334–341, 2013.