SOIL PHOSPHORUS AVAILABILITY DIFFERENCES BETWEEN
SPRINKLER AND FURROW IRRIGATION
Jim Ippolito and Dave Bjorneberg
Research Soil Scientist and Research Leader/Agricultural Engineer, USDA-Agricultural Research Service, Kimberly, ID
ABSTRACT
Water flowing in irrigation furrows detaches and transports soil particles and subsequently nutrients such as phosphorus (P). To reduce the risk of erosion and offsite P transport, producers in south-central Idaho have been converting from furrow to sprinkler irrigation. We completed research on soil P dynamics in furrow versus sprinkler irrigated soils from four paired-fields in the region. Surface soils (0-2.5 inches) were obtained from fields in September following barley harvest. Furrow irrigated soils contained 38 parts per million (ppm) of plant-available P (i.e. Olsen-extractable), on average, as compared to 20 ppm under sprinkler irrigation. These results are important as 20 ppm extractable P can be construed as the point where soil P is considered low to medium in soil testing; extractable P values over 40 ppm limit sites to P application based on crop uptake only. These soils were also analyzed using a sequential extraction technique, and total and amorphous Fe were determined to identify inorganic P pools. Soils under furrow irrigation had greater concentrations of inorganic P in the soluble/Al-bound/Fe-bound and occluded phases, and in the amorphous Fe phases. Phosphorus concentrations in all other soil phases were similar between the two irrigation practices. Findings suggest that Fe redox chemistry plays a large role in P release under furrow irrigation, even in aridic systems. In terms of soil P, results support the use of sprinkler irrigation as a best management and conservation practice.
INTRODUCTION
Nutrient (e.g. P) enrichment of surface water runoff associated with anthropogenic activities is a serious problem in the United States (USEPA, 1996). The primary pathway for P loss from agricultural soils is through surface runoff (Vadas et al., 2004). Once in irrigation return flow waters, P may be transported distances greater than 11 miles (Ippolito and Nelson, 2013). Thus, managing irrigation practices may help influence runoff and reduce P losses from agricultural systems.
furrow irrigation runoff. Changes in soil nutrient status could also occur due to the difference is soil wetting that occurs between the two irrigation methods. To that end, we investigated the change irrigation practice has on soil P dynamics.
METHODS
Fields from four southern Idaho producers were identified; each producer grew barley on relatively adjacent fields using either furrow or sprinkler irrigation. Following barley harvest, three surface soils (0-2 inch depth) were collected from the top (inflow end) and bottom of each field, composited, and then air dried and ground to pass a 0.079-inch sieve. Soil analysis included Olsen extractable P (Olsen et al., 1954), a modified Hedley sequential extraction for a) soluble+Al+Fe-bound P, b) Fe-coated (i.e. occluded) P, and c) Ca-bound P (Kuo, 1996), total free Al and Fe (Loeppert and Inskeep, 1996), and amorphous Al and Fe phases (Loeppert and Inskeep, 1996). T-tests were performed between the top and bottom of fields for either furrow or sprinkler irrigation sites, or between furrow and sprinkler irrigated sites. Significant differences were determined at an α of 0.05.
RESULTS AND DISCUSSION
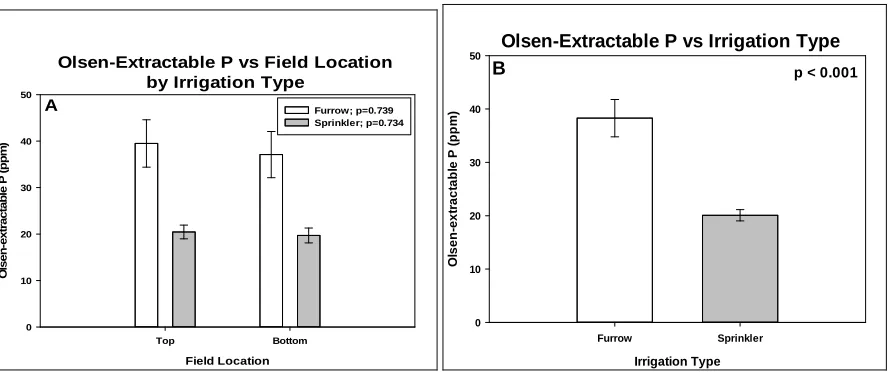
Soil sampling at the top as compared to the bottom of the field, in either furrow or sprinkler irrigated sites, had no effect on Olsen-extractable P concentration (Figure 1A). Overall, furrow irrigated soils contained greater Olsen-extractable P as compared to sprinkler irrigated soils (Figure 1B). This information suggests that switching from furrow irrigation to sprinkler irrigation will reduce available soil P. This could be construed as a positive result in systems, such as presented here, where available P content approaches 40 ppm and P fertilizer application becomes limited to crop removal only as outlined in the Idaho Nutrient Management Plan (State of Idaho, 2001). However, to fully understand why differences were present between furrow and sprinkler irrigation, more information is required. Thus, a sequential inorganic P extraction was performed.
Olsen-Extractable P vs Field Location by Irrigation Type
Field Location
Top Bottom
O
lse
n
-extr
actab
le P
(
p
p
m
)
0 10 20 30 40 50
Furrow; p=0.739 Sprinkler; p=0.734 A
Irrigation Type
Furrow Sprinkler
O
lsen-e
xt
ract
abl
e
P
(
p
p
m
)
0 10 20 30 40 50
p < 0.001
Olsen-Extractable P vs Irrigation Type B
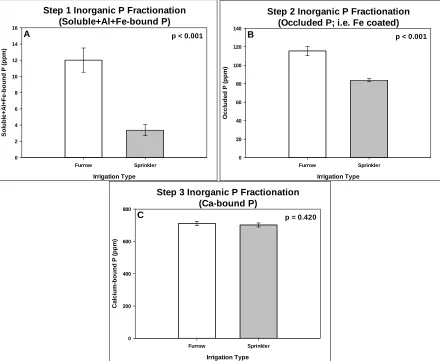
sprinkler irrigated soils (Figures 2A and B). No differences were present between furrow and sprinkler irrigation for the Ca-bound P phase (Figure 2C) likely because these soils are aridic and dominated by CaCO3 (~10% CaCO3 by wt as determined by a pressure calcimeter method;
Sherrod et al., 2002). Furrow irrigated soils likely contained greater P concentrations associated with Al and Fe phases, as these phases have been shown to dominate over the soluble P phase (Ippolito et al., 2007). Thus, total free and amorphous Al and Fe phases were measured.
Irrigation Type
Furrow Sprinkler
S
o
lubl
e+
A
l+
F
e-bo
und P
(
ppm
)
0 2 4 6 8 10 12 14 16
p < 0.001
Step 1 Inorganic P Fractionation (Soluble+Al+Fe-bound P) A
Irrigation Type
Furrow Sprinkler
O
ccl
uded P (
ppm
)
0 20 40 60 80 100 120 140
p < 0.001
Step 2 Inorganic P Fractionation (Occluded P; i.e. Fe coated) B
Irrigation Type
Furrow Sprinkler
C
a
lc
ium
-bound P (
ppm
)
0 200 400 600 800
p = 0.420
Step 3 Inorganic P Fractionation (Ca-bound P)
C
Figure 2. Sequentially extracted soil P concentrations associated with A) soluble+Al+Fe-bound, B) occluded (i.e. Fe-coated), and C) Ca-bound phases.
Irrigation Type Furrow Sprinkler Tot al Fr ee A l (ppm ) 0 100 200 300 400 500 600 700
p = 0.202
Total Free Aluminum A
Irrigation Type
Furrow Sprinkler Tot al Fr ee Fe (ppm ) 0 1000 2000 3000 4000 5000
p = 0.120
Total Free Iron B
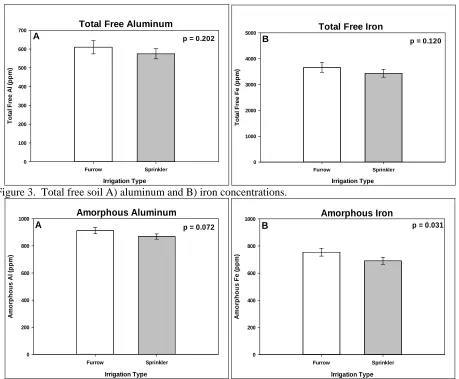
Figure 3. Total free soil A) aluminum and B) iron concentrations.
Irrigation Type Furrow Sprinkler A m or p hous A l ( p pm ) 0 200 400 600 800 1000
p = 0.072
Amorphous Aluminum A
Irrigation Type
Furrow Sprinkler A m or phou s Fe (pp m ) 0 200 400 600 800 1000
p = 0.031
Amorphous Iron B
Figure 4. Amorphous soil A) aluminum and B) iron concentrations.
Furrow irrigated soils undergo periods of saturation, likely causing a reduction in Fe from the 3+ to 2+ state. Under initial reduced conditions, ferric-bearing mineral phases dissociate and release P to the soil solution, with some P sorbed by CaCO3; thus the increase in
Olsen-extractable P under furrow as compared to sprinkler irrigation (Figure 1B). In addition to the initial P release, when soil Fe mineral phases undergo further reduction their crystallinity decreases (i.e. they become amorphous) with a concomitant increase in surface area. Increasing surface area leads reduced Fe to sorb greater quantities of P and was likely the cause of the increased P concentrations in the soluble+Al+Fe-bound and occluded sequential extraction steps (Figures 2A and B).
In calcareous-dominated soils it is typically believed that CaCO3 greatly influences P
researchers did not perform an amorphous extraction procedure. However, Ryan et al. (1985a) studied 20 calcareous soils, performed an amorphous Fe extraction test, and showed that P sorption was strongly related to amorphous Fe oxides instead of CaCO3.
Furthermore, calcium phases may not entirely control P availability in calcareous soils periodically experiencing reduced conditions (e.g. saturation during furrow irrigation), leading to an increase in Fe mineral phase(s) surface area. In calcareous soils, differences in P sorption between CaCO3 and amorphous Fe mineral phases are likely a function of surface area and not
total quantity present. Holford and Mattingly (1975b) found that the surface area of CaCO3 in
calcareous soils ranged from 1.0 to 1.5 m2 g-1 and was inversely related to degree of weathering. Crystalline and amorphous Fe oxide surface areas, on the other hand, range from 17 to 280 m2 g
-1
(Sparks, 2003; McLaughlin et al., 1981) and thus their P sorption capacity is greater than that of CaCO3. More importantly, it has been shown that amorphous Fe phases can sorb up to 10 times
more P than their crystalline counterparts (McLaughlin et al., 1981), supporting the increase in P associated with these phases in furrow versus sprinkler irrigation.
SUMMARY
Greater soil test P concentrations existed in furrow as compared to sprinkler irrigated soils. Furrow irrigated sites underwent longer periods of soil saturation, likely leading to reduced conditions. Ferric-bearing mineral phases likely dissociated and released P to the soil solution, which was partially sorbed by CaCO3 and led to the increase in Olsen-extractable P. Under
furrow irrigation, increasing available soil P content could potentially lead to greater offsite movement. In comparison, sprinkler irrigated soils contained less available P yet the quantity would still be considered sufficient for crop growth. Results support the use of sprinkler irrigation as a best management and conservation practice.
REFERENCES
Al-Jamal, M.S., S. Ball. And T.W. Sammis. 2001. Comparison of sprinkler, trickle and furrow irrigation efficiencies for onion production. Ag. Water Manage. 46:253-266.
Bjorneberg, D.L., D.T. Westermann, N.O. Nelson, and J.H. Kendrick. 2008. Conservation practice effectiveness in the irrigated Upper Snake River/Rock Creek watershed. J. Soil Water Conserv. 63:487-495.
Holford, I.C.R., and G.E.G. Mattingly. 1975a. The high- and low-energy phosphate adsorbing surfaces in calcareous soils. J. Soil Sci. 26:407-417.
Holford, I.C.R., and G.E.G. Mattingly. 1975b. Surface areas of calcium carbonate in soils. Geoderma. 13:247-255.
Ippolito, J.A., K.A. Barbarick, and K.L. Norvell. 2007. Biosolids impact soil phosphorus recovery, fractionation, and potential environmental risk. J. Environ. Qual. 36:764-772. Ippolito, J.A., and N.O. Nelson. 2013. Assessment of phosphorus retention in irrigation laterals.
In review with J. Soil Water. Conserv.
Kuo, S. 1996. Phosphorus. p. 869-919. In D.L. Sparks (Ed.) Methods of Soil Analysis. Part 3. Chemical Methods. SSSA, Madison, WI.
Loeppert, R.H., and W.P. Inskeep. 1996. Iron. p. 639-664. In D.L. Sparks (Ed.) Methods of Soil Analysis. Part 3. Chemical Methods. SSSA, Madison, WI.
Olsen, S.R., C.V. Cole, F.S. Watanabe, and L.A. Dean. 1954. Estimation of available phosphorus in soils by extraction with sodium bicarbonate. USDA Circ. 939. USDA. Washington, DC. Ryan, J., D. Curtin, and M.A. Cheema. 1985a. Singificance of iron oxides and calcium carbonate
particle size in phosphate sorption by calcareous soils. Soil Sci. Soc. Am. J. 48:74-76. Ryan, J., H.M. Hasan, M. Baasiri, and H.S. Tabbara. 1985b. Availability and transformation of
applied phosphorus in calcareous Lebanese soils. Soil Sci. Soc. Am. J. 49:1215-1220. Sherrod, L.A., G. Dunn, G.A. Peterson, and R.L. Kolberg. 2002. Inorganic carbon analysis by
modified pressure-calcimeter method. Soil Sci. Soc. Am. J. 66:299-305.
Sparks, D.L. 2003. Environmental Soil Chemistry. 2nd ed. Academic Press, San Diego, CA. State of Idaho, 2001. Guidelines to prepare for your nutrient management plan. Available at:
http://www.agri.idaho.gov/Categories/Environment/nmp/nmpPDF/Nutrient%20Managemen t.pdf (verified 18 January 2013).
USEPA. 1996. Environmental indicators of water quality in the United States. EPA 841-R-96-002. U.S. Gov. Print. Office, Washington, DC.
Vadas, P.A., P.J.A. Kleinman, and A.N. Sharpley. 2004. A simple method to predict dissolved phosphorus in runoff from surface-applied manures.