Volume 2010, Article ID 782731,16pages doi:10.1155/2010/782731
Research Article
Instrumental Estimation of E-Model Parameters for
Wideband Speech Codecs
Sebastian M¨oller,
1Nicolas Cˆot´e,
2Val´erie Gautier-Turbin,
3Nobuhiko Kitawaki,
4and Akira Takahashi
51Quality and Usability Lab, Deutsche Telekom Laboratories, TU Berlin, 10587 Berlin, Germany 2LISyC EA 3883, Universit´e Europ´eenne de Bretagne, Brest, France
3France T´el´ecom Division R&D CRD Technologies (TECH) Lab, 22300 Lannion, France 4University of Tsukuba, Ibaraki 305-8573, Japan
5NTT Service Integration Laboratories, NTT R&D Center RM-H610, Musashino, Tokyo 180-8585, Japan
Correspondence should be addressed to Sebastian M¨oller,[email protected]
Received 9 May 2010; Revised 20 July 2010; Accepted 30 September 2010
Academic Editor: Wai-Yip Chan
Copyright © 2010 Sebastian M¨oller et al. This is an open access article distributed under the Creative Commons Attribution License, which permits unrestricted use, distribution, and reproduction in any medium, provided the original work is properly cited.
A method is described for quantifying the quality of wideband speech codecs. Two parameters are derived from signal-based speech quality model estimations: (i) a wideband equipment impairment factorIe,WBand (ii) a wideband packet-loss robustness
factorBpl,WB. The equipment impairment factor can be combined with impairment factors for other quality degradations to form
an estimate of the overall conversational qualityRof a wideband communication scenario, using a wideband extension of the E-model. The packet-loss robustness factor captures the robustness of the codec against packet-loss degradations. In contrast to past work, these parameters are no longer determined on the basis of auditory test results, but from signal-based speech quality models. We applied three intrusive models to several databases and compared the derived quality estimates and impairment factors to those obtained from auditory tests. The results show that when migrating from narrowband to wideband transmission—a quality improvement of roughly 30% can be obtained, which is very similar to the one observed in auditory tests. The estimated impairment factors show a high correlation to those derived from auditory scores. Congruences and discrepancies to auditory test results are discussed, and an outline of work necessary to set up a wideband or even superwideband E-model is given.
1. Introduction
In telephone networks, various type of degradations may appear. Examples of such degradations are acoustic echoes, nonperfect acoustic-electrical coupling at the terminal, over-all transmission delay, packet losses, and nonlinear distor-tions introduced by low bit-rate speech codecs. In order to estimate the joint effects of these degradations, the European Telecommunications Standards Institute (ETSI) and the Telecommunication Standardization Sector of the Interna-tional Telecommunication Union (ITU-T) have developed the E-model for predicting the overall quality (i.e., from the talker’s mouth to the listener’s ear), in a conversational situation, see ETSI ETR 250 [1] and ITU-T Rec. G.107 [2]. The parameter-based E-model aims at planning future transmission networks. Inputs to the model are parameters
describing the respective parts of the transmission channel, such as Loudness Ratings (LRs) for the attenuation of the sending and the receiving part of the terminal, weighted noise power levels for the circuit noise and the ambient noise at the sender’s and the receiver’s end, or average delay times and attenuations for talker and listener echo. These parameters are transformed to so-called “impairment factors” which are additive on the “transmission rating scale” (R-scale) according to:
R=R0−IS−Id−Ie+A, (1)
where R0 represents the “optimum” Signal-to-Noise Ratio
(SNR) in absence of supplementary impairments. IS
rep-resents the impairments occurring simultaneously with the speech signal. Id encompasses the impairment related to
transmitted speech signal.Ie corresponds to the equipment
impairment factor introduced by low bit-rate codecs. The expectation factor Aallows a compensation of the impair-ment factors in terms of “advantage of access” (e.g., cordless handset). The predicted conversational quality on the R -scale ranges from R = 0 (lowest possible quality) toR =
100 (best quality) for standard Narrow-Band (NB, f ∈
[300, 3400] Hz) connections.
Due to the migration from circuit-switched to packet-switched networks, telephone channels are no longer limited to the standard 300–3400 Hz bandwidth. Instead, WideBand (WB, f ∈ [50, 7000] Hz) speech transmission or even beyond can be provided with minimal additional effort, and a number of such services are currently introduced by telecommunication operators. The increased bandwidth has shown to enhance the perceived quality by around 29% compared to the standard NB channel. TheR-scale has been extended toRmax =129 for a “direct” WB channel, as it has
been shown by M¨oller et al. [3] and is currently reflected in ITU-T Rec. G.107 [2].
Unfortunately, this enhancement may get lost when the network equipment introduces further degradations. A major part of commonly-observed degradations stems from speech codecs which are necessary to transmit the WB speech signal in an efficient way. The ITU-T currently recommends the ITU-T Rec. G.722 [4], the ITU-T Rec. G.722.1 [5], the ITU-T Rec. G.722.2 [6], the ITU-T Rec. G.729.1 [7], the ITU-T Rec. G.718 [8] and the ITU-T Rec. G.711.1 [9] for this purpose. Depending on the bit-rate and the coding principle, the degradation associated with each of these codecs may reduce the 29% quality improvement, and consequently lead to a lower quality than a direct channel. The degradations due to WB speech coding are captured by a one-dimensional parameter, called WB equipment impairment factor Ie,WB.
TheIe,WBvalues are defined on theR-scale as the difference
between theR-value corresponding to a codec under study and theR-value corresponding to the “direct”, clean channel. M¨oller et al. [3] derived a number ofIe,WBvalues for G.722,
G.722.1 and G.722.2 codecs at different bit-rates. These values have recently been included in Appendix IV to ITU-T Rec. G.113 [10], either for a monotic or a diotic listening mode (the listening mode has shown impact on the results), as a WB extension to the E-model.
In packet-based networks packet losses may occur, either because of packets which do not arrive at the listener’s side or because of packets which have to be discarded by the receiving buffer management algorithm due to real-time transmission constraints. The audible degradations introduced by these errors on the synthesized signal (i.e., at the listener’s side) depend on both the network and the strategy used by the speech codec. For instance, a packet-loss concealment method can be used in order to reduce the audible degradation. Raake [11] proposed to adjust the
Ie,WBvalue towards anIe,WB,effwhich takes into account the
transmission errors. In Appendix II of ITU-T Rec. G.107 [2], it is shown that the increase can be estimated by
Ie,WB,eff=Ie,WB+
95−Ie,WB
· Ppl
Ppl+Bpl,WB, (2)
Transmission
system
x(k)
Signal-based model
MOS-LQO
ITU-T Rec.P.834.1
E-model
R
y(k)
Ie,WB Bpl, WB
Figure1: Overview of the methodology adopted by the ITU-T and described in ITU-T Rec. P.834.1 [15].
whereIe,WB,effis the “effective” equipment impairment factor
including packet loss, Ie,WB is the equipment impairment
factor without packet loss, Ppl is the percentage of lost
packets, andBpl,WB is a factor describing the robustness of
the codec against packet loss, in the sense of a lack of audible effects (the higherBpl,WB, the lower the associated audible
degradations). ProvisionalBpl,WBvalues are listed in ITU-T
Rec. G.113 [10], for a diotic listening mode only.
A methodology has been developed by M¨oller et al. [3] for deriving Ie,WB and Bpl,WB values from the results
of auditory listening-only tests carried out in accordance with ITU-T Rec. P.800 [12]. This procedure rules out biases which stem from the characteristics of the auditory test, like language, quality range, listener’s experience, and so forth. It has been approved as a standard in ITU-T Rec. P.833.1 [13], and mainly extends the respective procedure of the NB case, see ITU-T Rec. P.833 [14].
The E-model provides estimations of speech quality on the basis of network- and terminal-related parameter values. These values have been measured by different “instrumental” methods, that is, measurement instruments. Thus, all input parameters for a full WB version of the model (which still needs to be developed) should be measurable in a purely instrumental way. For instance, loudness ratings can be measured by a method described in ITU-T Rec. P.79 [16]. In order to derive stableIe,WBandBpl,WBvalues, the authors
The resulting methodology has recently been adopted by the ITU-T as the new Recommendation ITU-T Rec. P.834.1 [15]. The present paper aims at evaluating this methodology for different databases and signal-based models. One other method has already been proposed for this purpose: Raja et al. [17] developed a methodology based on network parameter values such as the mean packet loss rate for the instrumental derivation of Ie,WB and Bpl,WB values. These
parameters are combined using Genetic Programming. In order to evaluate the accuracy of its methodology, Raja et al. [17] compared the derived Ie,WB and Bpl,WB values to
reference values which have been derived from signal-based speech quality model estimations instead of auditory test results. However, the derived values depend on the reliability of the signal-based model used.
Estimating the input variables for one type of model (parameter-based) with the help of another type of model (signal-based) may be a dangerous undertaking if the consistency with quality values derived from auditory results is not proven. Whereas there are no particular doubts about the feasibility, there are three research questions we would like to answer with this paper.
(1)By which amount is theR-scale extended when apply-ing instrumental models? Is this amount congruent with the one found in auditory tests?
(2)Which Ie,WB values can be obtained with the instru-mental approach? Are they comparable to those derived from auditory results?
(3)Is it possible to come up with meaningful packet-loss robustness factorsBpl,WBvia instrumental models, to be used in(2)?
Section 2describes the ITU-T Rec. P.834.1 methodology used to derive theIe,WBandBpl,WBvalues from signal-based
model estimations. M¨oller et al. [18] applied the method-ology for the quantification of the G.711.1 speech codec using one instrumental model and one speech database. In this paper, the P.834.1 methodology is applied with three signal-based models and seven speech databases which have been collected for different purposes, in different languages.
Section 3 briefly reviews the three models. The databases and the processing applied to them is described inSection 4. The models provide us first with an estimation of the quality enhancement when migrating from NB to WB; this enhancement is quantified inSection 5and compared to the values from auditory tests. Then, using an average value for the enhancement, we applied the P.834.1 methodology and derivedIe,WBvalues for a range of codecs and bit-rates. The
method is analyzed by comparing the Ie,WB values derived
from signal-based models to those derived from auditory tests, seeSection 6. Finally, we try to estimateBpl,WBvalues
for different packet-loss conditions inSection 7. We conclude in Section 8 with a critical discussion of the proposed methodology and an outlook on work which is still necessary to define a wideband E-model where all input parameters can be derived from purely instrumental measurements.
2. P.834.1 Methodology
The instrumental methodology for deriving wideband equipment impairment factors follows the same principle already used in the corresponding auditory procedure [13]. It consists of five consecutive steps (see ITU-T Rec. P.834.1 [15] for details):
(1)Speech Material. Speech material has to be processed through 12 WB reference speech codecs and the codec under investigation. Additional conditions may be processed such as mixed tandems of the codec under investigation with the reference codecs, or transmission errors possibly concealed by a packet-loss concealment algorithm.
(2)Quality Estimations. Each speech file pair is processed by one or several signal-based models. The models provide scores in terms of an average Mean Opinion Score (MOS) value which could have been given by a number of test participants in an auditory test in accordance with ITU-T Rec. P.800 [12] and ITU-T Rec. P.830 [19].
(3)Determination of R-Values. The estimated MOS values are transformed to theRNB/WB-scale in a mixed
NB/WB context, using the relationship between MOS andRvalues provided with the (NB) E-model and a linear expansion to the range [0; 129] according to:
R=1.29·RNB/WB. (3)
(4)Derivation of Raw Ie,WB,insValues. Raw wideband
equipment impairment factorIe,WBvalues are derived
from the R-values as the difference between the “direct” (degradation-free) wideband channel and the respectively coded channel (i.e., codec condition under consideration):
Ie,WB,ins=Rdirect−Rcondition, (4)
where the “direct” condition is a linear PCM signal quantified with 16 bits per sample.
(5)Normalization. The rawIe,WB,insvalues still reflect the
database they have been derived from, in terms of speakers and sentence material. The rawIe,WB,insare
normalized by anchoring them to knownIe,WBvalues
for reference wideband codecs, and then to perform a linear interpolation between the known and the unknownIe,WBvalues according to
Ie,WB,ins=a·Ie,WB,known+b. (5)
The coefficientsaandbare determined numerically, approximating all the reference wideband codecs in a least-squares sense.
However, we can apply the same method derivingIe,WB,eff
val-ues for each packet-loss condition and then approximating (2) in a least-squares sense, seeSection 7.
3. Signal-Based Speech Quality Models
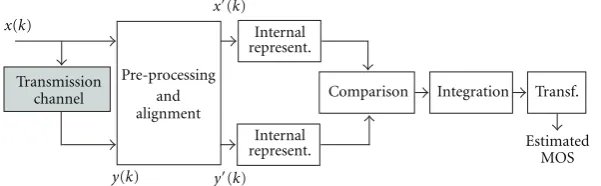
Signal-based models have been used for several decades to estimate the quality degradation associated with codecs, quantizing distortion, as well as frame erasures or packet losses. An overview of different modeling approaches can be found in Rix et al. (e.g., [20]). The underlying idea of a specific class of such models—the so-called intrusive models—is depicted inFigure 2. They estimate a degradation associated with a specific part of the transmission channel, for example, a coding-decoding process, on the basis of the reference (clean or system input) speech signal x(k) and a corresponding degraded (distorted or system output) speech signal y(k). First,x(k) and y(k) are windowed and filtered to simulate the listening terminal of the user. They are further aligned to rule out effects of delay and jitter (variable delay). Both signals are then transformed to an internal representation, which simulates several characteristics of the peripheral human auditory processing, taking place mainly in the inner ear. The internal representations of the input and output are compared, and a perceptual distance is computed for each signal frame. Finally, the individual distances are averaged and transformed to an estimation of a MOS value, as it would be obtained using a 5-point Absolute Category Rating (ACR) listening quality scale as described in ITU-T Rec. P.800 [12].
In order to derive Ie,WB and Bpl,WB values, wideband
signal-based models are required. The procedure used to extend the R-scale requires quality estimations in both contexts, NB and mixed-band (i.e., NB and WB). There-fore signal-based models providing quality estimations in both contexts are needed. Only few wideband models are available. The ITU-T currently recommends a wideband version of its Perceptual Evaluation of Speech Quality (WB-PESQ, see ITU-T Rec. P.862.2 [21] and ITU-T Rec. P.862.2 [22]) for this purpose. However, the WB-PESQ shows several limitations. Therefore, a modified version of this model, described by C ˆot´e et al. [23], has been used to better cope with the characteristics of wideband speech codecs. Another model providing estimations in both contexts has been used for some years, namely the Telekom Objective Speech Quality Assessment (TOSQA) model developed by Berger [24], and its wideband version, TOSQA-2001 [25]. Characteristics of the three models are briefly discussed in the following subsections.
3.1. PESQ and WB-PESQ. The PESQ model is based on its predecessor PSQM [26] and the variable delay estimation provided by PAMS [27]; it is currently recommended by ITU-T for assessing the impact of speech codecs, including the effects of frame or packet loss [21]. The model follows the structure ofFigure 2. As the sending device, the model assumes a standard handset which is commonly simulated by a modified Intermediate Reference System (IRS) sending
filter according to ITU-T Rec. P.830 [19]. For simulating the receiving device which would be used for listening to the speech in an auditory test, the model assumes an IRS receive filter according to ITU-T Rec. P.48 [28]. The receive filter is applied to the signalsx(k) andy(k) in the preprocessing step, because the model is usually applied to the electrical part of the network, before the receiving terminal. In addition, effects of linear distortion are partly ruled out in this step. Input and output signals are then aligned using the algorithm described by Rix et al. [29], taking also care of time-varying delays introduced by variable-length jitter buffers. The internal representation follows the algorithm developed by Beerends et al. [30] and deviates from standard loudness models by calculating a so-called “compressed loudness”, which is in contrast to psychoacoustic findings, but provides a higher correlation with auditory test results. The averaging step shows three particularities: it includes a measure of the noise disturbance during silent intervals, it considers time-domain masking, as well as an asymmetry of perceptual degradations due to omitted compared to newly-introduced signal components. The averaged distance is finally transformed to the MOS scale using the mapping function given in ITU-T Rec. P.862.1 [31].
The algorithm of WB-PESQ is identical to the one of PESQ for NB speech, except in two points: (i) the input filter in the preprocessing step of WB-PESQ has a flat passband characteristic 100–8000 Hz [32] instead of the IRS receive high-pass characteristic used in PESQ; (ii) the mapping function differs for WB transmissions and is provided in ITU-T Rec. P.862.2 [22]. It should be noted that the MOS value estimated with WB-PESQ cannot be directly compared to the one obtained with (NB-) PESQ, since NB conditions are usually rated worse in a mixed (NB and WB) context than they are rated in a purely NB context. Work on the relationship between the use of the MOS scale in NB, mixed NB/WB, WB and even super-WB contexts—both in auditory tests and in instrumental models—is currently underway in ITU-T Study Group 12.
x(k)
x(k)
y(k) y(k) Transmission
channel
Pre-processing and alignment
Comparison
Internal represent.
Internal represent.
Integration Transf.
Estimated MOS
Figure2: Schematic of a signal-based speech quality model for estimating MOS values.
3.3. TOSQA and TOSQA-2001. In contrast to PESQ, TOSQA calculates a similarity (correlation) instead of a distance between x(k) and y(k). Both signals are prefiltered and time-aligned, however using a variable delay estimation on the basis of a maximum correlation between input and output frames. Effects of linear distortions are compensated for, except for low and high frequency signal components. Because the model may also be applied to the acoustic signals available at the sending and receiving terminals, the input signal x(k) is additionally filtered with a modified IRS sending characteristic. Bothx(k) and y(k) are further filtered by a standard 300–3400 Hz bandpass filter to simulate the receiving terminal. The internal representation is based on Zwicker’s loudness model [35], without modifying the standard loudness compression laws. Finally, a third-order mapping function is provided to map the raw TOSQA score to the MOS scale. A detailed description of TOSQA can be found in Berger [24].
The so-called “2001 version” of TOSQA has been extended and improved by a dynamic gain alignment, an adaptive threshold for the internal voice activity detection (VAD), and a modified background noise calculation which takes into account comfort noise introduced by VADs in the network or in the terminal. The model has been adapted to wideband transmission by using a 200–7000 Hz passband filter instead of the IRS receive filter, and replacing the modified IRS sending characteristics applied to x(k) by a flat filter. In this way, it has been shown to provide acceptable correlations with acoustically-recorded speech samples, including the effect of the transmitting and receiv-ing terminal [25,36].
4. Experimental Setup
In order to instrumentally calculate the quality improvement when migrating from NB to WB transmission scenarios and the effective equipment impairment factors for WB speech codecs, databases consisting of input and corresponding output signals of NB- and WB-transmitted speech are necessary. The databases used in this study are listed in
Section 4.1. They have been processed with the WB-PESQ, the Modified WB-PESQ and the TOSQA-2001 models in order to estimate MOS values for each input-output signal pair. The processing steps are described in Section 4.2. As auditory MOS ratings are available for all our databases, the prediction accuracy of the three instrumental models—in
terms of correlations and prediction errors of the auditory and estimated MOS scores—is analyzed inSection 4.3.
4.1. Databases. Seven databases obtained from 25 auditory tests are available for our study. They are summarized in
Table 1and described in the following paragraphs.
Database 1. Stems from a pair of listening-only tests carried out at France T´el´ecom R&D (Lannion, France) in 2004 by Barriac et al. [37]. The NB test includes 18 NB conditions (i.e., standard speech codecs such as G.726 and G.729) and 7 WB conditions downsampled to a sampling rate of 8 kHz. The mixed-band (NB/WB) test comprises the 25 NB conditions included in the NB test and 11 WB conditions (the G.722, the G.722.1 and the G.722.2 speech codecs). The direct WB condition corresponds to a flat lowpass ranging from 0 to 8 kHz.
Database 2. Contains stimuli from a pair of two listening-only tests carried out at the Institut f¨ur Kommunikations-akustik (Bochum, Germany) [11,38] in 2005. The NB test includes 4 bandpass filtering and 5 speech codecs (e.g., G.711, G.726 and G.729A). The mixed-band (NB/WB) test includes the 9 NB conditions included in the NB test and also 9 WB conditions (bandpass filtering and 2 WB speech codecs). The bandpass filtering conditions have different bandwidths (lower cut-off frequency fl ∈ [50; 600] Hz,
upper cut-offfrequency fu∈[2000; 7000] Hz).
Database 3. Originates from a test carried out at Institute of Information Sciences and Electronics (Tsukuba, Japan) in the Japanese language and includes both NB- and WB-coded samples, with and without packet loss. Details on the test set-up are described in [39].
Database 4. Was obtained from NTT (Tokyo, Japan), see Takahashi et al. [33]. It includes both NB- and WB-coded samples in error-free and packet-loss conditions.
Table1: Processing conditions included in the seven databases. PL refers to packet-loss conditions, BP to bandpass filtering and TD to tandeming of speech codecs.
Database Context Conditions
1 NB Clean, G.726, G.729, TD, PL at 1, 5%
NB/WB Clean, G.722, G.722.1, G.722.2, G.711, G.726, G.729, PL at 1, 5%
2 NB Clean, BP, G.726, G.729A
NB/WB Clean, BP, G.722.2, G.711, G.726
3 NB/WB Clean, G.722, G.722.1, G.722.2, G.711, G.726, G.729, GSM-EFR, PL at 1, 3, 5, 10%
4 NB/WB Clean, BP, MNRU, G.722, G.722.1, G.722.2, G.711, G.726, G.729, TD, VoIP, PL at 1, 3, 5, 10% 5 NB Clean, G.711, G.729A, G.723.1, AMR, TD, PL at 3, 5, 10%
NB/WB Clean, G.722, G.722.2, G.729EV(a), G.711, AMR, TD, PL 3, 5, 10%
6 1 NB MNRU, G.711, G.726, G.729, GSM-FR, TD 3 NB Clean, MNRU, G.726, G.729, BGN, PL at 3, 5%
7 NB/WB Clean, BP, MNRU, G.722.2, G.729A, 5 candidate codecs for G.729.1
(a)G.729EV refers to the prepublished version of the ITU-T Rec. G.729.1 [7] standard.
conditions including several speech codecs (G.722, G.722.1, G.722.2 and G.729EV2. (The G.729EV corresponds to a
prepublished version (Version 1.14.1 – Jan. 31, 2006) of the ITU-T Rec. G.729.1 [7] standard. This version has been used during the optimisation/characterization phase.) Both listening-only tests include speech codecs in single and tandem conditions at different packet-loss ratios (0%, 3%, 5% and 10%).
Database 6. Is provided in ITU-T Suppl. 23 to P-Series Rec. [41] and stems from the ITU-T Rec. G.729 (8 kbit/s) codec selection phase. It includes 2 ACR listening-only tests (Test 1 and Test 3), carried out in 3 languages for Test 1 and 4 languages for Test 3. This database is considered as the reference database for PESQ to verify correctness of the implementation, (cf. [42]). Test 1 includes several speech codecs (G.711, G.726, G.729 and GSM-FR) in single and tandem conditions. Test 3 includes a set of NB speech codecs impaired by transmission errors (packet-loss ratios of 0%, 3% and 5%) and background noise.
Database 7. Originates from the qualification (or selection) phase of the ITU-T Rec. G.729.1 codec. Unfortunately, no speech files are available from the corresponding 10 tests, but only the MOS estimations provided by WB-PESQ, using the transformation according to [22]. Each NB/WB test includes NB and WB speech codecs (G.729A, G.722 and G.722.2), several Narrow-, Middle- (i.e., [100; 5000] Hz) and Wide-band MNRU conditions and one of the five candidate codecs at different bit-rates. Details on the test set-up are available in [43] and on the test results in [44].
M¨oller et al. [3] already used Databases 1–4 for deriving theR-scale extension and Ie,WB values from auditory tests.
The other databases of that exercise stem from the G.722.2 characterization phase and could unfortunately not be used in this study, because of legal restrictions.
4.2. Processing Scenarios. Wideband equipment impairment factors Ie,WB and a future WB E-model shall describe
Sending terminal IRS send
P.341 P.341
NB
WB
NB
WB Transmission system
Receiving terminal IRS rec.
x(k) y(k)
PESQ/WB-PESQ
TOSQA/TOSQA-2001
E-model
Est. MOS
LR, delay,· · ·
ITU-T Rec.P.834.1
Ie,WBandBpl, WB
Figure3: Scenarios for using signal-based models estimating the quality degradation due to codec and frame/packet loss in a network.
networks in which both NB and WB connections coexist for a certain period of time. Thus, we assume that at least one of the terminals provides WB capability. In such networks, the WB-PESQ model is usually applied to the electric part of the network, excluding the terminals. In turn, TOSQA-2001 can also be applied to the acoustic interfaces.Figure 3(solid lines) depicts the situation.
However, the auditory results used in our study stem from stimuli where both sending and receiving terminals have been simulated. Such stimuli provide a realistic impres-sion to the test participants. Thus, the output signal is usually filtered, either with an IRS receive type characteristic (NB case) or with a bandpass filter according to ITU-T Rec. P.341 [45]. Because of this, we have to use these “filtered” signals as an inputy(k) to all signal-based models. This situation is depicted via the dashed line inFigure 3.
Table2: Pearson correlation coefficientsρand root mean square prediction errorsσ between the auditory and the estimated MOS for Databases 1–5 and 7, using different WB signal-based models. These measures are computed after third-order mapping.
Database(a) No. of stimuli WB-PESQ TOSQA-2001 Mod. WB-PESQ
NB WB ρ σ ρ σ ρ σ
1 100 44 0.93 0.36 0.91 0.40 0.93 0.34
NB only 0.97 0.29 0.90 0.41 0.98 0.28
2 36 36 0.83 0.49 0.78 0.55 0.83 0.49
NB only 0.75 0.47 0.77 0.44 0.65 0.49
3 112 392 0.97 0.23 0.92 0.35 0.96 0.24
NB only 0.94 0.24 0.69 0.37 0.95 0.19
4 96 1288 0.90 0.29 0.88 0.31 0.92 0.25
NB only 0.88 0.43 0.83 0.41 0.90 0.25
5 360 360 0.93 0.35 0.88 0.46 0.97 0.23
NB only 0.93 0.37 0.78 0.48 0.95 0.26
7
AA 0 336 0.94 0.30
AC 0 336 0.95 0.30
BB 0 336 0.97 0.19
BD 0 336 0.97 0.19
CC 0 336 0.93 0.33
CE 0 336 0.89 0.44
DD 0 336 0.97 0.18
DA 0 336 0.97 0.19
EE 0 336 0.83 0.56
EB 0 336 0.87 0.51
(a)Database 7: Letters specify the combination of the test laboratory (A–E, first letter) and the tested candidate codec (A–E, second letter).
Table3: Pearson correlation coefficientsρand root mean square prediction errorsσbetween auditory and estimated MOS values values for Databases 1-2 and 5-6, using different NB signal-based models. These measures are computed after third-order mapping.
Database(a) Stimuli PESQ TOSQA Mod. PESQ
ρ σ ρ σ ρ σ
1 100 0.95 0.30 0.95 0.30 0.97 0.23
2 36 0.59 0.71 0.93 0.31 0.64 0.67
5 360 0.92 0.22 0.90 0.24 0.92 0.21
6 1 528 0.97 0.16 0.97 0.17 0.98 0.15
3 800 0.96 0.21 0.71 0.50 0.95 0.22
(a)Database 6: numbers specify Test 1 and Test 3.
prediction accuracy of each model for these databases, which is a first requirement for the normalization procedure described in this paper. We applied WB-PESQ, Modified WB-PESQ and TOSQA-2001 to the WB and the mixed NB/WB databases, and PESQ, Modified PESQ and TOSQA to the databases for which we have results from a NB auditory test available. In order to quantify the reliability of each signal-based model, a third-order polynomial mapping function has been applied to the estimated MOS values. This mapping function attenuates the impact of the test corpus on the subjective judgments (so-called “corpus effect”), and it is commonly applied to compare results of subjective tests to the estimations of signal-based models. The third oder mapping function is used only for analyzing the reliability of the signal-based models themselves; in the remaining of this
article, the raw estimated MOS values have been used for the instrumental derivation of equipment impairment factors, as subjective scores will usually not be available, and thus no corpus effects will occur. The Pearson correlation coefficients
ρand the root mean square prediction errorsσare listed in Tables2and3.
The results inTable 2show that both WB-PESQ and the Modified WB-PESQ reach correlations higher or equal to
the corresponding (NB-) PESQ model is also very low on these NB stimuli, cf. Table 3. TOSQA-2001 usually shows lower correlations than the other two models, and it has the same problems with Database 2. However, its NB version TOSQA reaches a high correlation on the NB part of this database. Overall, the prediction accuracy seems to be in the range of what is expected from the figures given in (e.g., [20]), stating an average correlation of ρ = 0.935 between auditory MOS values and PESQ estimations in NB conditions.
5. Quality Improvement for WB
Speech Transmission
For a NB context, an S-shaped relationship is defined between theR-scale (range [0; 100]) and MOS ratings (range [1; 4.5]); see [2]. For a WB or a mixed NB/WB context, the
R-scale can be extended in a way which leaves the NB-use of the scale unaffected. M¨oller et al. [3] based such an extension on pairs of auditory tests in which the same NB test stimuli have been judged once in a purely NB and once in a mixed NB/WB context, thus quantifying the so-called corpus effect which arises from the two listening contexts. The judgments on these common stimuli define a relationship between the use of the MOS-scale in a NB and in a mixed NB/WB context. On the basis of the auditory MOS values of Databases 1 and 2, an average extension of the R-scale of around 29% was derived. The exact values differed between 24 and 31% for these two databases, and between 12 and 42% for a set of other databases found in the literature. In this section, we will try to estimate the value of such an extension on the basis of the signal-based models described in the previous section.
The procedure we applied follows as far as possible the one used for the auditory test results [3], however replacing the auditory test with mixed NB/WB conditions by WB-PESQ, Modified WB-PESQ or TOSQA-2001 estimations, and the auditory test with NB conditions by using the corre-sponding PESQ, Modified PESQ or TOSQA estimations. The two operational modes should reproduce the corpus effect observable in the auditory tests. As only WB-PESQ scores are available for Database 7, we can apply this procedure only to Databases 1–6. (Database 6 contains all 1738 stimuli of ITU-T Suppl. 23 to P-Series Rec. [41], including those of the Degradation Category Rating (DCR) session which are not listed in Table 2 because our instrumental models are trained to provide ACR, not DCR estimations.) The MOS estimations of the models first have to be transformed to the R-scale. As no relationship between MOS and R is defined for a NB/WB context, the fixed relationship given in [2] has been used. As an example, the resultingRNB(NB
model estimates) andRNB/WB (WB model estimates) values
for the NB conditions of Database 6, Test 3—calculated by the original/modified WB-PESQ and PESQ, respectively— are displayed inFigure 4.
The results may be fitted in different ways. M¨oller et al. [3] used simple linear and exponential functions with one or two parameters and reached satisfying fittings for the
0 20 40 60 80 100
0 20 40 60 80 100 120 140
RNB/WB RNB
Rvalues Eq. (6) Eq. (8)
(a) PESQ and WB-PESQ
0 20 40 60 80 100
RNB/WB 0
20 40 60 80 100 120 140
RNB
Rvalues Eq. (6) Eq. (8)
(b) Modified PESQ and Modified WB-PESQ
Figure4: Relationship betweenR-values derived from NB and WB signal-based models for Database 6, Test 3. (a) PESQ and WB-PESQ; (b) Modified PESQ and Modified WB-PESQ.
auditory results. As a consequence, we tried out the following linear and exponential functions with our estimations:
RNB=a·RNB/WB, (6)
RNB=a·RNB/WB+b, (7)
RNB=a·
eRNB/WB/b−1
. (8)
Due to the use of the NB relationship between MOS andR
for deriving theRNB/WBvalues, the maximumRNB/WBvalue
by the E-model) is still 100. In order to derive a universal
R-scale which is valid in both NB and NB/WB contexts, the
RNB/WBvalues (i.e., in a NB/WB context) obtained from the
WB models have to be defined as RNBvalues (i.e., in a NB
context). This can be reached by applying the same equations (6), (7), and (8) with the same parameter values foraandb
in the following way:
R=a·RNB/WB,
R=a·RNB/WB+b,
R=a·eRNB/WB/b−1
.
(9)
The R-value corresponding toRNB/WB = 100 indicates
the amount by which theR-scale has to be extended in a NB/WB context in order to be still valid in the NB case. As an example, the extrapolations for Database 6, Test 3 are presented inFigure 4, and the averagedRmaxvalues for
Databases 1–6 are listed inTable 4.
Depending on the model and the database used for its derivation, the maximum on the extended R-scale (Rmax)
values and root mean square errors (σ) vary. The best fitting function for all three models—in the sense of a minimumσ—is (7). However, both WB-PESQ and TOSQA-2001 models estimate a relatively lowRmaxvalue. We assume
that these two models underestimate the quality of NB conditions in a mixed-band context. As a matter of fact, WB-PESQ is not recommended for estimating the quality of NB conditions in the latest version of the application guide of the model given in ITU-T Rec. P.862.3 [42]. Thus, we think that the lowRmaxvalues are mainly due to underestimations
of the model, and that the real Rmax value is closer to
the estimations by (6) and (8). The modified version of WB-PESQ is apparently better in predicting the respective extension also using (7).
In addition, Figure 4 shows that the exponential func-tions sometimes have a very small curvature and are quasilinear. On an average of all models, fitting functions and databases, the procedure leads to Rmax = 127.3, that
is, a roughly 30% extension of theR-scale when migrating from NB to WB. Interestingly, this figure is very similar to the 29% extension found by M¨oller et al. [3] for auditory tests, in particular when considering that 4 new databases have been used in the Rmax derivation here. The spread of
the values found for the individual models and databases (Rmax∈[105.8; 170.7]) is higher than the values reported in
[3] (12–42%), which is due to the inclusion of new databases. Still, it can be concluded that the extension of the R-scale based on our 3 signal-based models leads to approximately the same extension of theR-scale than it was observed from the auditory data.
Comparing the 30% extension found here to the litera-ture, Raja et al. [17] found an extension of 7% with the WB-PESQ model. The authors used a linear equation following (6) where the extrapolated line is not forced to go through the origin. The obtained parameters were a = 0.82 and
b=25.46, that is, a high value for theyaxis crossing. Using
a linear relationship forced to go through the origin as (6), a significantly higherRmaxwould probably have been found.
For transforming MOS values to the expanded R-scale in the reminder of the paper, we will use the existing relationship between MOS andRdefined with the E-model in [2], and then multiply the resultingRNB/WBwith 1.29. This
procedure is identical to the one used by M¨oller et al. [3] (linear expansion).
6.
I
e,WBfor Wideband Speech Codecs
Based on the extension of theR-scale derived in the previous section, we can now estimate Ie,WB values for both NB
and WB codecs included in Databases 1–5 and 7. Such
Ie,WB values have been defined by M¨oller et al. [3] as the
difference between the “direct” wideband channel, involving no other degradations than those caused by linear PCM, and the channel involving the codec theIe,WBvalue shall be
determined for. For the NB codecs, this should result in an
Ie,WB value which corresponds to the sum of the Ie value
defined for the NB case in ITU-T Rec. G.113 [10] and the difference between the WB and the NB “direct” channels, the latter having a position of 93.2 on theR-scale (standard G.711 coding and normal noise floor):
Ie,WB=(Rmax−93.2) +Ie=35.8 +Ie. (10)
6.1. Procedure. We follow the procedure described in
Section 2. In case that MOS values higher than 4.5 are estimated by the signal-based model, all MOS values of the corresponding database are linearly compressed to the range [1; 4.5] assumed by the E-model prior to the transformation. Using the included reference conditions with known Ie,WB
values, a linear interpolation between the known and the unknownIe,WBvalues following (5) has been calculated for
each database. Then, normalized Ie,WB values are obtained
using the parametersaandbof (5) according to:
Ie,WB=Ie,WB,ins−b
a . (11)
We applied this procedure to Databases 1–5 and Database 7 (for WB-PESQ only), Database 6 containing only NB conditions. Figure 5shows an example of a normalization procedure for Database 1. It shows the knownIe,WB values
and the Ie,WB,ins values derived from Modified WB-PESQ
estimations.
6.2. Overall Results. Table 5 gives an example of the
indi-vidual Ie,WB values which are obtained from WB-PESQ
estimations.Table 6lists the averageIe,WBvalues for the WB
codecs using all three signal-based models, as well as the average values obtained using the methodology of [13] and the auditory MOS values for the same databases.
An inspection of Table 5 shows that there is a spread in the Ie,WB values derived by WB-PESQ from different
Table4: Average maximum valuesRmaxderived with different signal-based models for Databases 1–6, using different fitting functions, and
corresponding root mean square errorsσ.
WB-PESQ TOSQA-2001 Mod. WB-PESQ
Eq. Rmax σ Rmax σ Rmax σ
(6) 130.0 4.21 127.5 11.63 129.1 3.00
(7) 123.9 3.82 107.1 5.54 131.5 2.86
(8) 130.3 4.21 127.5 11.63 138.4 2.87
Table5: Impairment factor valuesIe,WBfor WB and NB speech codecs, derived on the basis of WB-PESQ estimations. Values in the last
column have been calculated according to (10) using the defined values of ITU-T Rec. G.113 [10].
Band. Codec Bit-rate Database no. Average Expected
(kbit/s) 1 2 3 4 5 7 from G.113
WB
Clean 256 −11 −6 −21 −17 −10 −13.1 0
G.722 64 22 30 17 12 22 20.8 13
G.722 56 24 21 23 34 25.5 20
G.722 48 28 31 30 41 32.5 31
G.722.1 32 26 32 26 28.0 13
G.722.1 24 32 29 34 29 30.9 19
G.722.2 6.6 70 59 62 63.6 41
G.722.2 8.85 46 51 52 49.5 26
G.722.2 12.65 29 32 38 33.0 13
G.722.2 14.25 30 30.3 10
G.722.2 15.85 29 29 29.2 7
G.722.2 18.25 26 26.1 5
G.722.2 19.85 26 25.7 3
G.722.2 23.05 10 24 16.7 1
G.722.2 23.85 43 20 24 24 27.8 8
G.729EV(a) 32 15 15.3
G.729EV(a) 24 19 19.0
NB
G.711 64 32 19 13 22 34 25.6 36
G.726 32 42 41 43 43.3 43
G.726 24 60 58 60 59.7 61
G.726 16 82 82 85 82.2 86
G.728 16 42 42 49 45.2 43
G.729 8 48 51 46 46 48.4 46
GSM-EFR 12.2 40 40 42.0 41
GSM-FR 13 61 72 49 60.8 56
(a)G.729EV refers to the prepublished version of the ITU-T Rec. G.729.1 [7] standard.
Modified WB-PESQ and the TOSQA-2001 models which are not reproduced here, in order to save space. The spread is due to the different voices and sentences used in each database, as well as to slight differences in the basic quality (slight noise floor and filtering differences). It is slightly smaller than the spread observed in the Ie,WB values derived from auditory
values in [3]. As mentioned inSection 4.3, the auditory test results are influenced by the corpus effect. Therefore, even though a normalization procedure is applied, theIe,WBvalues
derived from auditory test results still slightly reflect the differences in the judgments of different test corpora. This effect is ruled out by the instrumental model, leading to a smaller spread in the estimations. However, this does not
imply any superiority of the instrumental approach: as the instrumental models only aim to predict what would have been observed in an auditory test, the latter can still be regarded as the reference for our approach.
In some cases, the normalizationstep (Section 2, point 5) results in negative Ie,WB values. The corresponding test
conditions apparently show a very high rating compared to the other conditions of that database. Still, we prefer to keep the normalization step in order to bring the Ie,WB
values in line with theIe values known for the NB codecs,
Table6: Average impairment factor valuesIe,WB for WB and NB speech codecs, derived using different signal-based models and auditory
tests. Values in the column “Audit. test” have been calculated from the auditory results of the same databases, and values in the last column have been calculated according to (10) using the defined values of ITU-T Rec. G.113 [10].
Band. Codec Bit-rate AverageIe,WBvalue Expected
(kbit/s) WB-PESQ TOSQA-2001 Mod. WB-PESQ Average DB 1–5 Audit. test from G.113
WB
Clean 256 −13 −18 −36 −22 −15 0
G.722 64 21 −6 0 5 10 13
G.722 56 31 −5 7 11 25 20
G.722 48 38 7 18 21 33 31
G.722.1 32 28 −2 13 13 12 13
G.722.1 24 31 14 21 22 15 19
G.722.2 6.6 64 34 44 47 40 41
G.722.2 8.85 51 19 25 32 29 26
G.722.2 12.65 33 10 3 16 5 13
G.722.2 14.25 30 −8 12 11 −1 10
G.722.2 15.85 29 −10 17 12 2 7
G.722.2 18.25 26 −13 6 6 −12 5
G.722.2 19.85 26 −15 6 6 −8 3
G.722.2 23.05 17 −5 −15 −1 −16 1
G.722.2 23.85 28 4 12 14 7 8
G.729EV(a) 32 15 9 −18 2 13
G.729EV(a) 24 19 21 −12 9 13
NB
G.711 64 26 28 29 28 33 36
G.726 32 44 38 45 42 49 43
G.726 24 60 48 60 56 76 61
G.726 16 82 77 81 80 81 86
G.728 16 43 41 44 43 45 43
G.729 8 48 56 46 50 41 46
GSM-EFR 12.2 42 42 43 42 35 41
GSM-FR 13 61 53 60 58 57 56
(a)G.729EV refers to the prepublished version of the ITU-T Rec. G.729.1 [7] standard.
that the normalization step leads to averaged Ie,WB values
for the NB conditions estimated with all three instrumental models which are close to those obtained from the auditory tests.
6.3. Prediction Accuracy for Different Signal-Based Models.
For the WB conditions, the averagedIe,WBvalues ofTable 6
vary significantly between models. Correlations to values derived from auditory scores are between:
ρ=0.850 for WB-PESQ (σ=14.25),
ρ=0.890 for Modified WB-PESQ (σ=12.35),
ρ=0.908 for TOSQA-2001 (σ=11.33).
The correlation for Ie,WBis highest with TOSQA-2001 and
the modified version of WB-PESQ. It can still be increased by averaging the estimations of all three signal-based models, leading to a correlation of ρ = 0.928 (σ = 10.06) betweenIe,WBvalues derived from auditory scores and model
estimations. Comparing the results to the values which have recently been defined in ITU-T Rec. G.113 [10], the correlations vary between:
ρ=0.865 for WB-PESQ (σ=11.48),
ρ=0.934 for Modified W-BPESQ (σ=8.17),
ρ=0.956 for TOSQA-2001 (σ=6.72);
this results in a correlation with the three model averages of
ρ=0.957 (σ =6.63). The overall range of these correlations shows that—on an average—Ie,WBvalues can quite reliably
be estimated with the instrumental approach.
However, there are significant differences between the estimations of individual models. First, a shift of about 21 units can be observed for Ie,WB of WB codecs between
the WB-PESQ and its modified version. We think that the modified frequency compensation of Modified WB-PESQ leads to an over-estimation of the noise floor degradation for the NB conditions. The latter are normalized to the defined values in step (5), which leads to the observed shift for the WB conditions, and a particularly low value (−36) for the “direct” WB channel. Still, the correlation betweenIe,WBvalues derived from auditory scores and model
estimations is higher than the one of the original WB-PESQ model. Overall, the Ie,WB values derived from
all WB codecs (except for the “direct” channel, due to the normalization).
6.4. Predictions for Different Codecs of One Family. When decreasing the bit-rate, the order of Ie,WB values for each
codec follows the one of the defined values. The same can be observed for the other two models: with very few exceptions, the order of degradations associated with codec variants of the same family is mainly predicted by the models. The exceptions are due to the fact that not all bit-rates were included in all tests; as a consequence, some of the values are based on one or two databases only. These exceptions are a strong limitation of the presented method. The derived
Ie,WB values should be stable over the different databases
and thus values based on one database only should have the same accuracy as values based on many databases. This is not the case in Table 5, due to the different number and type of codecs included in each test corpus. Therefore, [15] recommends to include a minimum of 12 reference codecs in such calculations in order to derive stable Ie,WB
values.
6.5. Predictions for Codecs from Different Families. Unfor-tunately, the relationships between Ie,WB for codecs from
different families is not necessarily reflected in the estima-tions, see Table 6. Thus, the procedure may be used for establishing a quality relationship between different codec versions (corresponding to different bit-rates) of the same codec family, but not necessarily to compare the quality of different codecs belonging to different families. This is an important finding which limits the applicability of the derivation procedure.
6.6. Summary. The overall magnitude ofIe,WBvalues derived
with the help of TOSQA-2001 seems to be best in line with the auditory method. In turn, the prediction error is slightly smaller with Modified WB-PESQ. By averaging the three model estimates, quite reliable estimates of Ie,WB for WB
codecs can be obtained. The corresponding values for the NB codecs show that the methodology produces values which are well in line with the impairment factorsIeof the current
E-model.
7. Packet-Loss Degradations
Wideband speech codecs will frequently be used in packet-based networks, and as a consequence packet loss will be effective, either by packets not arriving at all at the receiver side, or by packets which have to be discarded by the receiving jitter buffer because they arrive too late. Databases 1, 3, 4, and 5 contain stimuli where random packet loss has been simulated, using the model given in [34]. These samples have been analyzed with the three signal-based models, and
Bpl,WB values to be used in (2) have been calculated by
minimizing the mean squared error between the curve of (2) and the data points. In this case,Ie,WB,eff values are limited
to 0 to avoid strong negative values. Figure 6 presents the
Ie,WB,effvalues derived from the 3 model estimations for an
0 20 40 60 80 100 120
0 20 40 60 80 100
Extrapolation
Ie,WB,insvalues
KnownIe,WBvalues
Estimat
ed
Ie,WB
val
ues
Figure5: Exemplary normalization procedure for Database 1 with knownIe,WBandIe,WB,insvalues derived from Modified WB-PESQ
estimations.
0 2 4 6 8 10
10 20 30 40 50 60 70 80 90
Percentage packet-lossPpl(%) WB-PESQ
TOSQA-2001 Mod. WB-PESQ
Estimat
ed
Ie,WB
,e
ff
val
u
es
Figure6:Ie,WB,effvalues derived from the 3 signal-based models and
the auditory experiment for G.722.2 at 8.85 kbit/s.
example codec included in Database 5. The relationships according to (2), estimated for each model, are presented as lines in this figure.Table 7lists the obtainedBpl,WBvalues and
compares them to the values derived from auditory scores following the same procedure. EachBpl,WBvalue is estimated
using 4 or 5 packet-loss conditions (Ie,WB,eff/Ppl) and then
averaged over 1 to 3 databases.
A comparison to the values obtained from the auditory tests in [3] shows that the Bpl,WB values derived with
Table7: Packet-loss robustness factorsBpl,WBderived from Databases 1, 3, 4, and 5 (random packet losses).Conditionsrefers to the number
of packet-loss conditions used to derive theBpl,WBparameters.
Codec Bit-rate Databases AverageBpl,WBvalue
(kbit/s) (conditions) WB-PESQ TOSQA-2001 Mod. WB-PESQ Average Auditory test
G.722 64 3(5), 4(5) 2.8 8.5 3.1 4.8 1.6
G.722.1 32 3(5), 4(5), 5(4) 6.3 9.7 5.5 7.1 6.3
G.722.1 24 1(3), 3(5), 4(5) 8.4 13.2 8.0 9.9 6.2
G.722.2 6.6 4(5) 7.8 15.4 7.8 10.3 6.6
G.722.2 8.85 4(5), 5(4) 5.8 11.3 5.7 7.6 5.6
G.722.2 12.65 4(5), 5(4) 5.5 11.2 5.7 7.5 5.2
G.722.2 14.25 4(5) 8.1 14.0 7.9 10.0 7.5
G.722.2 15.85 3(5), 4(5) 7.9 11.2 7.3 8.8 7.8
G.722.2 18.25 4(5) 7.9 14.9 7.9 10.3 7.6
G.722.2 19.85 4(5) 7.9 15.8 8.0 10.6 8.1
G.722.2 23.05 4(5) 7.9 15.7 7.9 10.5 9.5
G.722.2 23.85 3(5), 4(5), 5(4) 5.6 10.0 5.6 7.1 5.2
G.729EV(a) 32 5(4) 5.2 13.9 9.0 9.4 9.4
G.729EV(a) 24 5(4) 5.6 16.0 8.4 10.0 10.0
(a)G.729EV refers to the prepublished version of the ITU-T Rec. G.729.1 [7] standard.
underestimates the degradation of packet loss and predicts a higher robustness towards packet-loss effects (and con-sequently higher Bpl,WB values). In turn, both WB-PESQ
and in particular the modified version of WB-PESQ provide reasonable estimations of the values obtained in the auditory test (with the exception of the FT codec for WB-PESQ). The correlation coefficients between Bpl,WBvalues derived from
auditory scores and model estimations varies between:
ρ=0.54 for WB-PESQ,
ρ=0.79 for TOSQA-2001,
ρ=0.90 for Modified WB-PESQ.
Especially the latter model seems to be adequate for the instrumental procedure deriving packet-loss robustness factors, for a later use with the E-model. However, the correlation for the WB-PESQ model increases toρ = 0.89 without the two FT candidate codec conditions.
8. Conclusions
We described a method for deriving equipment impairment factors and packet-loss robustness factors for wideband speech codecs. In order to avoid costly and time-consuming tests, and in order to be in line with corresponding methods available for NB codecs [46], the employed method is based on the estimations of signal-based models. The derived
Ie,WBvalues can be used in conjunction with a future WB
extension of the E-model, in order to plan future mixed NB/WB networks. The method we applied has recently been approved by Study Group 12 of the T as a new ITU-T Rec. P.834.1 [15], see also [47], emphasizing the need for such a standardized method to determine wideband speech codec degradations.
Our work was guided by three research questions which can be answered for the instrumental models and databases used here.
(1) When migrating from NB to WB, we found that the extension to be made to the NBR-scale is around 30%, which is very similar to the value found with auditory tests. Thus, both auditory and instrumental methods make use of the same scale range. This is an important prerequisite for deriving input parameters to the E-model with the help of both—auditory and instrumental—methods.
(2) The Ie,WB values derived with our three models—
WB-PESQ, Modified WB-PESQ and TOSQA-2001— are generally in line with those derived from auditory scores, with an overall correlation of betweenρ =
0.85 andρ = 0.91. Best estimates can be obtained not from the current ITU-T standard WB-PESQ, but from a simple modification of it, or from TOSQA-2001. When averaging the three model estimates, the correlation increases slightly, showing that a combination of models is able to rule out some of the insufficiencies associated with individual models. With few exceptions, the models are able to predict the degradations associated with different bit-rates of the same codec family in the right order. However, the models are not always able to predict the relationship of degradations associated with codecs of different
families in the right way.
(3) Applying the method further to derive packet-loss robustness factors Bpl,WB leads in many cases to
extend also the unmodified version of this model pro-vide a reasonable estimation of the codec robustness, TOSQA-2001 mainly over-estimatesBpl,WB.
The observed correlation coefficients lead us to the conclusion that signal-based models are useful for estimating meaningful Ie,WB and Bpl,WB values as an input to the
E-model. A rough estimate ofIe,WBfor individual codecs can
be obtained with Modified WB-PESQ or TOSQA-2001, or by averaging different model estimates. Still, the predictions should be used with some care whenordering different codec familieswith respect to their impact on overall mouth-to-ear quality. However, using the right model, a prediction of the impact of codec bit-ratewithin one codec familycan be made in most cases. Further work is necessary to better quantify the quality impact of codec tandems. Estimating the robustness of a particular codec towards packet-loss is possible for most codec families, using, for example, the modified version of WB-PESQ.
ForIe,WB, averaging of different models slightly increases
the prediction accuracy. We further expect that the method proposed here will provide better results when a better signal-based speech quality model becomes available. Such a model should especially focus on the relationship of degradations introduced by different types of codecs. In addition, it needs to validly estimate the impact of packet losses, which seems to be underestimated by some of the currently available models. A new signal-based model which might be used for this purpose is underway in ITU-T Study Group 12. This future recommended model will provide quality estimations in a super-wideband (S-WB) context, that is, f ∈[50; 14000] Hz. We assume that the methodology described here and recommended in [15] is still valid using signal-based models providing quality estimations in such a context, but this aspect needs further experimental validation.
As soon as better instrumental models for estimating codec and packet-loss impact become available, the method described here can be reassessed in the light of the new results. In addition, the stability of the normalized Ie,WB
values depends on the number of values defined in ITU-T Rec. G.113 [10]. Therefore, the normalization procedure may benefit of more Ie,WB values being available. Recently,
values for the ITU-T Rec. G.711.1 [9] speech codec have been defined in ITU-T Rec. G.113 [10]. Still, more reference values for further wideband speech codecs would definitely be desirable.
Apart from codec and packet loss, other degradations need to be taken into account by a future WB E-model as well. For example, speech level [48] has proven to be different for NB and WB transmission in some preliminary studies. Besides degradations affecting the listening-only situation, the conversational impact of talker echo and delay needs to be modeled. In this way, a complete WB version of the E-model can be set up, and first steps are already documented by Raake et al. [49]. The method described in this paper will be very helpful in order to guarantee that the final model is fully based on input parameters which can be derived from
instrumental models, without a further need for auditory tests to specify the parameters.
Acknowledgments
The present work has been performed in a collaboration between Deutsche Telekom Laboratories (TU Berlin, Ger-many), France T´el´ecom R&D (Lannion, France), the Uni-versity of Tsukuba (Japan), and the NTT Service Integration Laboratories (Tokyo, Japan). It was partly supported by the German Research Fund (DFG) under the project MO-1038/5-2. It was also partly supported by the Strategic Infor-mation and Communications R&D Promotion Programme (SCOPE) in Japan under the project 073103002. The authors would like to thank all involved organizations for their support, as well as T-Systems Enterprise Services GmbH, Berlin (Mr. H. Klaus), for providing the TOSQA model, and the three reviewers for helpfull comments on an earlier version of this paper.
References
[1] ETSI ETR 250,Transmission and Multiplexing (TM); Speech Communication Quality from Mouth to Ear for 3.1 kHz Handset Telephony Across Networks, European Telecommunications Standards Institute, Sophia, Antipolis, 1996.
[2] ITU–T Rec. G.107,The E-Model, A Computational Model for Use in Transmission Planning, International Telecommunica-tion Union, Geneva, Switzerland, 2008.
[3] S. M¨oller, A. Raake, N. Kitawaki, A. Takahashi, and M. W¨altermann, “Impairment factor framework for wide-band speech codecs,” IEEE Transactions on Audio, Speech and Language Processing, vol. 14, no. 6, pp. 1969–1976, 2006. [4] ITU–T Rec. G.722, 7 kHz Audio-Coding within 64 kbit/s,
International Telecommunication Union, Geneva, Switzer-land, 1988.
[5] ITU–T Rec. G.722.1, Low-Complexity Coding at 24 and 32 kbit/s for Hands-Free Operation in Systems With Low Frame Loss, International Telecommunication Union, Geneva, Switzerland, 2005.
[6] ITU–T Rec. G.722.2, Wideband Coding of Speech at Around 16 kbit/s Using Adaptive Multi-Rate Wideband (AMR-WB), International Telecommunication Union, Geneva, Switzer-land, 2003.
[7] ITU–T Rec. G.729.1, G.729 Based Embedded Variable Bit-Rate Coder: An 8-32 kbit/s Scalable Wideband Coder Bitstream Interoperable with G.729, International Telecommunication Union, Geneva, Switzerland, 2006.
[8] ITU–T Rec. G.718, Frame Error Robust Narrow-Band and Wideband Embedded Variable Bit-Rate Coding of Speech and Audio from 8-32 kbit/s, International Telecommunication Union, Geneva, Switzerland, 2008.
[9] ITU–T Rec. G.711.1,Wideband Embedded Extension for G.711 Pulse Code Modulation, International Telecommunication Union, Geneva, Switzerland, 2008.
[10] ITU–T Rec. G.113,Transmission Impairments Due to Speech Processing, International Telecommunication Union, Geneva, Switzerland, 2009.
[11] A. Raake,Speech Quality of VoIP—Assessment and Prediction, John Wiley & Sons, Chichester, UK, 2006.
[13] ITU–T Rec. P.833.1,Methodology for the Derivation of Equip-ment ImpairEquip-ment Factors from Subjective Listening-only Tests for Wideband Speech Codecs, International Telecommunica-tion Union, Geneva, Switzerland, 2008.
[14] ITU–T Rec. P.833,Methodology for Derivation of Equipment Impairment Factors from Subjective Listening-Only Tests, Inter-national Telecommunication Union, Geneva, Switzerland, 2001.
[15] ITU–T Rec. P.834.1, Extension of the Methodology for the Derivation of Equipment Impairment Factors from Instrumental Models for Wideband Speech Codecs, International Telecom-munication Union, Geneva, Switzerland, 2009.
[16] ITU–T Rec. P.79, Calculation of Loudness Ratings for Tele-phone Sets, International Telecommunication Union, Geneva, Switzerland, 2007.
[17] A. Raja, R. M. A. Azad, C. Flanagan, and C. Ryan, “A method-ology for deriving VoIP equipment impairment factors for a mixed NB/WB context,”IEEE Transactions on Multimedia, vol. 10, no. 6, pp. 1046–1058, 2008.
[18] S. M¨oller, N. Cˆot´e, A. Kurushima, N. Egi, and A. Takahashi, “Quantifying wideband speech codec degradations via impair-ment factors: the new ITU–T P.834.1 methodology and its application to the G.711.1 codec,” inProceedings of the 10th Annual Conference of the ISCA (Interspeech ’09), pp. 2563– 2566, Brighton, UK, 2009.
[19] ITU–T Rec. P.830, Subjective Performance Assessment of Telephoneband and Wideband Digital Codecs, International Telecommunication Union, Geneva, Switzerland, 1996. [20] A. W. Rix, J. G. Beerends, D.-S. Kim, P. Kroon, and O.
Ghitza, “Objective assessment of speech and audio quality— technology and applications,” IEEE Transactions on Audio, Speech and Language Processing, vol. 14, no. 6, pp. 1890–1901, 2006.
[21] ITU–T Rec. P.862, Perceptual Evaluation of Speech Quality (PESQ): An Objective Method for End-to-End Speech Quality Assessment of Narrowband Telephone Networks and Speech Codecs, International Telecommunication Union, Geneva, Switzerland, 2001.
[22] ITU–T Rec. P.862.2,Wideband Extension to Recommendation P.862 for the Assessment of Wideband Telephone Networks and Speech Codecs, International Telecommunication Union, Geneva, Switzerland, 2007.
[23] N. Cˆot´e, V. Gautier-Turbin, A. Raake, and S. M¨oller, “Analysis of a quality prediction model for wideband speech quality, the WB-PESQ,” inProceedings of the 2nd ISCA/DEGA Tutorial and Research Workshop on Perceptual Quality of Systems, pp. 115– 122, Berlin, Germany, September 2006.
[24] J. Berger, Instrumentelle Verfahren zur Sprachqualit¨atssch¨atzung—Modelle Auditiver Tests, Shaker, Aachen, Germany, 1998.
[25] ITU–T Contr. C.19,Results of Objective Speech Quality Assess-ment of Wideband Speech Using the Advanced TOSQA2001, International Telecommunication Union, Geneva, Switzer-land, 2000.
[26] ITU–T Rec. P.861, Objective Quality Measurement of Telephone-band (300-3400 Hz) Speech Codecs, International Telecommunication Union, Geneva, Switzerland, 1998. [27] A. Rix, R. Reynolds, and M. Hollier, “Perceptual measurement
of end-to-end speech quality over audio and packet-based networks,” in106th AES Convention, 1999, 4873.
[28] ITU–T Rec. P.48,Specification for an Intermediate Reference System, International Telecommunication Union, Geneva, Switzerland, 1988.
[29] A. W. Rix, M. P. Hollier, A. P. Hekstra, and J. G. Beerends, “Perceptual evaluation of speech quality (PESQ): the new ITU standard for end-to-end speech quality assessment. Part I— time-delay compensation,”Journal of the Audio Engineering Society, vol. 50, no. 10, pp. 755–764, 2002.
[30] J. G. Beerends, A. P. Hekstra, A. W. Rix, and M. P. Hollier, “Perceptual evaluation of speech quality (PESQ): the new ITU standard for end-to-end speech quality assessment. Part II—psychoacoustic model,”Journal of the Audio Engineering Society, vol. 50, no. 10, pp. 765–778, 2002.
[31] ITU–T Rec. P.862.1,Mapping Function for Transforming P.862 Raw Result Scores to MOS-LQO, International Telecommuni-cation Union, Geneva, Switzerland, 2003.
[32] ITU–T Del. Contr. D.7,Proposed Modification to Draft P.862 to Allow PESQ to Be Used for Quality Assessment of Wideband Speech, International Telecommunication Union, Geneva, Switzerland, 2001.
[33] A. Takahashi, A. Kurashima, C. Morioka, and H. Yoshino, “Objective quality assessment of wideband speech by an extension of ITU-T recommendation P.862,” in Proceedings of the 9th European Conference on Speech Communication and Technology, pp. 3153–3156, Lisbon, Portugal, September 2005. [34] ITU–T Rec. G.191,Software Tools for Speech and Audio Cod-ing Standardization, International Telecommunication Union, Geneva, Switzerland, 2005.
[35] E. Zwicker,Psychoakustik, Springer, Berlin, Germany, 1982. [36] ITU–T Contr. C.20, Results of Objective Speech
Qual-ity Assessment Including Receiving Terminals Using the Advanced TOSQA2001, International Telecommunication Union, Geneva, Switzerland, 2000.
[37] V. Barriac, J. Y. Sout, and C. Lockwood, “Discussion on unified objective methodologies for the comparison of voice quality of narrowband and wideband scenarios,” in Proceedings of Workshop on Wideband Speech Quality in Terminals and Networks: Assessment and Prediction, Mainz, Germany, 2004. [38] N. Cˆot´e, Qualit´e Perc¸ue de Parole Transmise par Voie
T´el´ephonique Large-Bande, M.S. thesis, Universit´e Pierre et Marie Curie, Paris, France, 2005.
[39] ITU–T Del. Contr. D.33,Subjective Quality Assessment Result forWideband Speech Coding, International Telecommunication Union, Geneva, Switzerland, 2005.
[40] ITU–T Del. Contr. D.149, Equipment Impairment Factor Ie and Packetloss Robustness Factor Bpl for Wideband Speech Codecs, International Telecommunication Union, Geneva, Switzerland, 2006.
[41] ITU–T Suppl. 23 to P-Series Rec., ITU–T Coded-Speech Database, International Telecommunication Union, Geneva, Switzerland, 1998.
[42] ITU–T Rec. P.862.3,Application Guide for Objective Quality Measurement Based on Recommendations P.862, P.862.1 and P.862.2, International Telecommunication Union, Geneva, Switzerland, 2005.
[43] ITU–T Temp. Doc. TD.65,Quality Assessment Qualification Test Plan for the ITU–T G.729 Based Embedded Variable Bit-Rate (G.729EV) Extension to the ITU–T G.729 Speech Codec, International Telecommunication Union, Geneva, Switzer-land, 2005.
[44] ITU–T Temp. Doc. TD.71,Qualification Phase of G729EV: Test Results (Exp 1-4), International Telecommunication Union, Geneva, Switzerland, 2005.
[46] ITU–T Rec. P.834,Methodology for the Derivation of Equip-ment ImpairEquip-ment Factors from InstruEquip-mental Models, Interna-tional Telecommunication Union, Geneva, Switzerland, 2002. [47] ITU–T Contr. C.43,Proposed Text for a New Recommendation P.834.1 “Extension of the Methodology for the Derivation of Equipment Impairment Factors from Instrumental Models for Wideband Speech Codecs, International Telecommunication Union, Geneva, Switzerland, 2009.
[48] N. Cˆot´e, V. Gautier-Turbin, and S. M¨oller, “Influence of loudness level on the overall quality of transmitted speech,” inProceedings of the 123rd Convention of the Audio Engineering Society, New York, NY, USA, 2007.